
MyBox User Guide – Data Tools v6.7.1
MyBox: Easy Tools Set
User Guide – Data Tools
Author: Mara
Version: 6.7.1
Date: 2023-3-13
Contents
1 Introduction 8
1.1 Main Interface 8
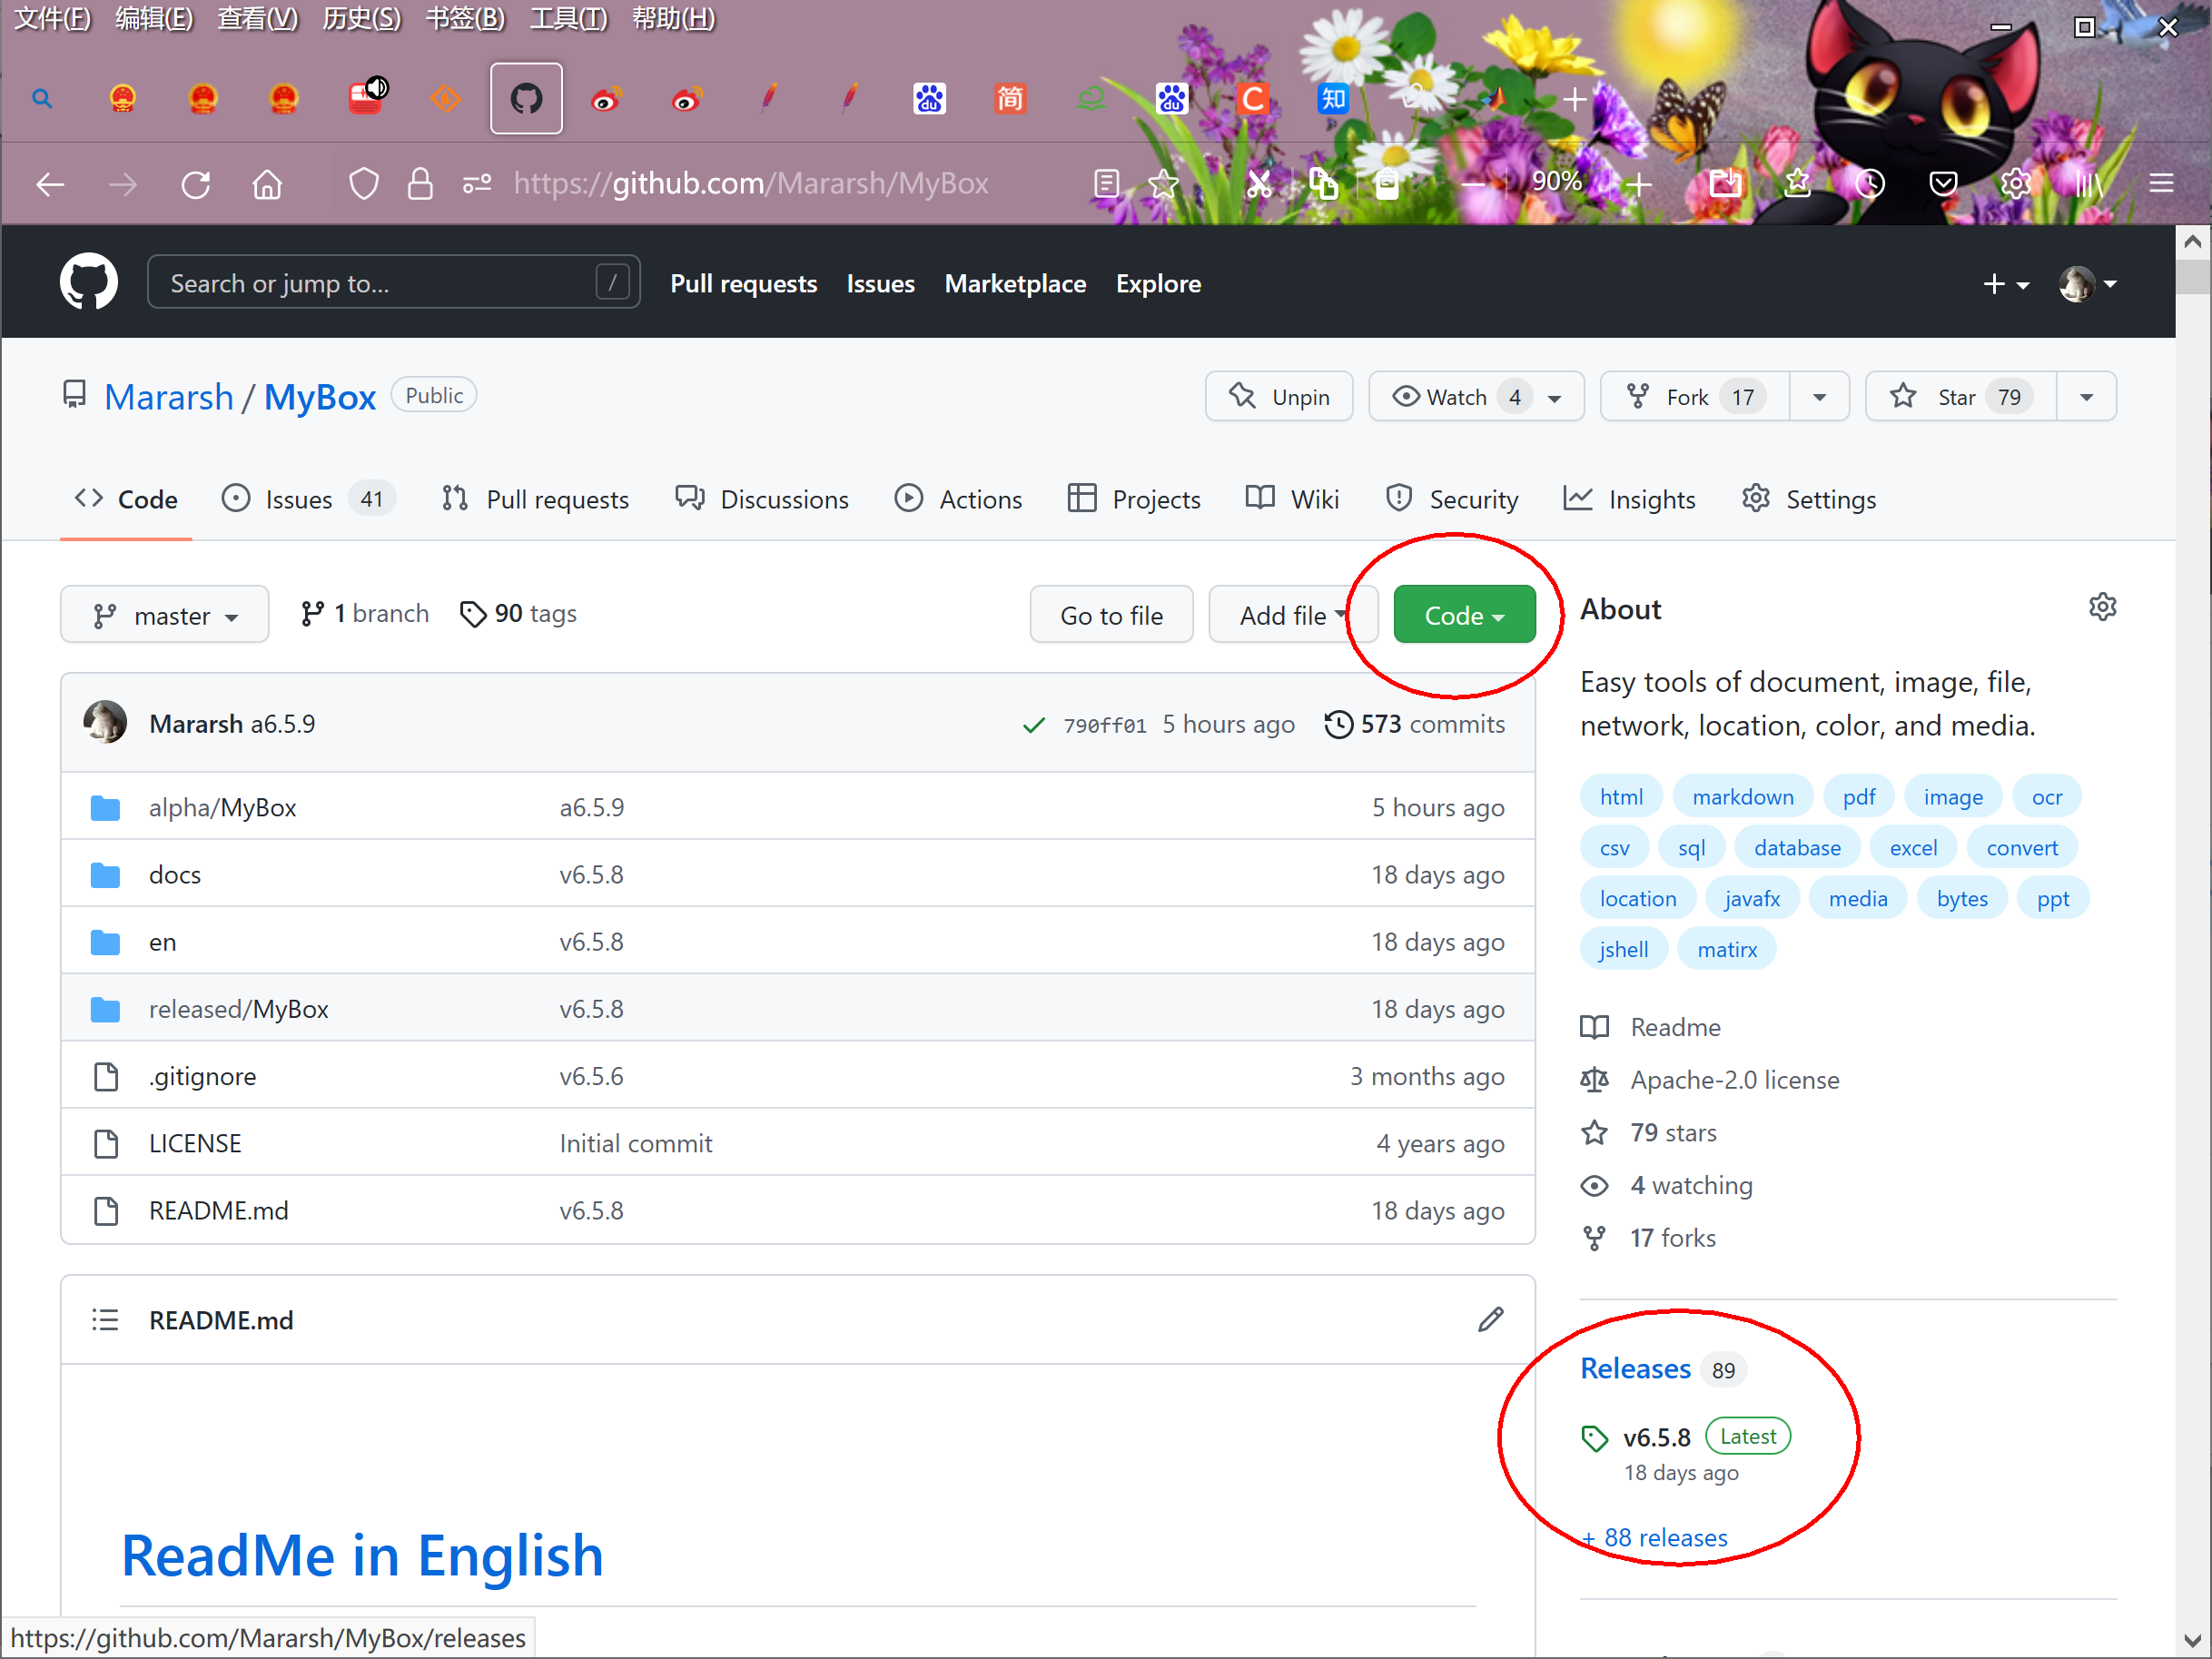
1.2 Resources Addresses 9
1.3 Documents 10
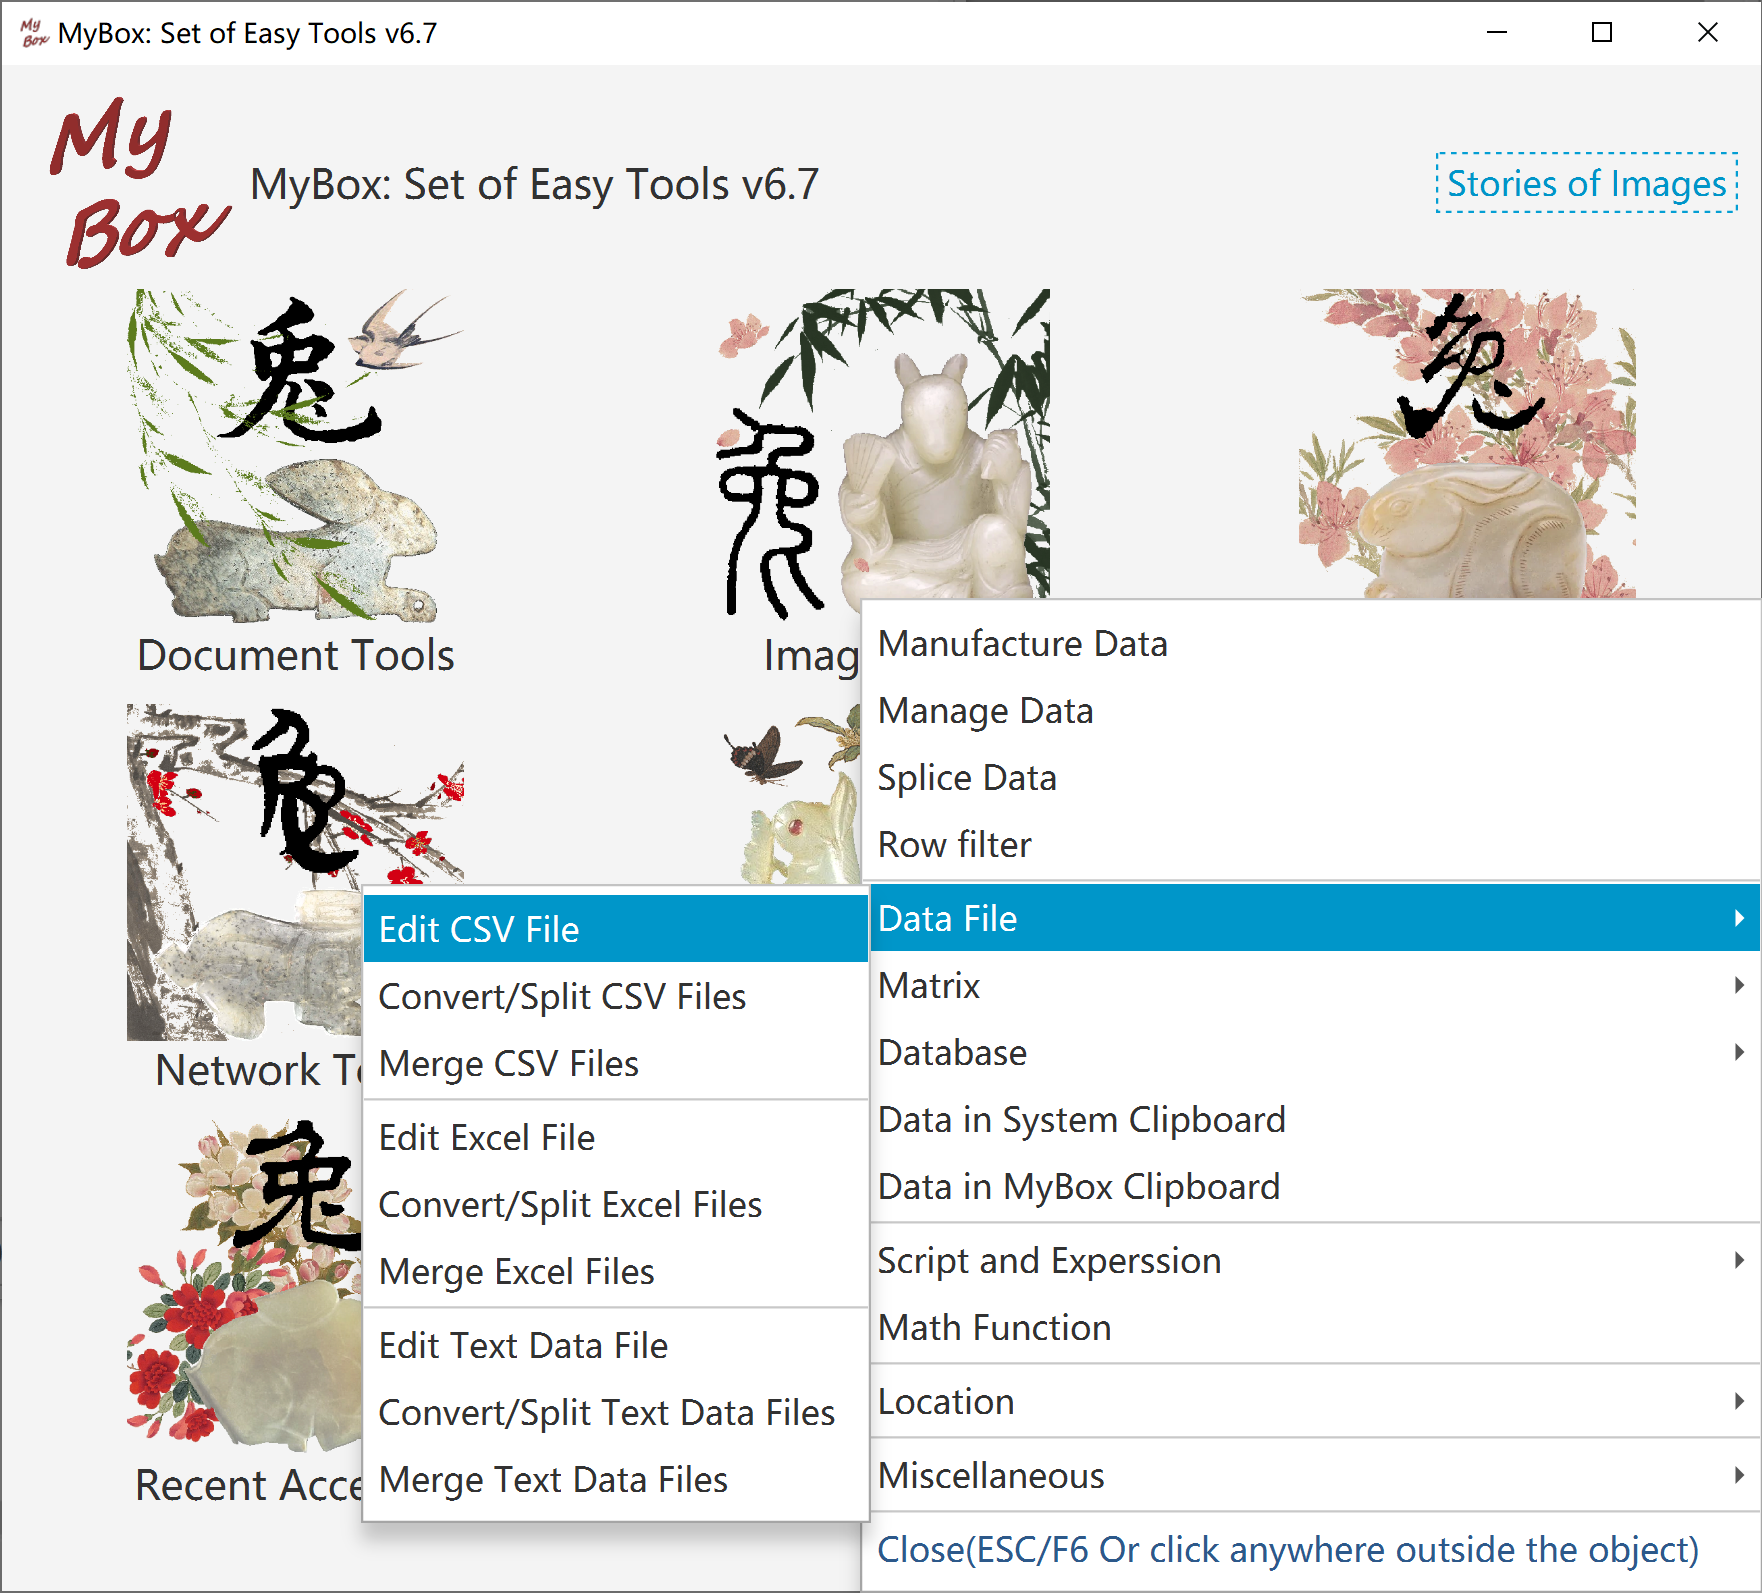
1.4 Menu of Tools 12
2 Data in Two-dimensional Storage Structure 13
2.1 Data Objects 13
2.2 Functions Menu 14
2.3 Define Columns 15
2.3.1 Interface of Columns Management 15
2.3.2 Types of Columns 16
2.3.3 Format of Column 17
2.3.3.1 Format for Numbers 17
2.3.3.2 Format for Datetime/Date 18
2.3.3.3 Format for Era 19
2.3.3.4 Define Enumeration 20
2.3.4 Handle Invalid Values 20
2.4 Usages of Columns 21
2.4.1 Load Data 21
2.4.2 Display Data 21
2.4.3 Controls for editing 22
2.4.4 Edit Data Cell 23
2.4.5 Save Data 25
2.4.6 Calculate Data 25
2.4.7 Sort Data 26
2.4.8 Color of Column 26
2.5 Edit Data 27
2.5.1 Mode "Table" 27
2.5.2 Mode "CSV" 28
2.5.3 Save and Recover 29
2.6 View Data 30
2.6.1 View Html 30
2.6.2 View CSV 31
2.7 Define Data Attributes 32
2.8 Row Expression 33
2.8.1 Usages of Row Expression 33
2.8.2 Edit Row Expression 33
2.8.3 Calculate Row Expression 34
2.8.4 Examples 34
2.9 Row Filter 35
2.9.1 Usages of Row Filter 35
2.9.2 Edit Row Filter 35
2.9.3 Exmaples 36
2.10 Group Rows 37
2.10.1 Before and after Grouping 37
2.10.2 Usages of grouping 37
2.10.3 Ways of Data Grouping 37
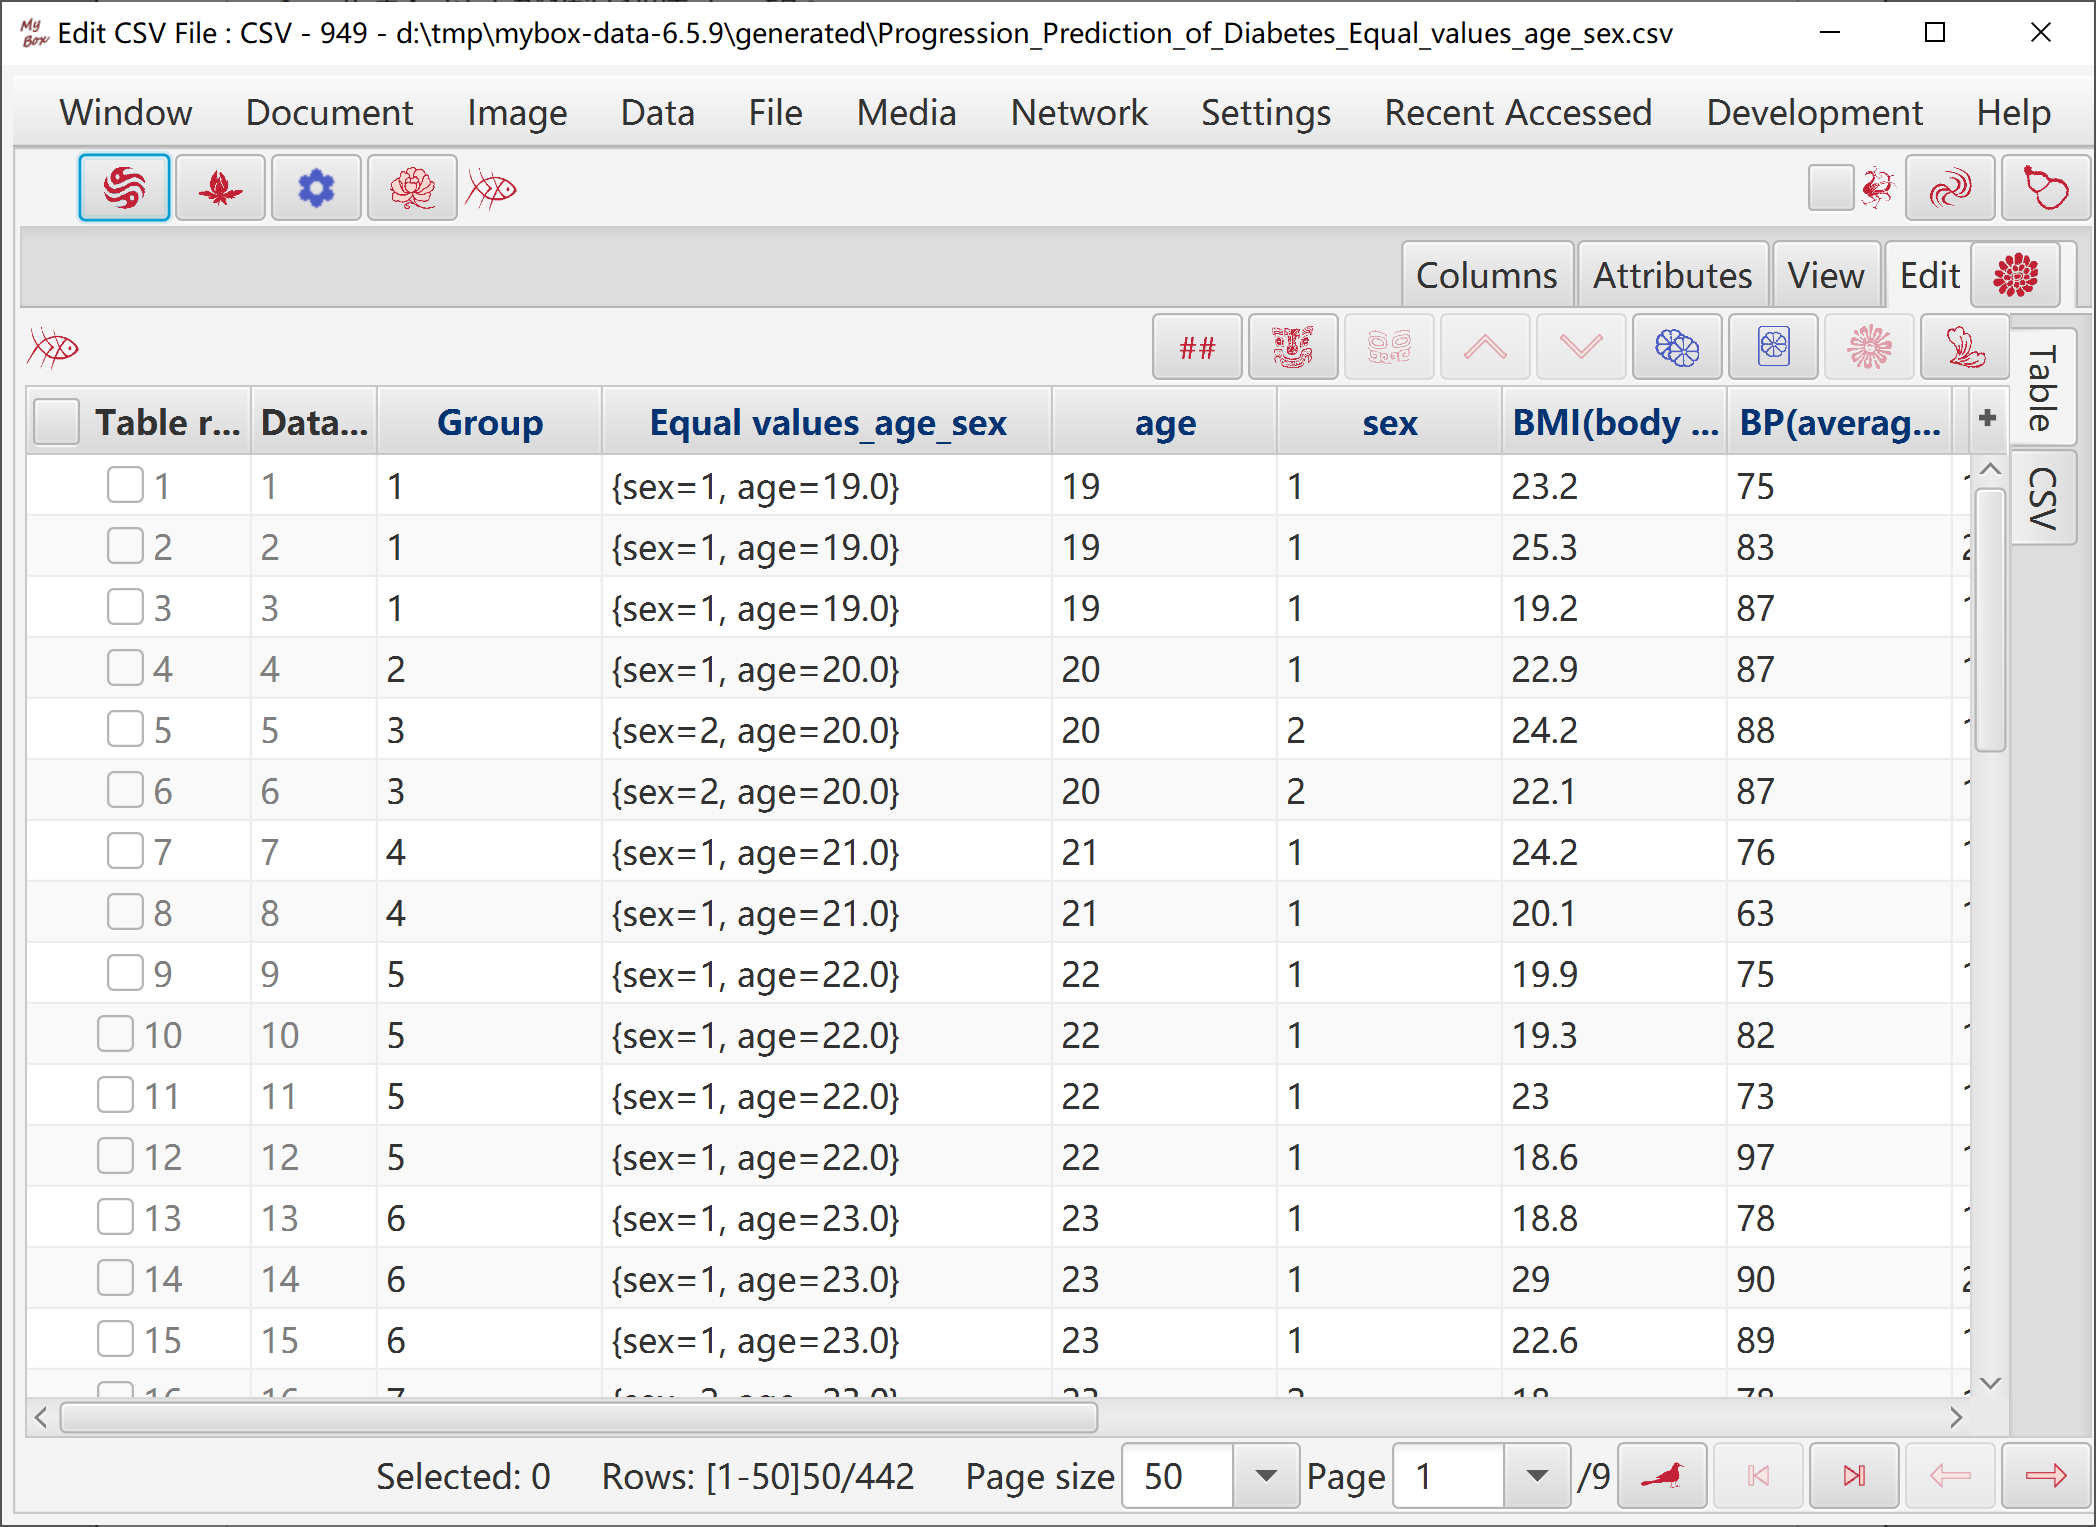
2.10.4 Group by Equal Values 38
2.10.4.1 Way of Grouping 38
2.10.4.2 Implementation of Grouping 38
2.10.4.3 Results of Grouping 39
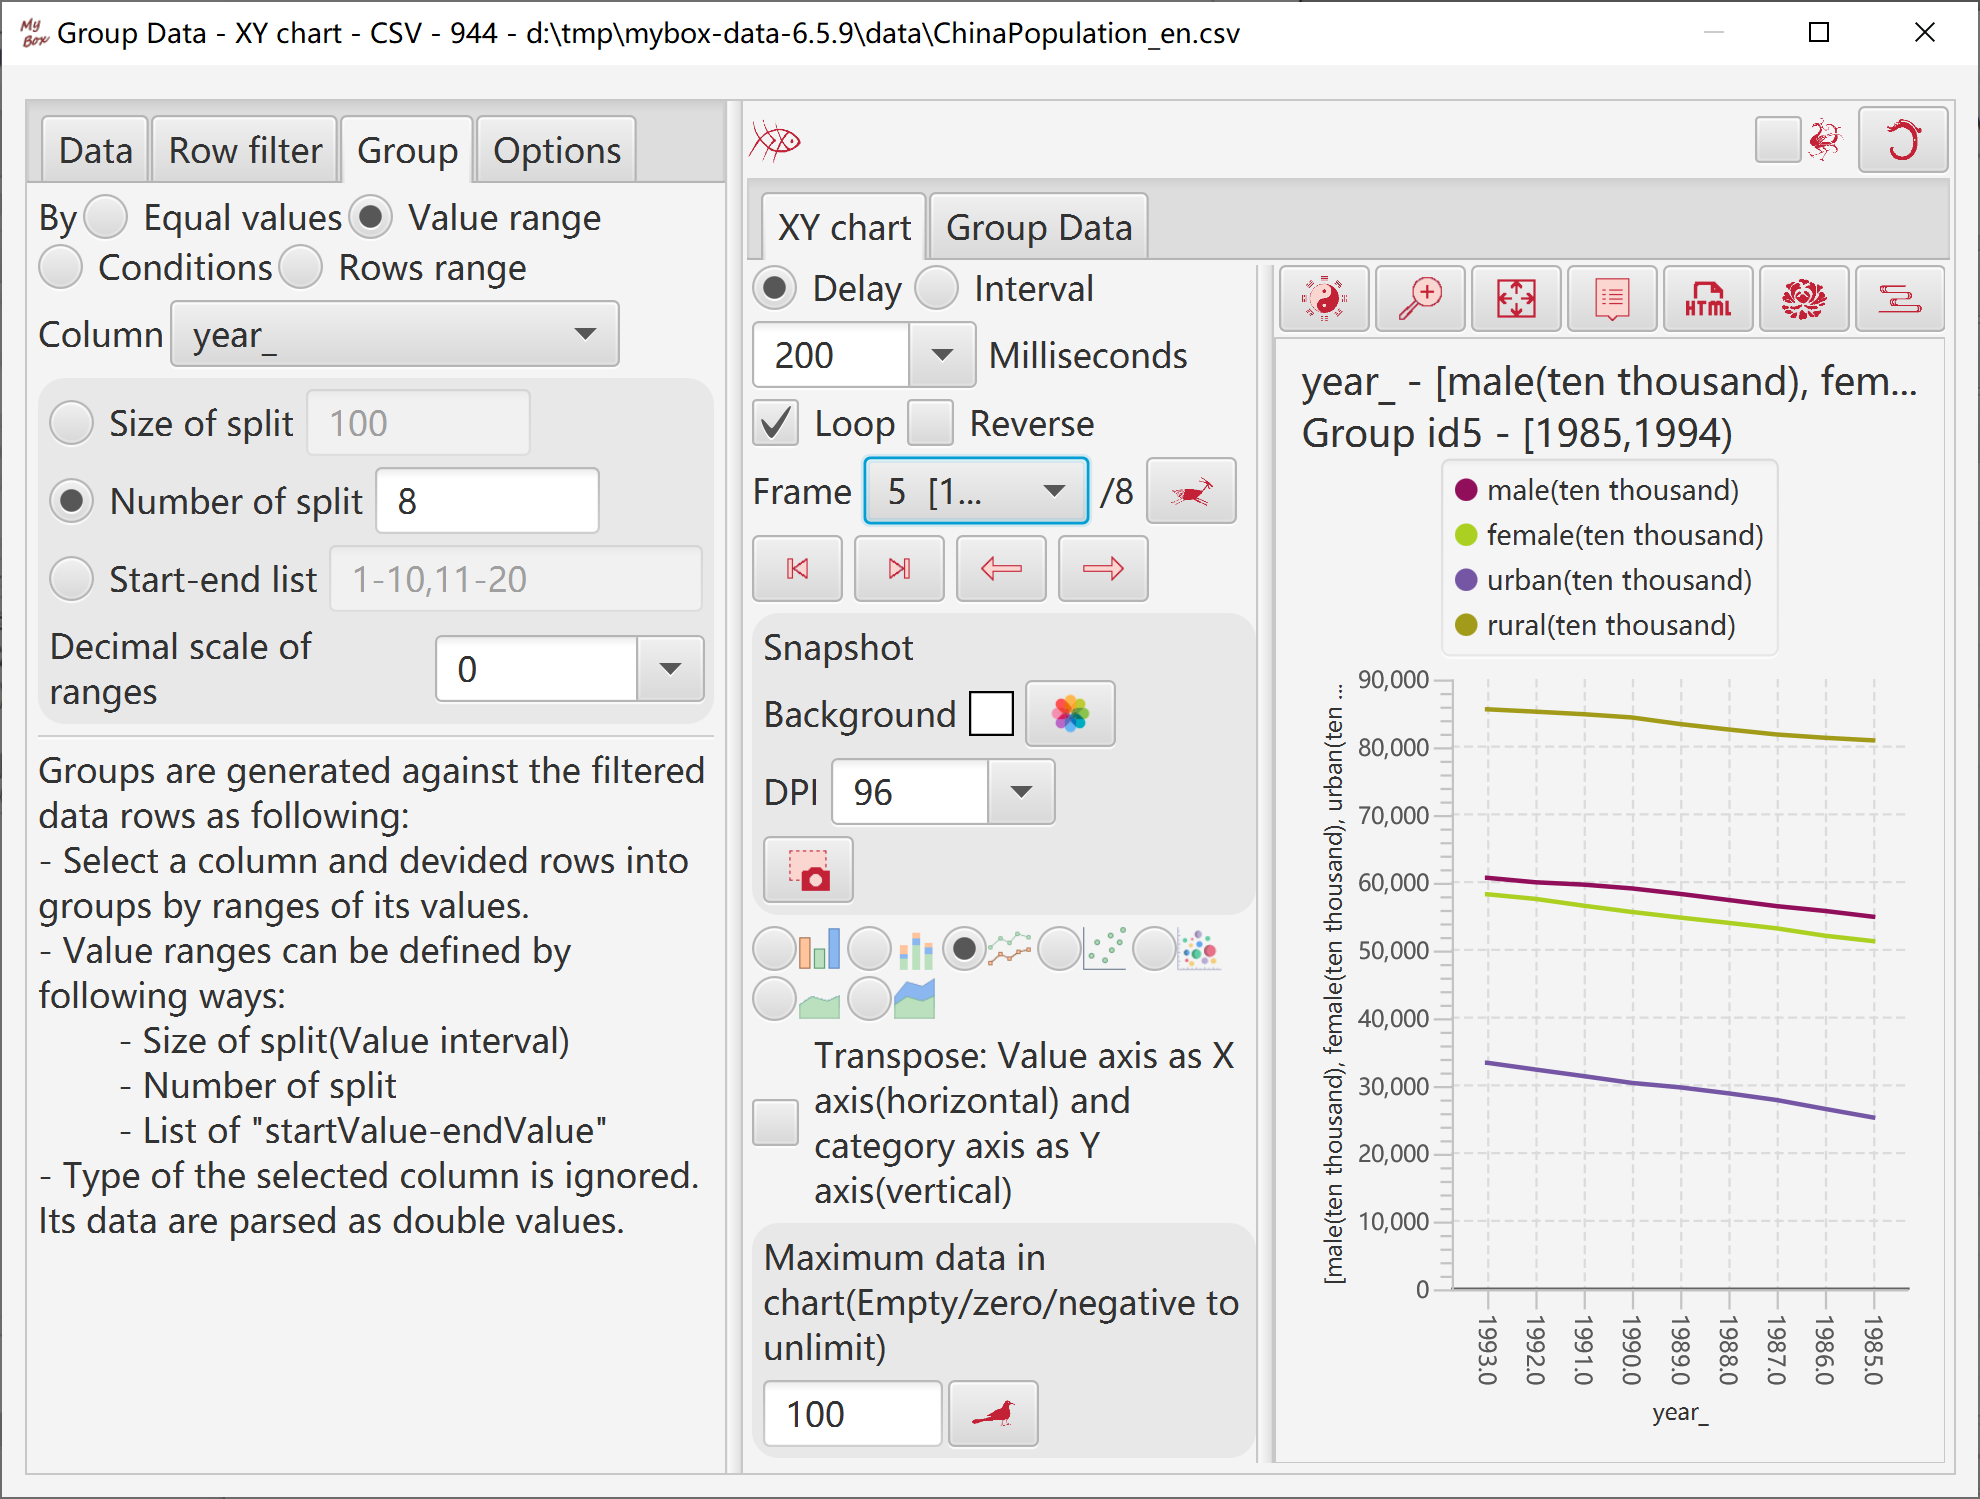
2.10.5 Group by Value Ranges 40
2.10.5.1 Way of Grouping 40
2.10.5.2 Split Date/Era 41
2.10.5.3 Edit List of “Start-End” 42
2.10.5.4 Implementation of Grouping 43
2.10.5.5 Results of Grouping 43
2.10.6 Group by Time 44
2.10.6.1 Way of Grouping 44
2.10.6.2 Implementation of Grouping 44
2.10.6.3 Results of Grouping 45
2.10.7 Group by Expression 46
2.10.7.1 Way of Grouping 46
2.10.7.2 Implementation of Grouping 46
2.10.7.3 Results of Grouping 47
2.10.8 Group by Conditions 48
2.10.8.1 Way of Grouping 48
2.10.8.2 Implementation of Grouping 48
2.10.8.3 Results of Grouping 49
2.10.9 Group by Row Number 50
2.10.9.1 Way of Grouping 50
2.10.9.2 Implementation of Grouping 50
2.10.9.3 Results of Grouping 51
2.11 Modify Data 52
2.11.1 Add Rows 53
2.11.2 Set Values 54
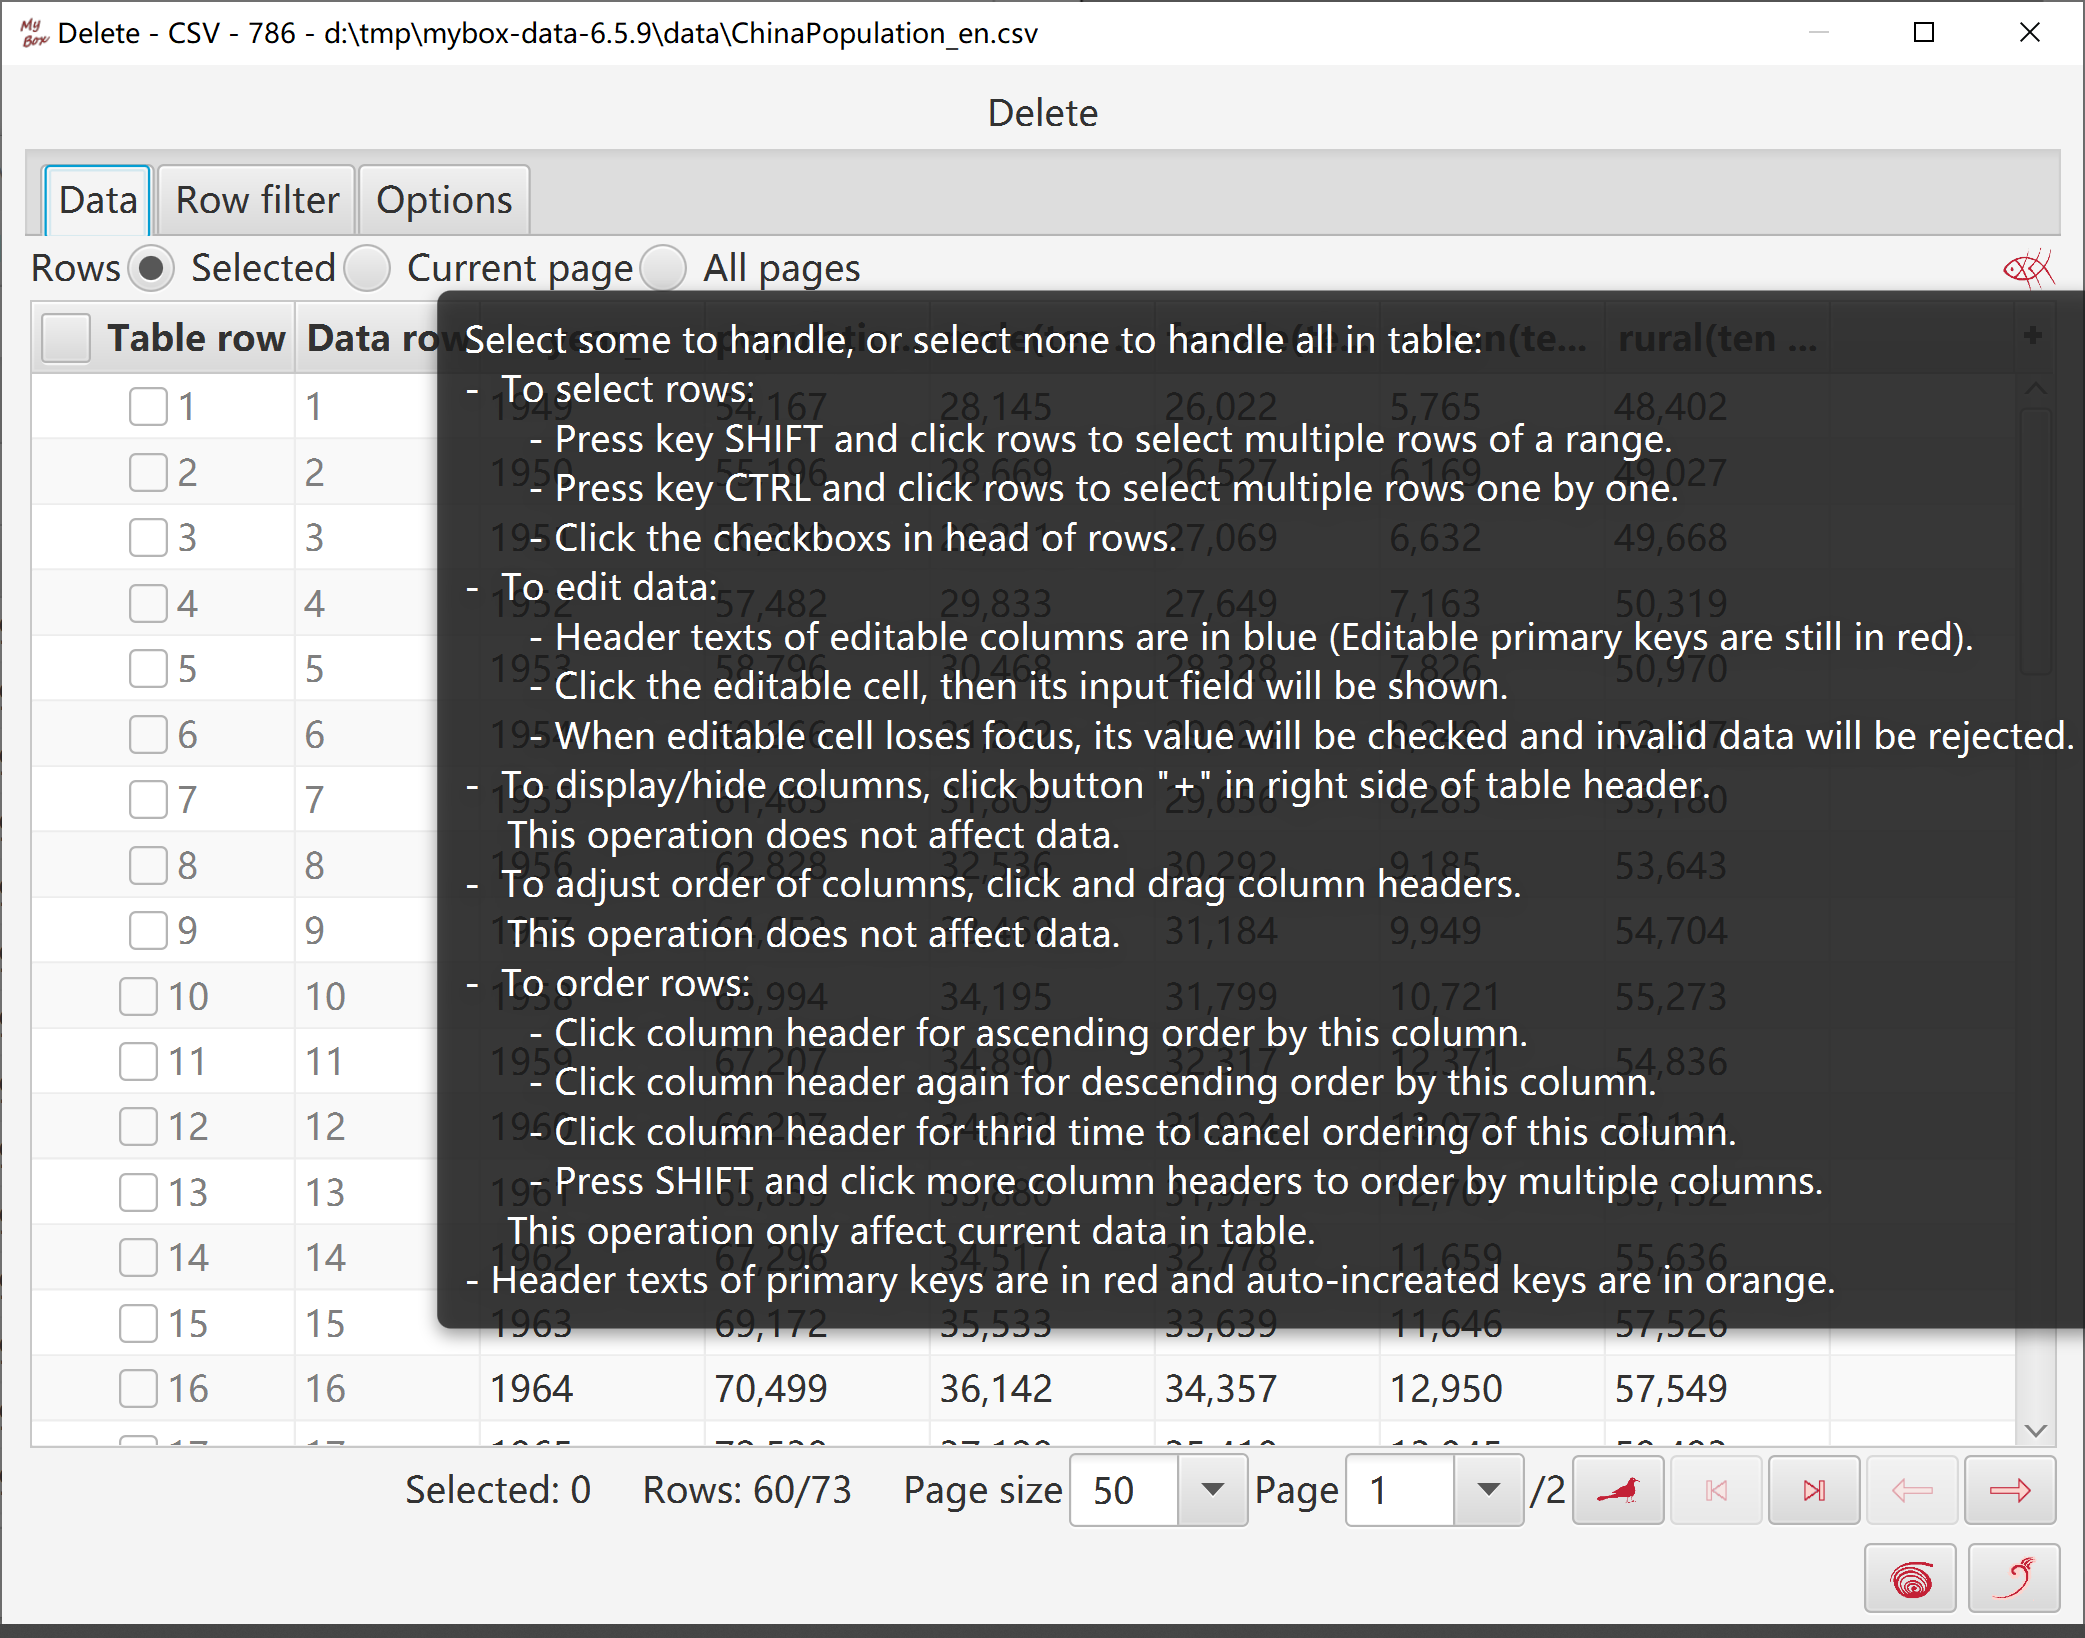
2.11.3 Delete 55
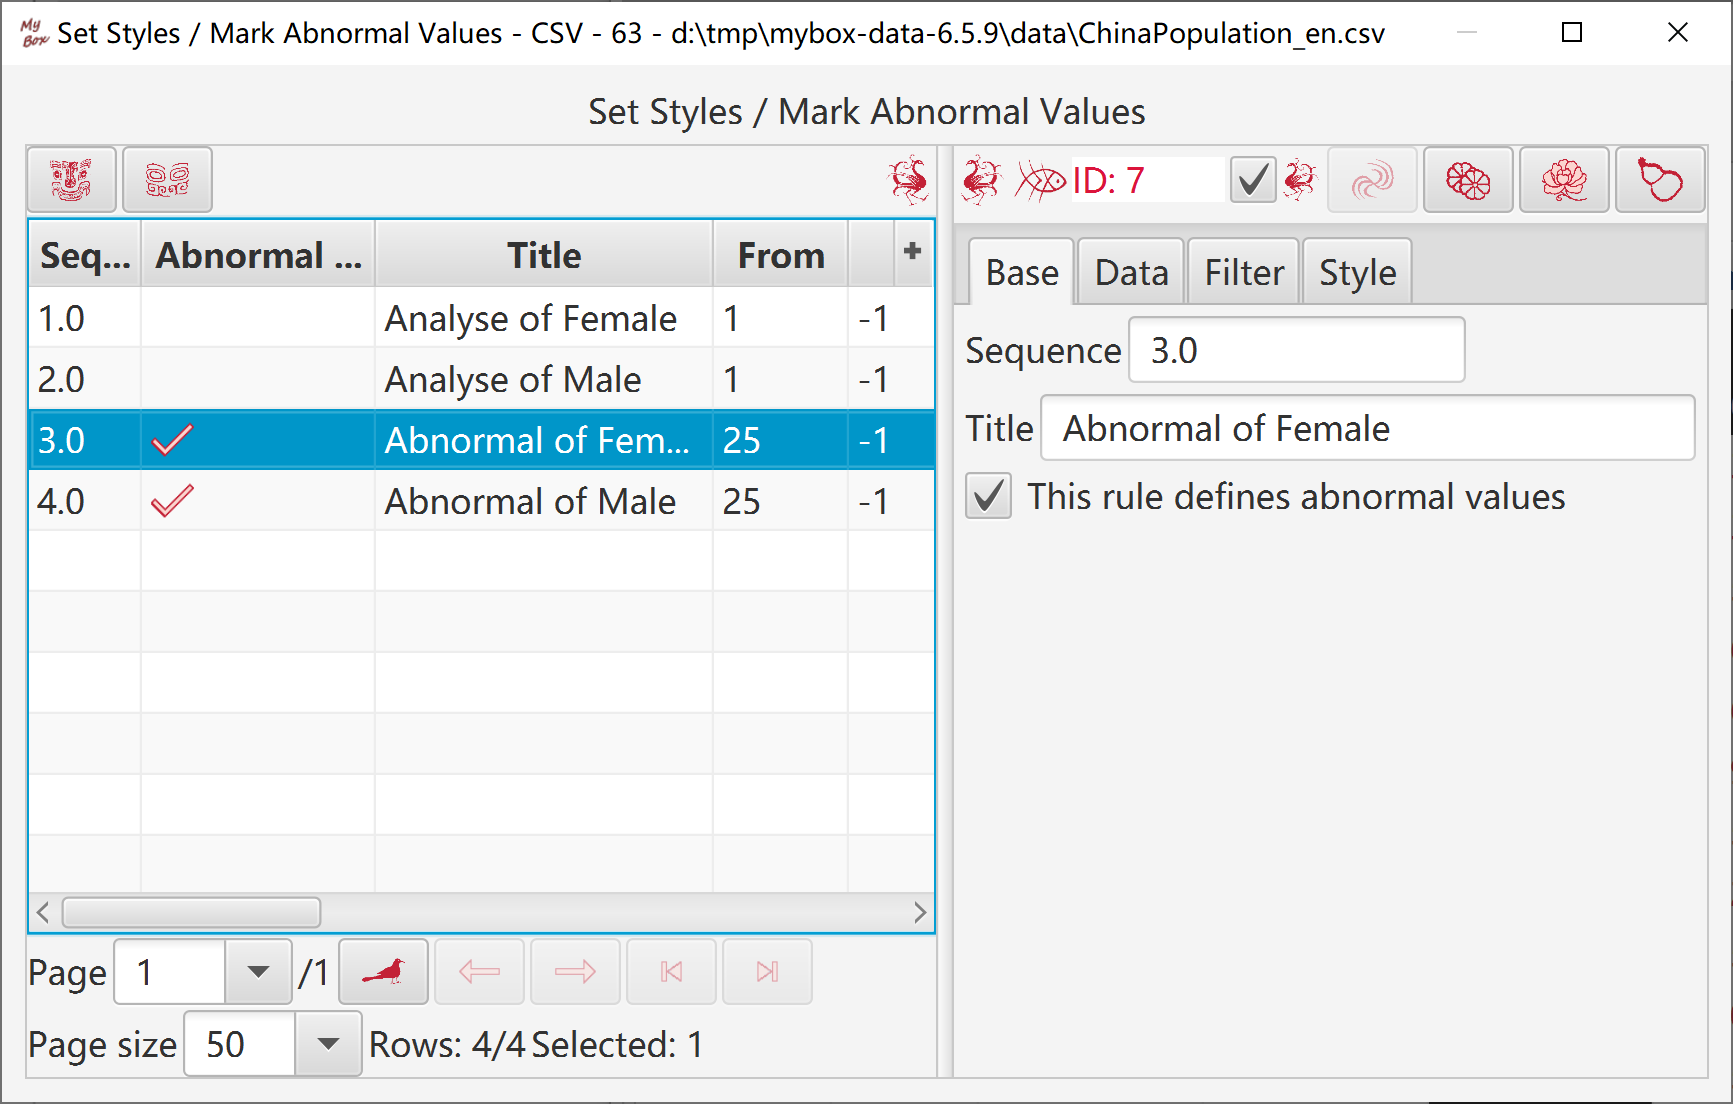
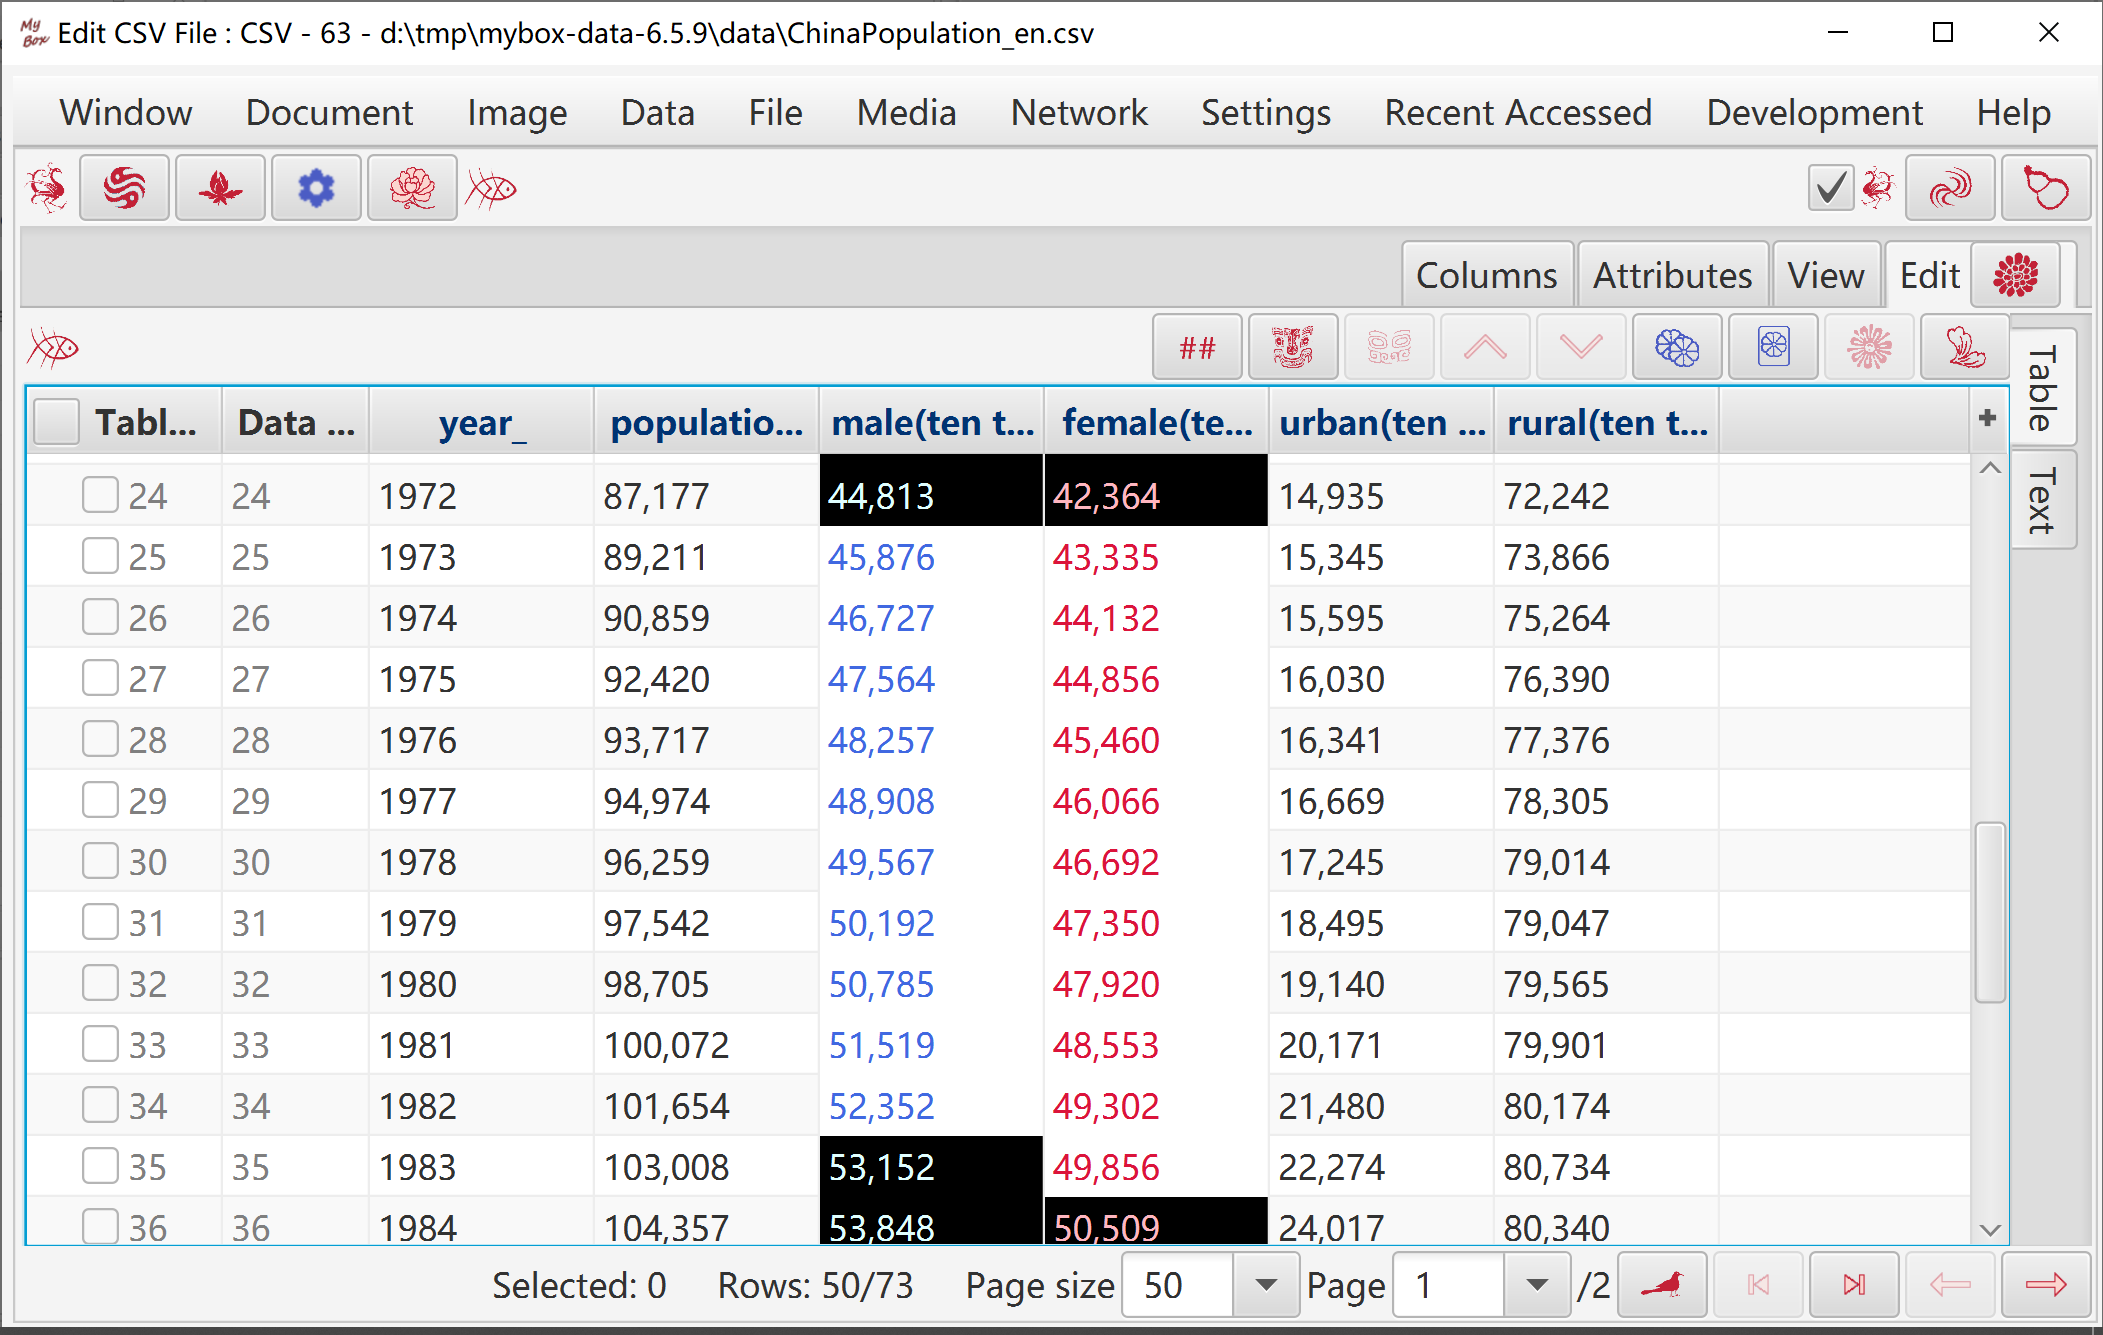
2.11.4 Set styles / Mark Abnormal Values 56
2.11.4.1 Manage Styles 56
2.11.4.2 Data Scope 57
2.11.4.3 Define Styles 58
2.11.4.4 Apply Styles 59
2.11.5 Paste Content in System Clipboard 60
2.11.6 Paste Content in MyBox Clipboard 61
2.12 Trim Data 62
2.12.1 Copy/Filter/Query/Convert 63
2.12.2 Sort 64
2.12.3 Transpose 65
2.12.4 Normalization 66
2.12.5 Split/Group 67
2.13 Data Calculation 68
2.13.1 Row Expression 69
2.13.2 Descriptive Statistic 70
2.13.3 Statistic in Groups 71
2.13.3.1 Options of Calculation 71
2.13.3.2 Grouped Data 72
2.13.3.3 Statistic Data 72
2.13.3.4 Data in Chart 73
2.13.3.5 XY Chart 74
2.13.3.6 Pie Chart 75
2.13.4 Simple Linear Regression 76
2.13.4.1 Base of Implementation 76
2.13.4.2 Options of Calculation 76
2.13.4.3 Regression 76
2.13.4.4 Model 77
2.13.4.5 Fitted Chart 78
2.13.4.6 Residual Chart 79
2.13.5 Simple Linear Regression - Combination 80
2.13.6 Multiple Linear Regression 81
2.13.6.1 Regression 81
2.13.6.2 Model 82
2.13.7 Multiple Linear Regression - Combination 83
2.13.8 Frequency Distributions 84
2.13.9 Values Percentage 85
2.14 Data Charts 86
2.14.1 XY Chart 87
2.14.1.1 Data 87
2.14.1.2 Bar Chart 88
2.14.1.3 Stacked Bar Chart 89
2.14.1.4 Line Chart 89
2.14.1.5 Scatter Chart 90
2.14.1.6 Bubble Chart 90
2.14.1.7 Area Chart 91
2.14.1.8 Stacked Area Chart 92
2.14.1.9 Parameters of Data in Chart 92
2.14.1.10 Layout 93
2.14.1.11 Category Axis 94
2.14.1.12 Number Axis 95
2.14.2 Pie Chart 96
2.14.3 Box-and-whisker Chart 97
2.14.3.1 Way of Calculation 97
2.14.3.2 Options of Calculation 98
2.14.3.3 Statistic Data 99
2.14.3.4 Options of Chart 99
2.14.4 Self Comparison Bars Chart 100
2.14.4.1 Way of Calculation 100
2.14.4.2 Options of Calculation 101
2.14.4.3 Options of Chart 101
2.14.5 Comparison Bars Chart 103
2.14.5.1 Way of Calculation 103
2.14.5.2 Options of Calculation 103
2.14.5.3 Options of Chart 103
2.14.6 XYZ Chart 105
2.14.6.1 3-D Scatter 106
2.14.6.2 Surface Chart 107
2.14.7 Locations Distribution 109
2.14.7.1 Options of Data 109
2.14.7.2 Data in Map 109
2.14.7.3 Options of Map 110
2.14.7.4 Options of Playing 111
2.15 Group Charts 112
2.15.1 General Manufacture 113
2.15.1.1 Group Data 113
2.15.1.2 Results of Grouping 114
2.15.1.3 Display Options of Chart 115
2.15.1.4 Options of Playing 115
2.15.2 Group Data – XY Chart 116
2.15.2.1 Specific Options to Generate Chart 116
2.15.2.2 Specific Options to Display Chart 116
2.15.3 Group Data – Pie Chart 117
2.15.3.1 Specific Options to Generate Chart 117
2.15.4 Group Data – Box-and-whisker Chart 118
2.15.4.1 Specific Options to Generate Chart 118
2.15.4.2 Specific Options to Display Chart 118
2.15.5 Group Data – Self Comparison Bars Chart 119
2.15.5.1 Specific Options to Generate Chart 119
2.15.5.2 Specific Options to Display Chart 119
2.15.6 Group Data – Comparison Bars Chart 120
2.15.6.1 Specific Options to Generate Chart 120
2.15.6.2 Specific Options to Display Chart 120
2.16 Input Data 121
2.16.1 Load Contents in System Clipboard 121
2.16.2 Import Examples 122
2.16.2.1 Personal Data 122
2.16.2.2 Statistic Data of China 123
2.16.2.3 Data of Regression 124
2.16.3 Location Data 125
2.17 Output Data 126
2.17.1 Export 127
2.17.1.1 Data Source 127
2.17.1.2 Formats of Targets 128
2.17.1.3 Target Files 128
2.17.2 Convert to Database Table 129
2.18 Manage Data 130
2.19 Splice Data 131
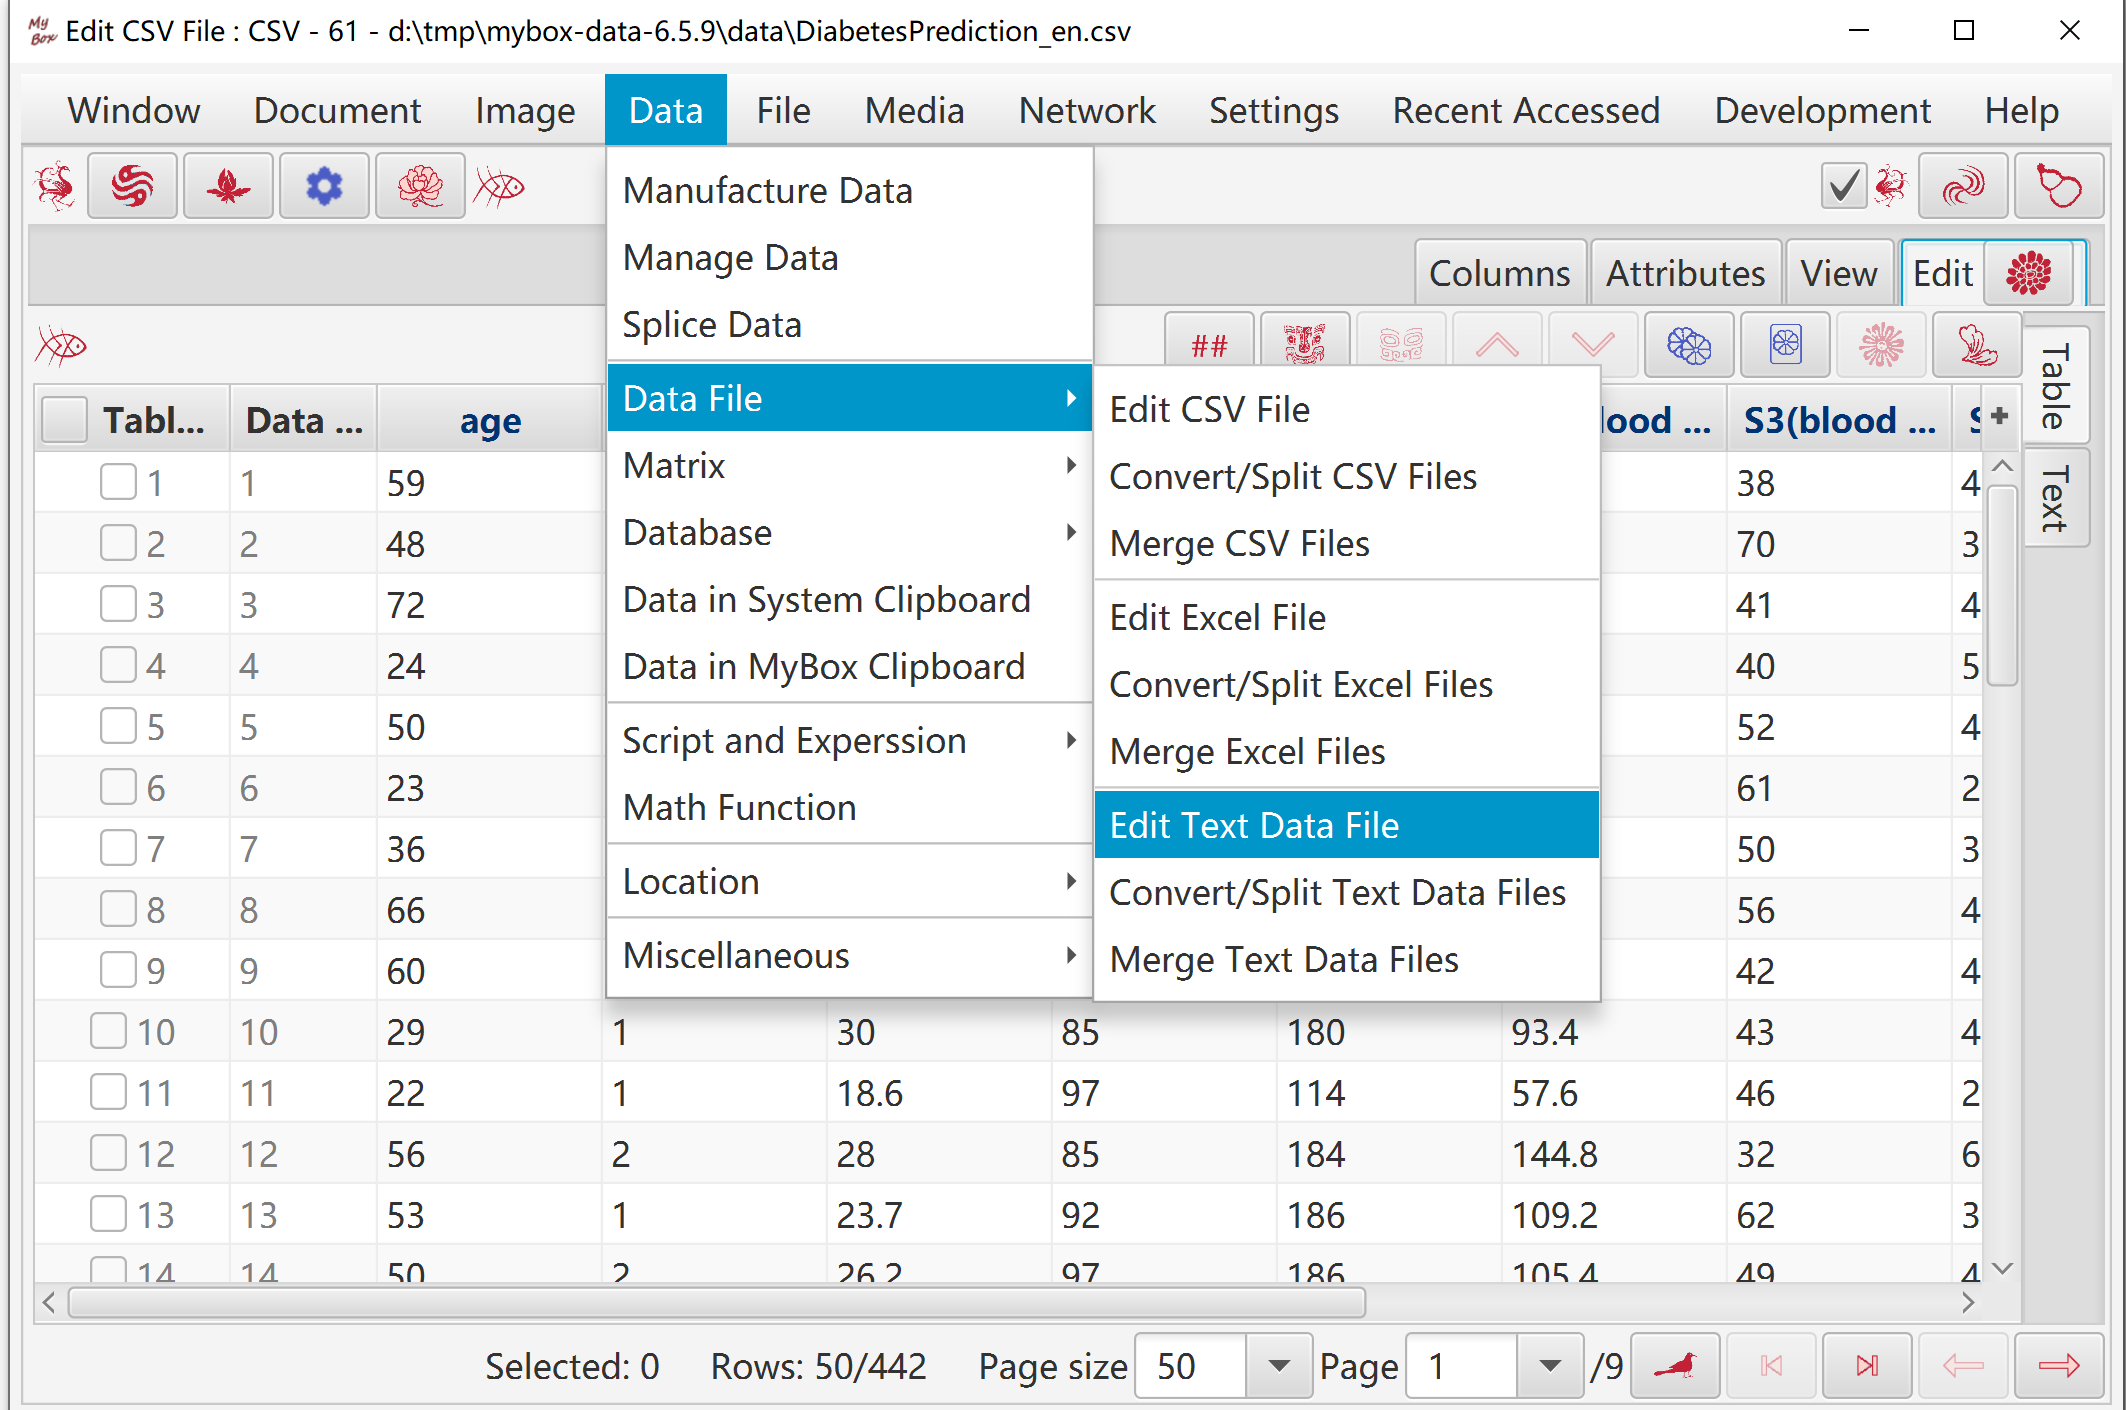
2.20 Data File 132
2.20.1 CSV File 132
2.20.2 Text File 133
2.20.3 Excel File 134
2.20.4 Convert/Split Data Files in Batch 135
2.20.5 Merge Data Files 136
2.21 Data in System Clipboard 137
2.22 Data in MyBox Clipboard 138
2.23 Matrix 139
2.23.1 Edit and Manage Matrices 139
2.23.2 Unary Matrix Calculation 140
2.23.3 Binary Matrices Calculation 141
2.24 Database Tables 142
2.24.1 Manage Database Tables 142
2.24.2 Limitations of SQL Identifier 143
2.24.3 Database SQL 144
2.24.4 SQL Query 145
3 Script and Expression 146
3.1 JShell(Java interactive coding tool) 146
3.1.1 About JShell 146
3.1.2 Run Jshell in GUI 146
3.2 JEXL(Java Expression Language) 148
3.2.1 About JEXL 148
3.2.2 Run JEXL in GUI 148
3.3 Javascript 150
4 Math Function 151
4.1 Define Math Functions 151
4.2 Calculate Math Function 151
4.3 Data Set 155
4.4 XY Chart of Unary Function 156
4.5 XYZ Chart of Binary Function 157
5 Data of Location 158
5.1 Data Constraints 158
5.1.1 Invalid Value 158
5.1.2 Coordinate System: 158
5.1.3 Coordinate Values 158
5.1.4 Time 158
5.1.4.1 Date Formats 158
5.1.4.2 Era 158
5.1.4.3 Examples 159
5.2 Data Operations 159
5.3 Map Data 160
5.4 Geography Code 162
5.4.1 Data Definition 162
5.4.2 Data Constraints 162
5.4.3 Edit Data 162
5.4.4 Define Condition 162
5.4.5 Import Data 162
5.4.5.1 Predefined Data 162
5.4.5.2 CSV Format 163
5.4.5.3 Data from geoname.org: 163
5.4.6 Settings 163
5.5 Location in Map 165
5.6 Location Tools 167
6 Others 168
6.1 Create Barcodes 168
6.2 Decode Barcodes 169
6.3 Message Digest 169
6.4 Encode/Decode Base64 169
6.5 Extract ttf files from ttc file 169
This is desktop application based on JavaFx to provide simple and easy functions. It's free and open sources.
|
Contents |
Link |
|---|---|
|
Project Main Page |
|
|
Source Codes and Compiled Packages |
|
|
Submit Software Requirements and Problem Reports |
|
|
Data |
|
|
Documents |
|
|
Mirror Site |
|
|
Cloud Storage |
https://pan.baidu.com/s/1fWMRzym_jh075OCX0D8y8A#list/path=%2F |
|
Name |
Version |
Time |
English |
Chinese |
|---|---|---|---|---|
|
Development Logs |
6.7.1 |
2023-3-13 |
||
|
Shortcuts |
6.7.1 |
2023-3-13 |
||
|
Functions list |
6.7.1 |
2023-3-13 |
||
|
Packing Steps |
6.7.1 |
2023-3-13 |
||
|
Development Guide |
2.1 |
2020-8-27 |
||
|
User Guide - Overview |
6.7.1 |
2023-3-13 |
||
|
User Guide - Data Tools |
6.7.1 |
2023-3-13 |
||
|
User Guide - Document Tools |
6.7.1 |
2023-3-13 |
||
|
User Guide - Image Tools |
6.7.1 |
2023-3-13 |
||
|
User Guide - File Tools |
6.7.1 |
2023-3-13 |
||
|
User Guide - Network Tools |
6.7.1 |
2023-3-13 |
||
|
User Guide - Media Tools |
6.7.1 |
2023-3-13 |
||
|
User Guide - Development Tools |
6.7.1 |
2023-3-13 |
||
|
Examples - Information in Tree |
6.6.1 |
2022-11-16 |
||
|
Examples - Favorite Address |
6.6.1 |
2022-11-16 |
||
|
Examples - Notes |
6.7.1 |
2023-3-13 |
||
|
Examples - SQL |
6.6.1 |
2022-11-16 |
||
|
Examples - JShell |
6.6.1 |
2022-11-16 |
||
|
Examples - JEXL |
6.6.1 |
2022-11-16 |
||
|
Examples - JavaScript |
6.6.1 |
2022-11-16 |
||
|
Examples - Math Function |
6.6.1 |
2022-11-16 |
||
|
Examples - Row Filter |
6.6.1 |
2022-11-16 |
||
|
About - data grouping |
6.7.1 |
2023-3-13 |
||
|
About - Color |
6.6.1 |
2022-11-16 |
||
|
About - Coordinate System |
6.6.1 |
2022-11-16 |
||
|
About - Media |
6.6.1 |
2022-11-16 |
||
|
About - Data Analysis |
6.6.1 |
2022-11-16 |
||
|
About - Items in one sentence about java |
6.7.1 |
2023-3-13 |
||
|
About - Items in one sentence about javafx |
6.7.1 |
2023-3-13 |
||
|
Palette - Art hues wheel(RYB) - 24 colors |
6.7.1 |
2023-3-13 |
||
|
Palette - Common Web Colors |
6.7.1 |
2023-3-13 |
||
|
Palette - Chinese Traditional Colors |
6.7.1 |
2023-3-13 |
||
|
Palette - Japanese Traditional Colors |
6.7.1 |
2023-3-13 |
||
|
Palette - Colors from colorhexa.com |
6.7.1 |
2023-3-13 |
||
|
Palette - Art hues wheel(RYB) - 12 colors |
6.7.1 |
2023-3-13 |
||
|
Palette - Art hues wheel(RYB) - 360 colors |
6.7.1 |
2023-3-13 |
||
|
Palette - Optical hues wheel(RGB) - 12 colors |
6.7.1 |
2023-3-13 |
||
|
Palette - Optical hues wheel(RGB) - 24 colors |
6.7.1 |
2023-3-13 |
||
|
Palette - Optical hues wheel(RGB) - 260 colors |
6.7.1 |
2023-3-13 |
||
|
Palette - Art paints |
6.7.1 |
2023-3-13 |
||
|
Palette - MyBox Colors |
6.7.1 |
2023-3-13 |
||
|
Palette - Gray scale |
6.7.1 |
2023-3-13 |
||
|
Stories of Images |
6.7.1 |
2023-3-13 |
Following objects can be edited in consistent way:
Data files, including CSV File, Excel file, texts file.
Data of MyBox Clipboard
Matrices
Database tables.
Data are represented as two-dimensional storage structure:
"Columns" define dimensions of data in horizontal direction.
"Rows" save values of data in vertical direction..
Data should be in same width. That is all rows have equal number of columns.
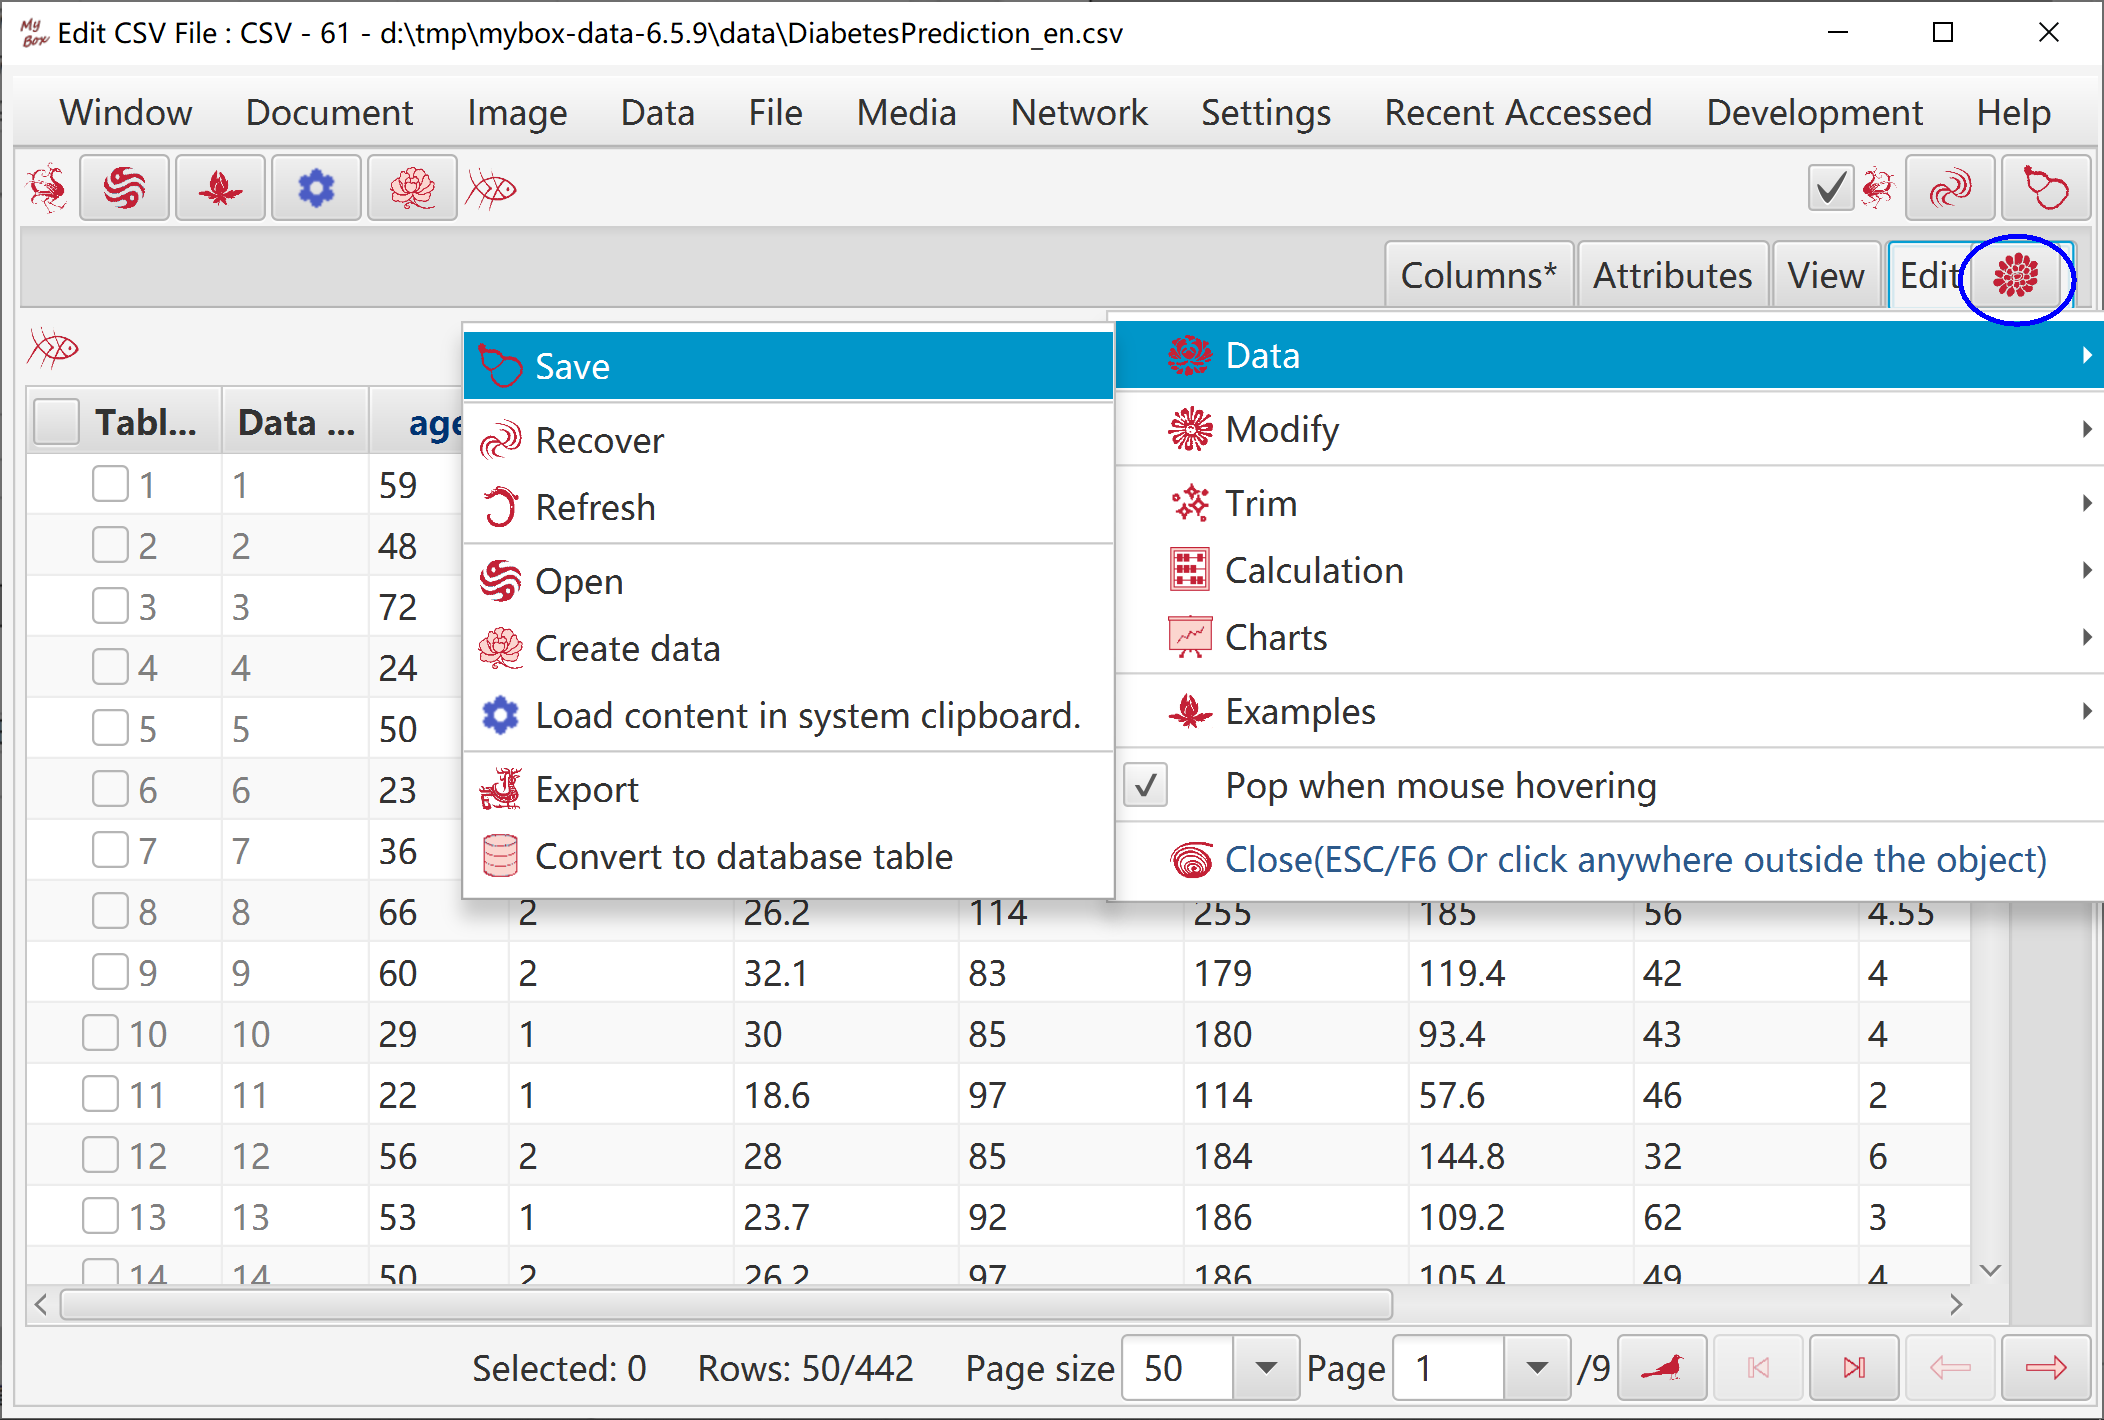
Hover or click button “Functions” to pop Functions Menu.
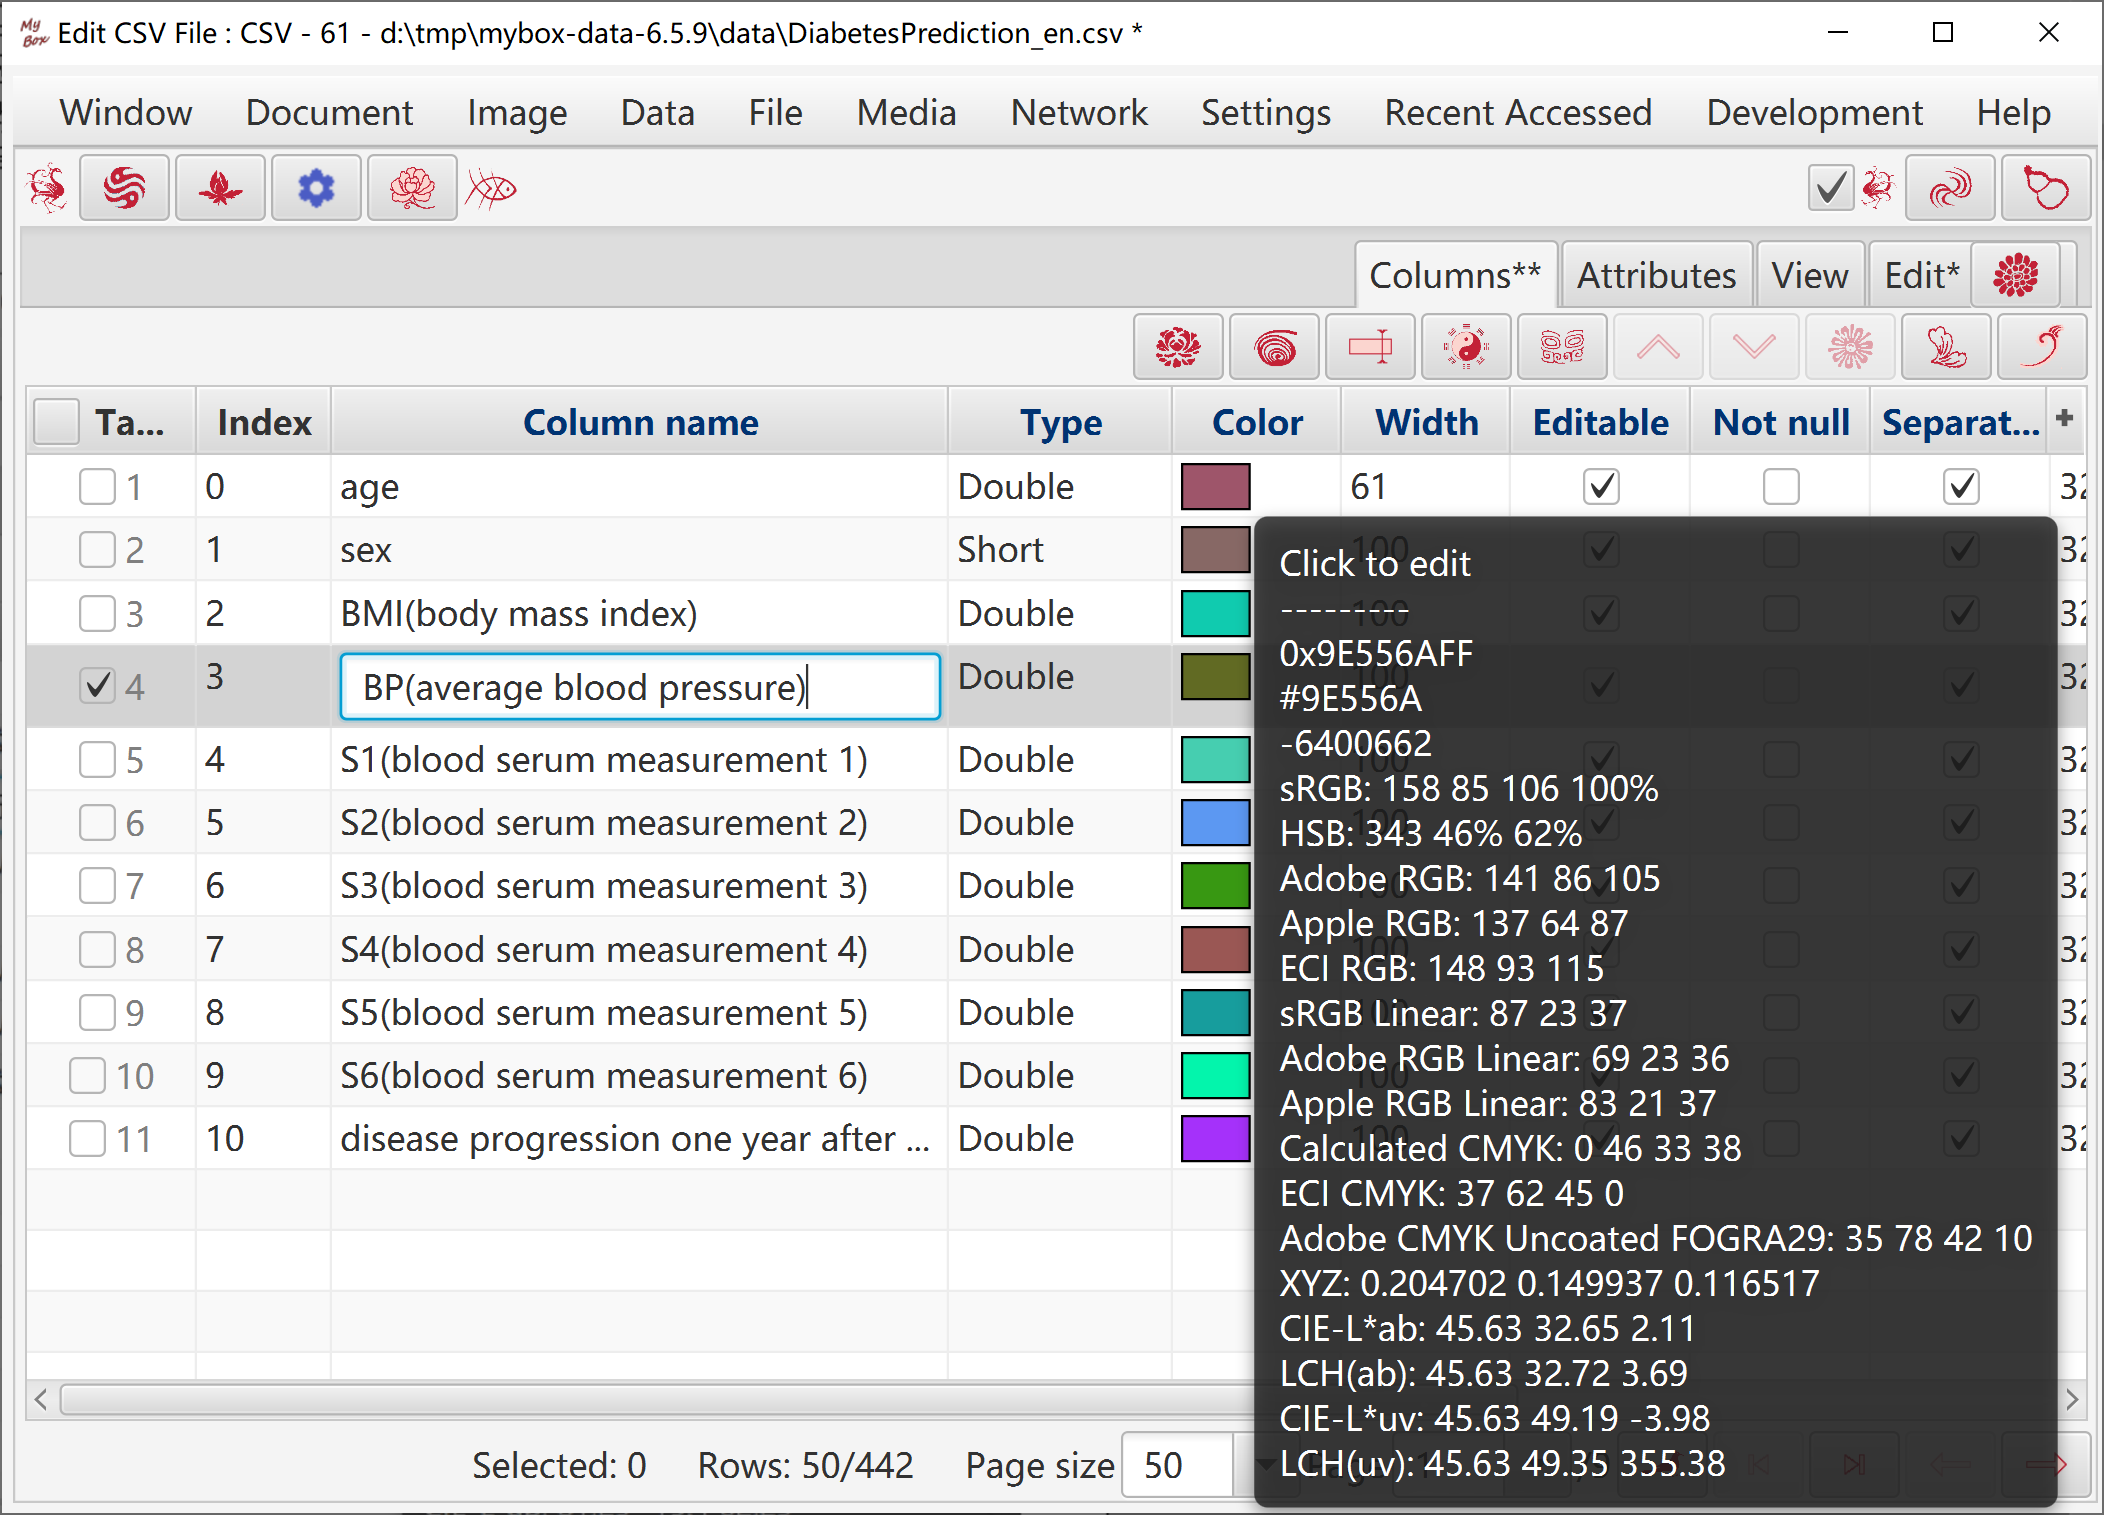
Under tab “Columns”, add/delete/change columns in table view:
Column names should not be null nor duplicated.
Click table cell to edit value directly.
Select one row and click button “Edit” to open edit window.
Can rename all columns with sequence numbers.
Can set random colors.
Can adjust orders of columns.
Click button "OK" to apply modifications of columns to "Table" of current data.
Click button "Cancel" to discard modifications of columns and pick data from "Table" of current data.
When changes have not been saved, if modifications have not been applied to data, “**” is displayed in tab header, or else “*” is displayed in tab header.
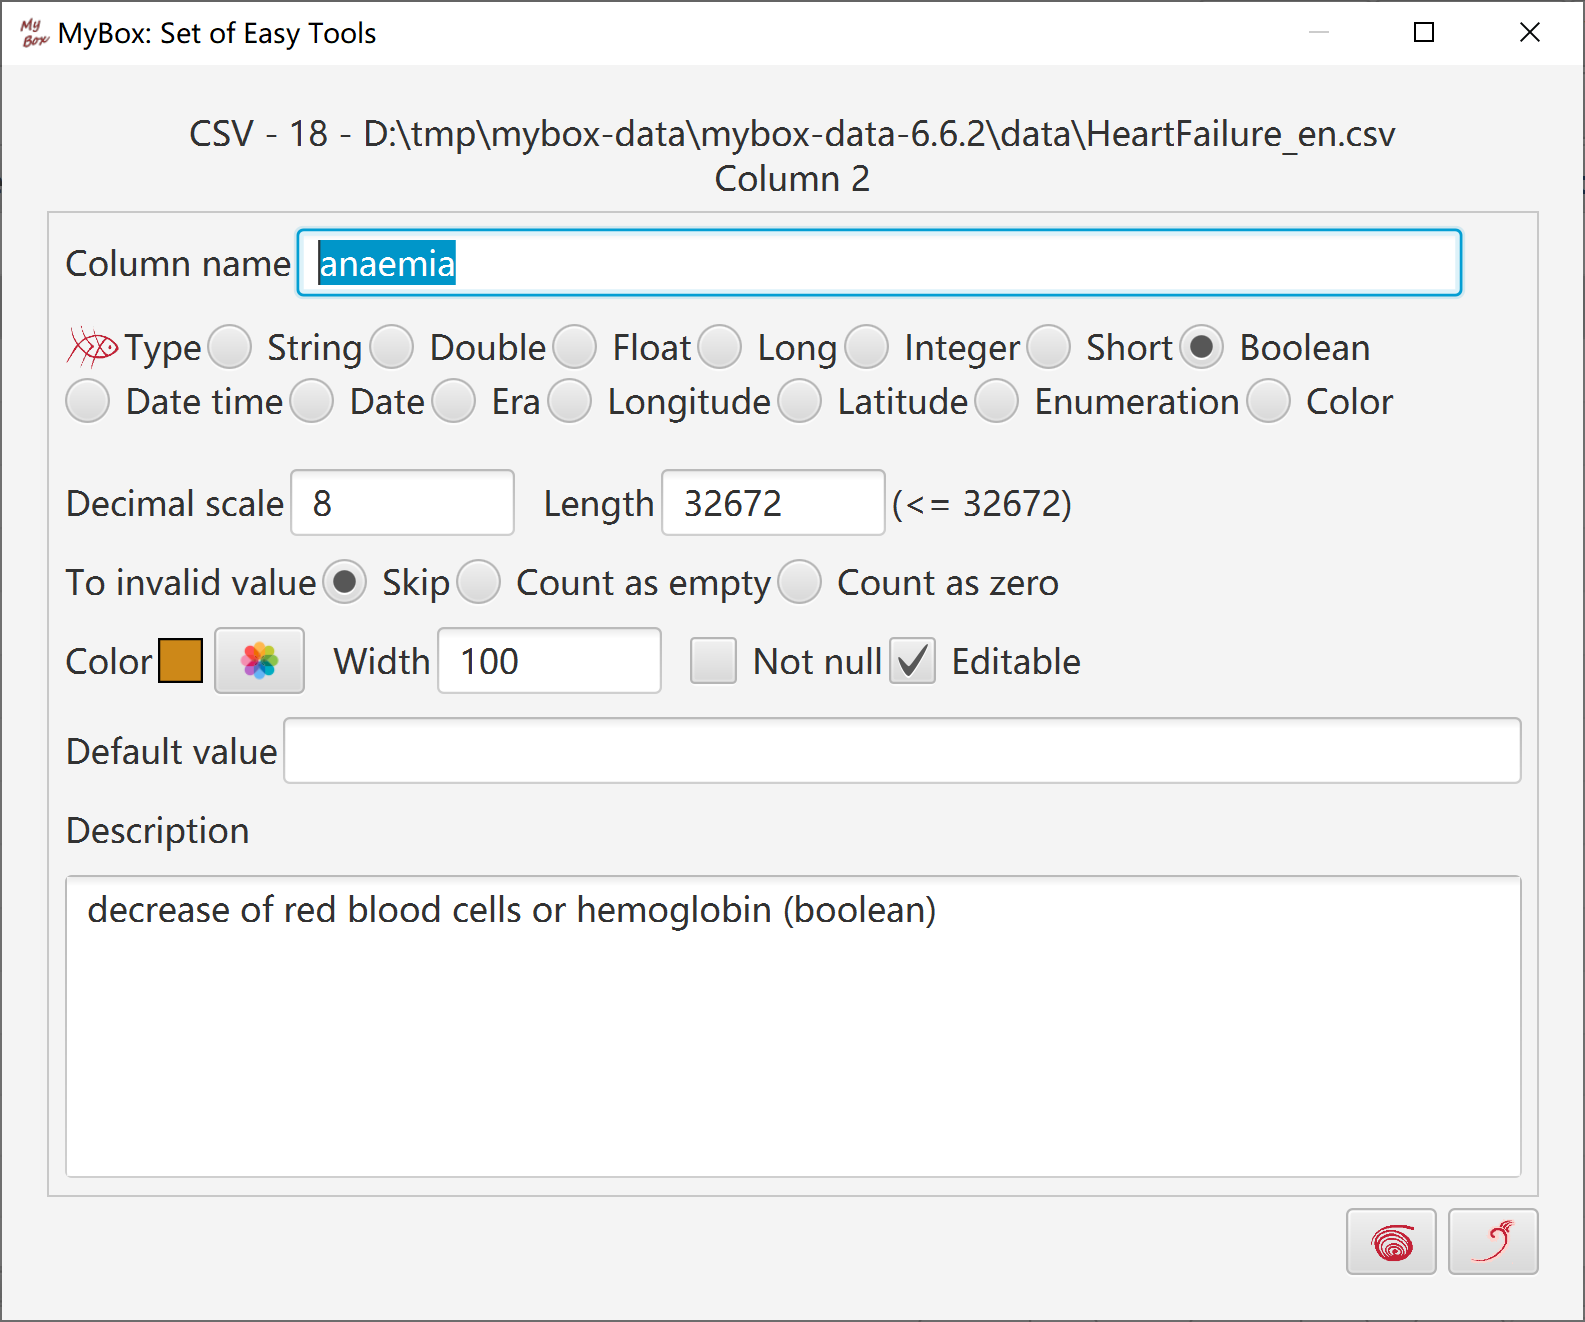
Types of columns include: String, Double, Float, Long, Integer, Short, Boolean, Datetime, Date, Era, Longitude, Latitude, Enumeration, Color.
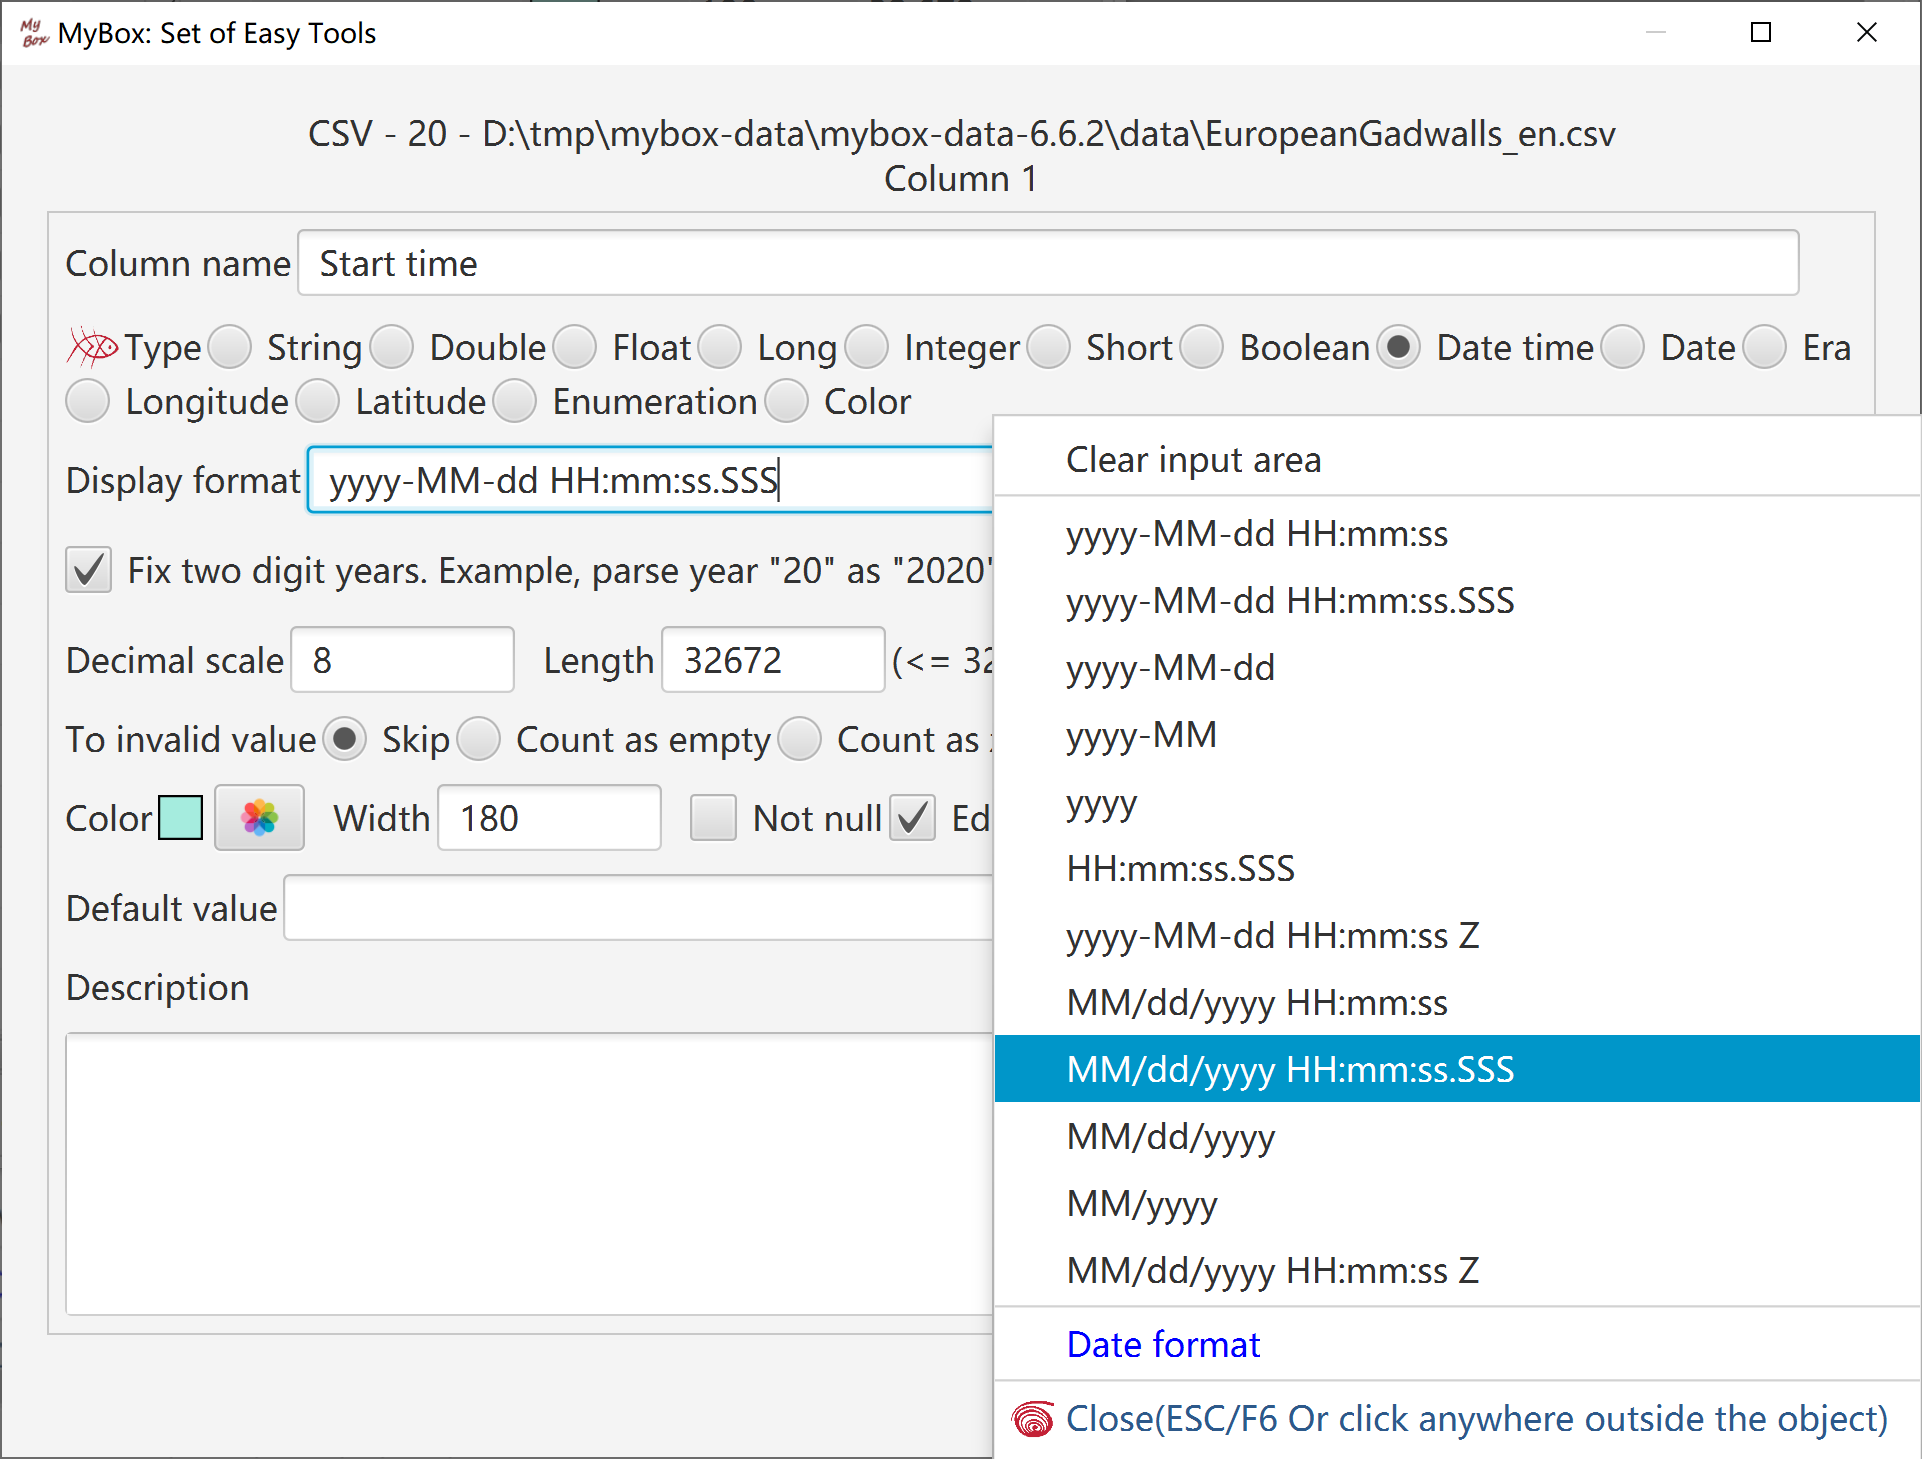
This attribute is used to display, edit, calculate, and save data.
Longitutde and Latitude are defined together generally.
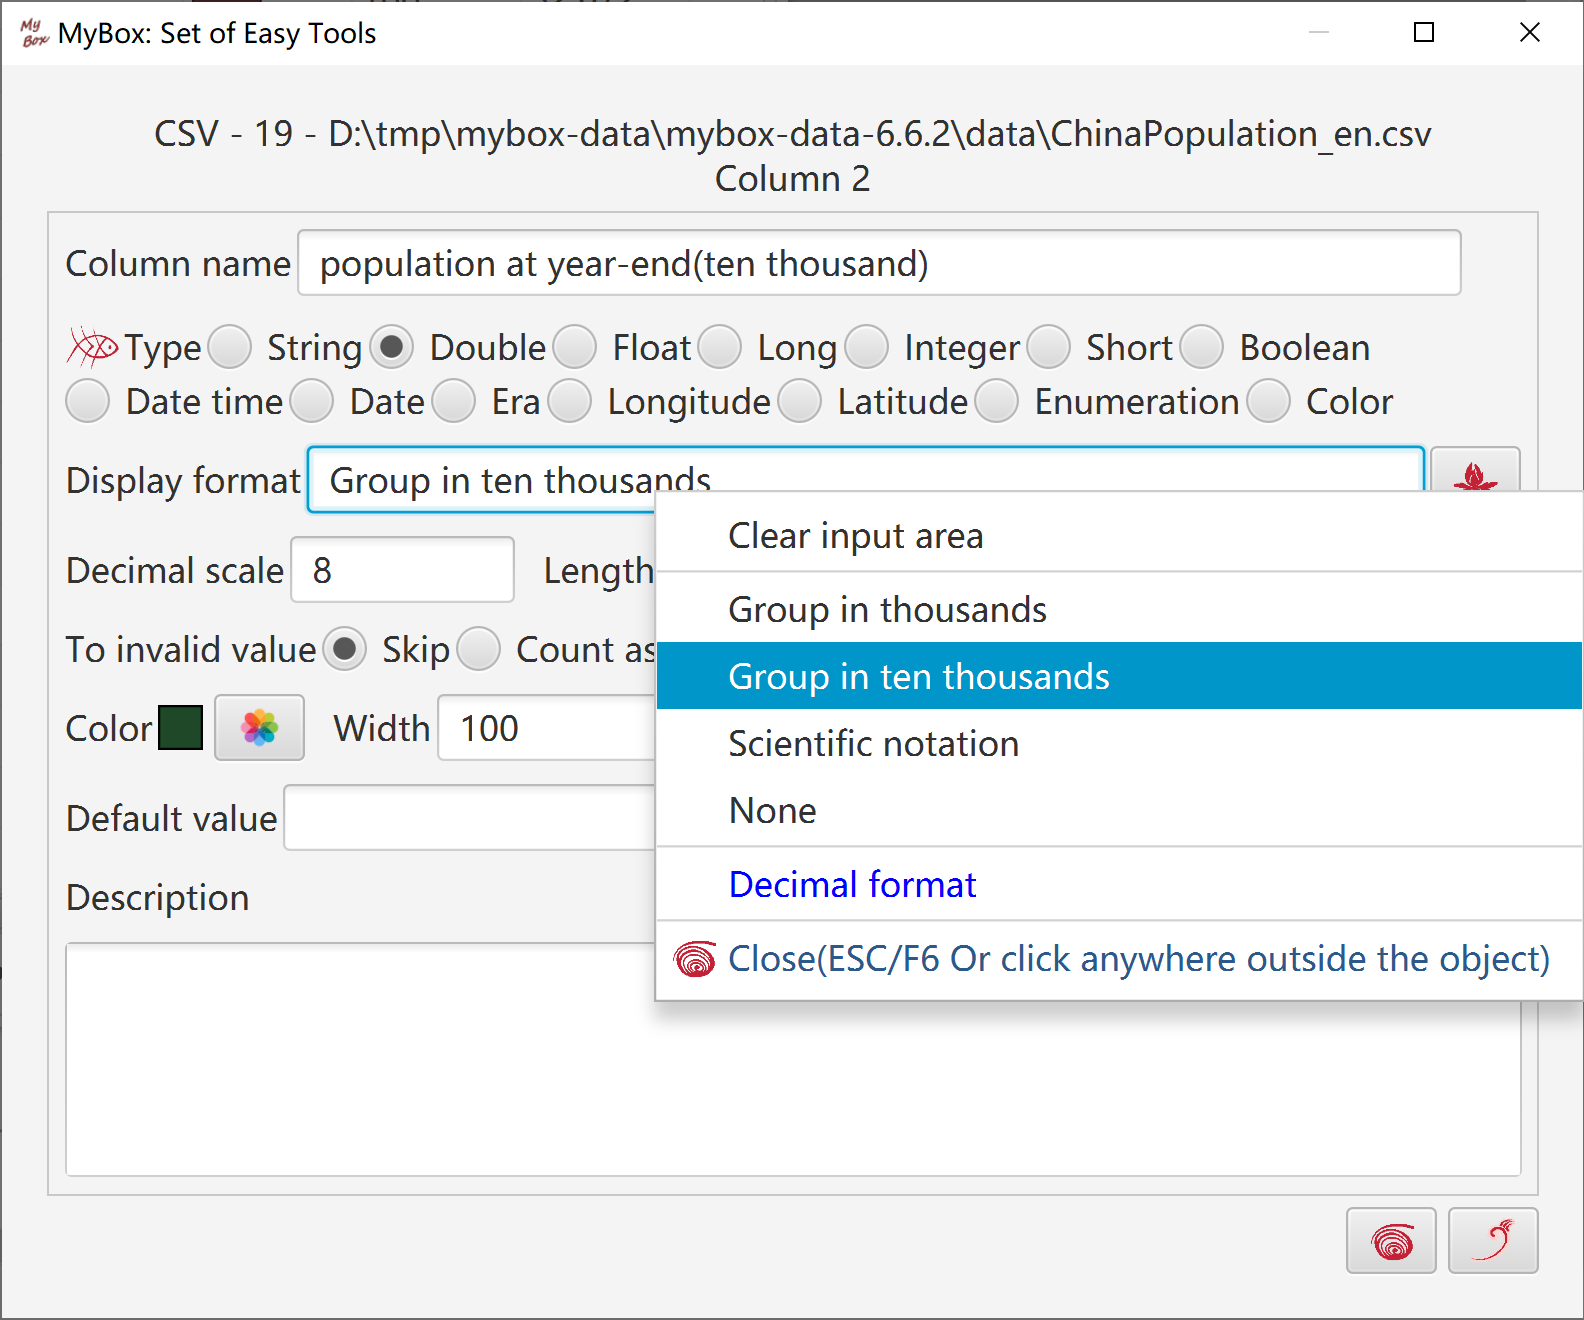
This attribute is mainly for display. When data are inputted/edited, formats are not applied automatically and original inputs are kept.
In some interfaces, like "Copy" or "Export", options "Save date/time/era and numbers as columns' formats" can be checked.
To numbers, format can be: group in thousands, group in ten thousands, scientific notation, and no format.
To Datetime/Date, following are supported in formats: MM/dd/yy, yy-MM-dd, milliseconds, time zone, T separator, patch century, etc..
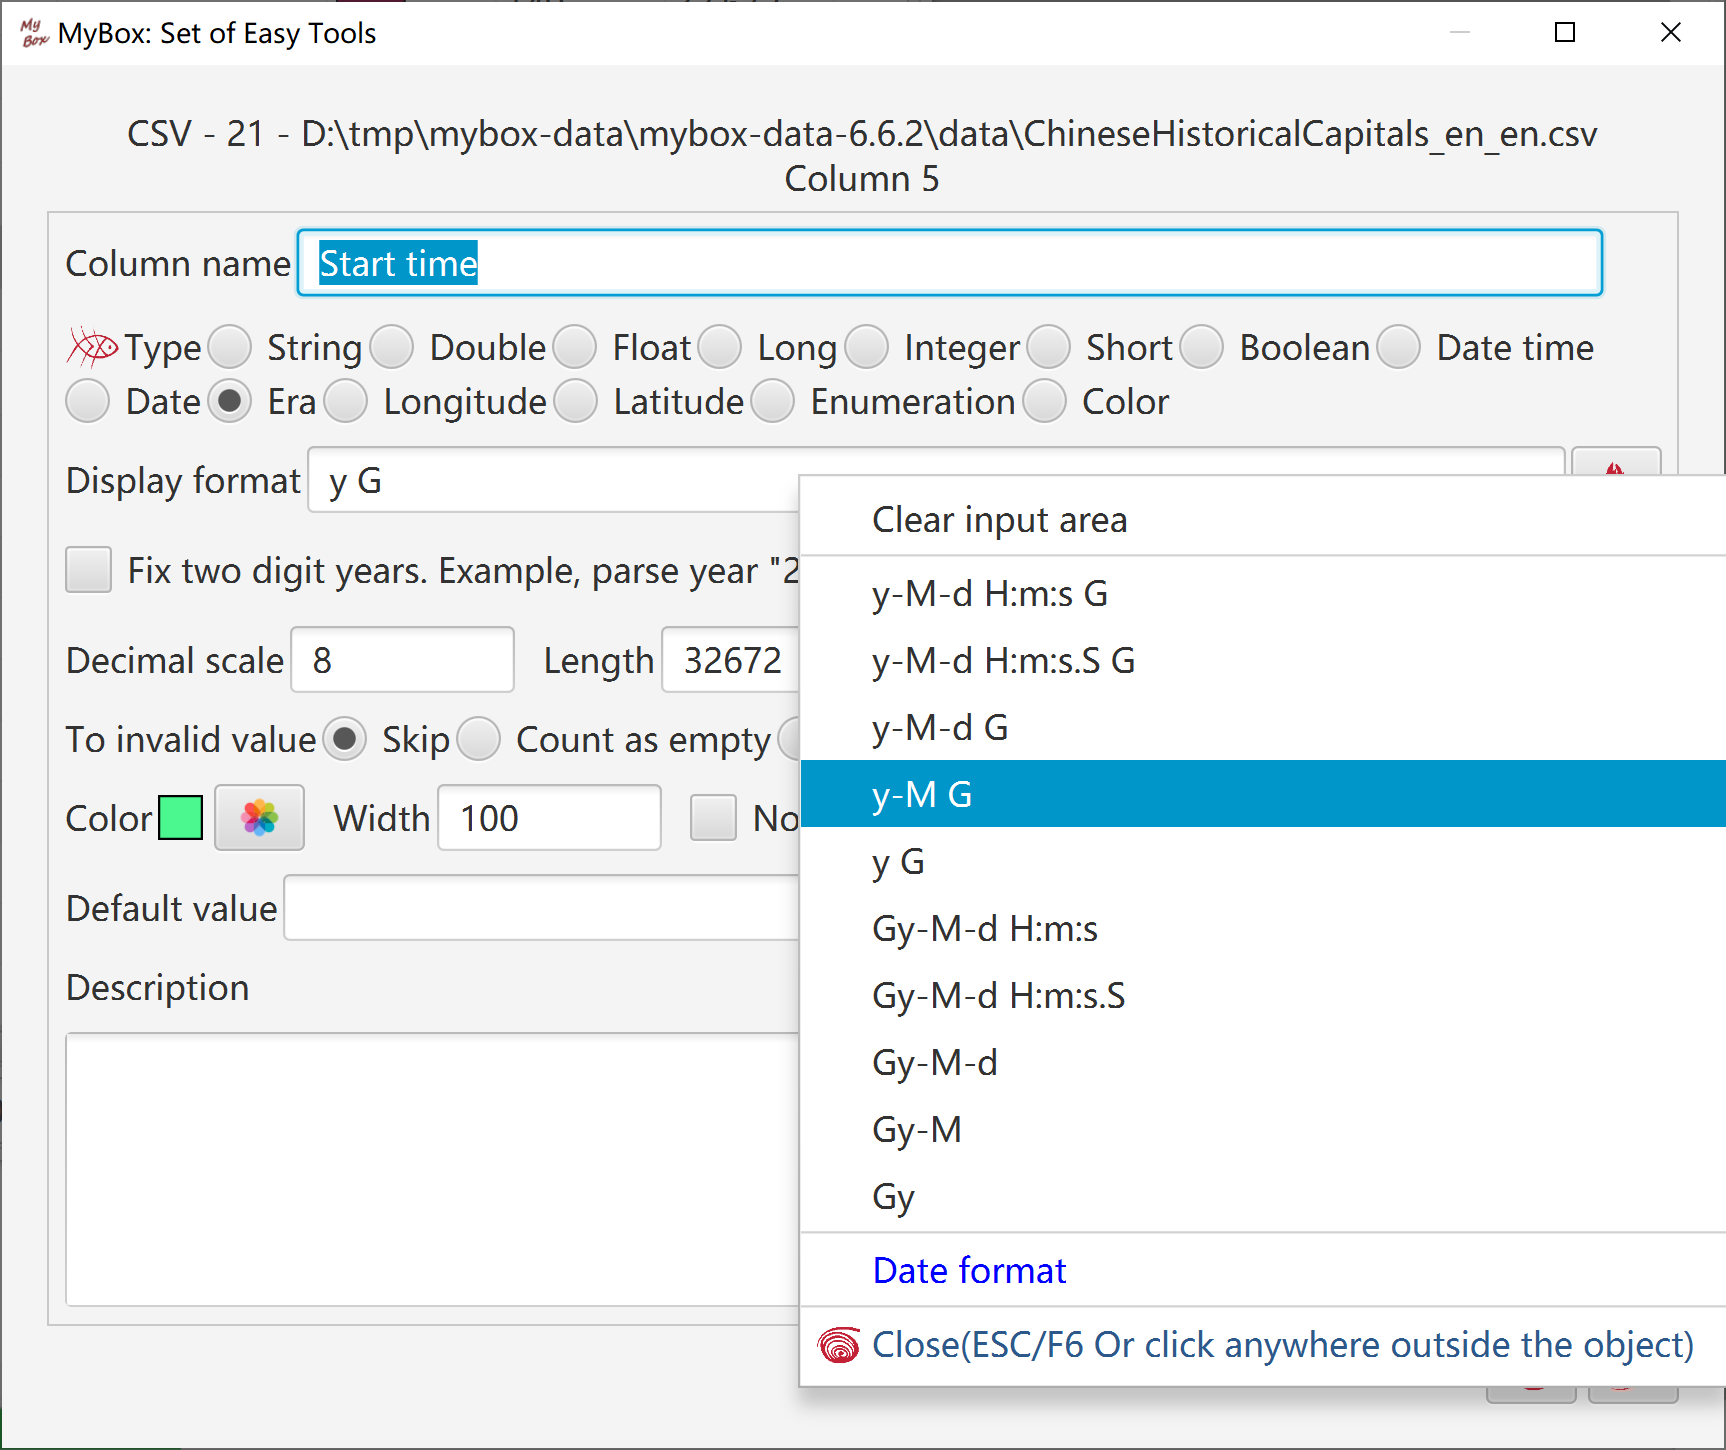
To Era, following are supported in formats: MM/dd/yy, yy-MM-dd, milliseconds, time zone, T separator, patch century, prefix/suffix of “AD” and “BC” in Chinese and English,etc..
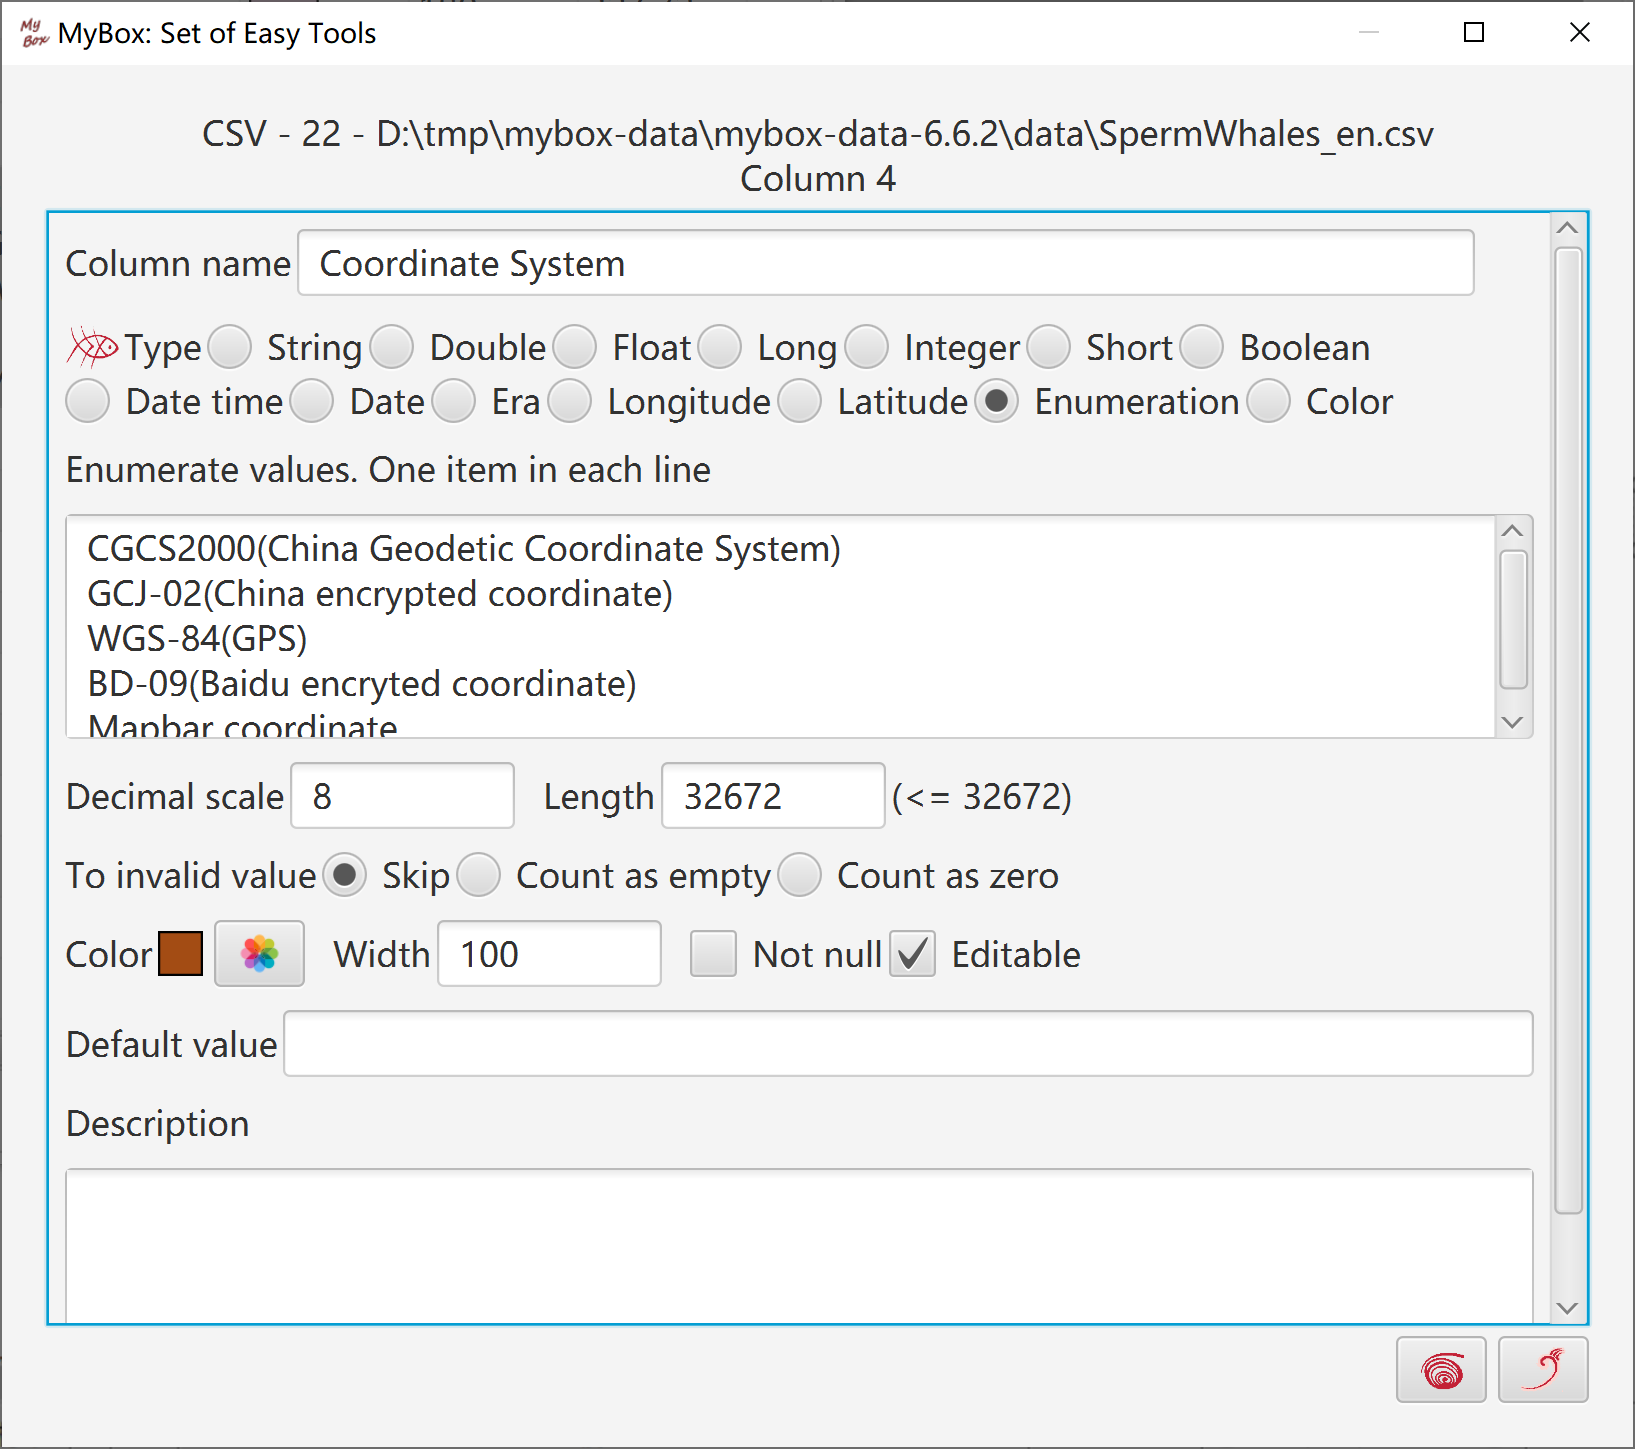
To Enumeration, list of values can be defined.
How columns handle invalid values, including: skip, count as empty, and count as zero.
In some context, “count as empty” equals to “skip”.
This attribute is only used for display or calculation. When data are inputted/edited, invalid values are not handled automatically.
Principle of column usages is “Most tolerability and least manufacture”.
When load data, types of columns are not checked, and original values are read and imported.
Parse values as columns' types.
Handle invalid values as columns' definitions.
Rewrite values as columns' formats.
Displayed values may be different from current actual values.
Example, Column type is Double and value “abc” is read:
If count invalid as zero, then display it as zero(actual value is still “abc”).
If skip or count invalid as empty, then display it as “abc”.
To Boolean, checkbox is provided.
To Enumeration, list view is provided with selections.
To Color, palette is provided.
To Longitude and Latitude, map can be popped to locate coordinate.
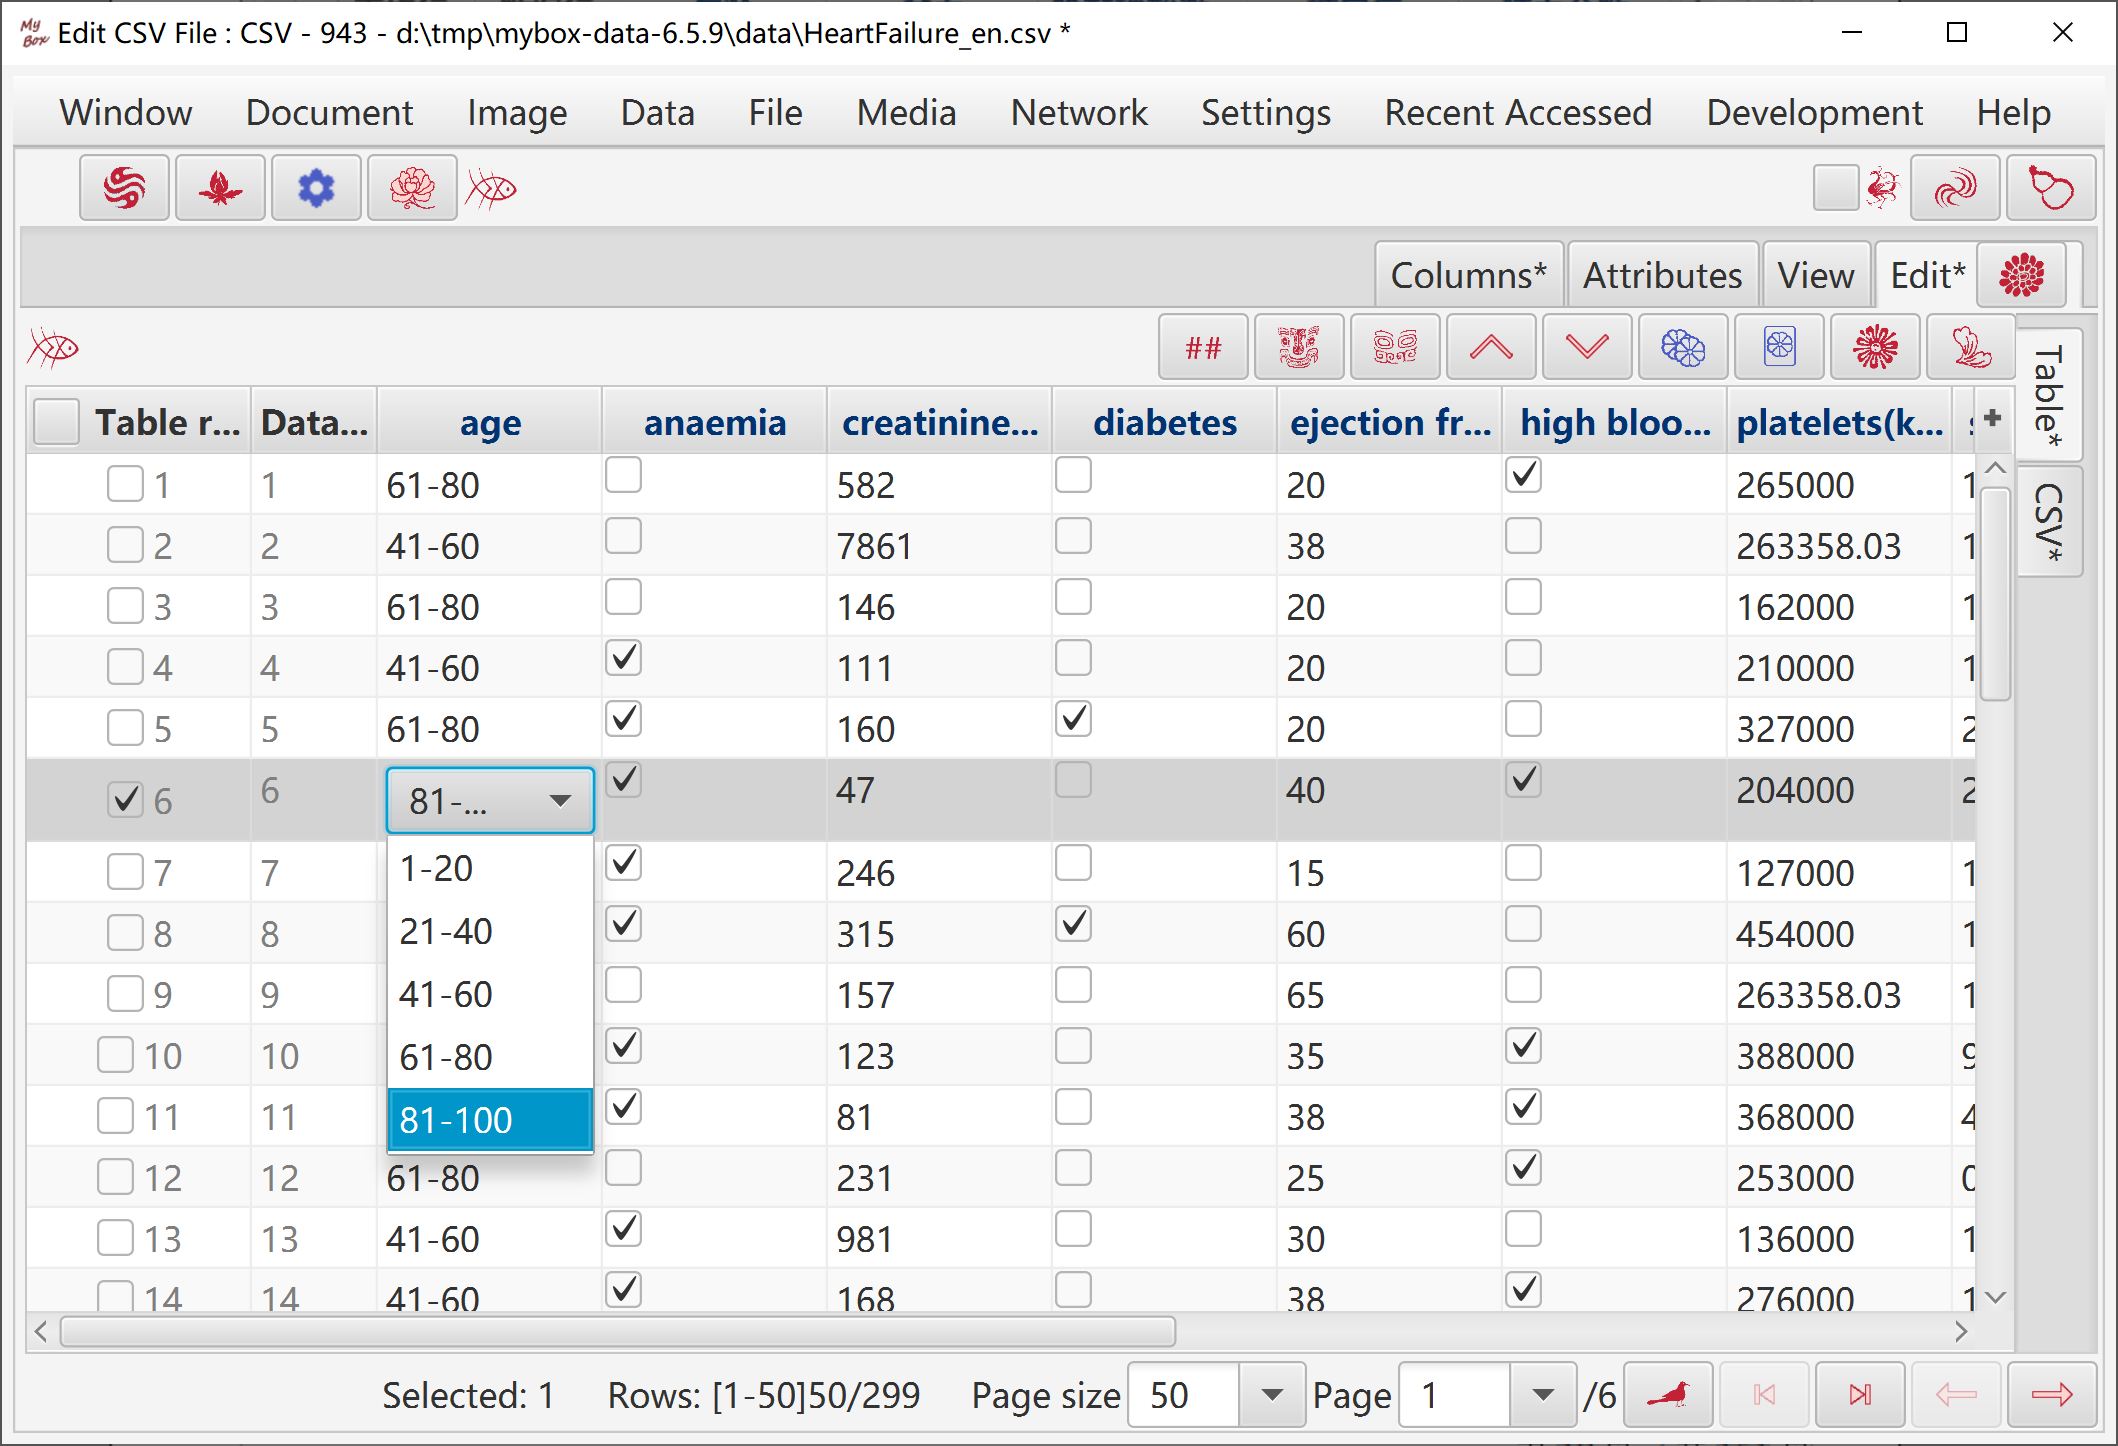
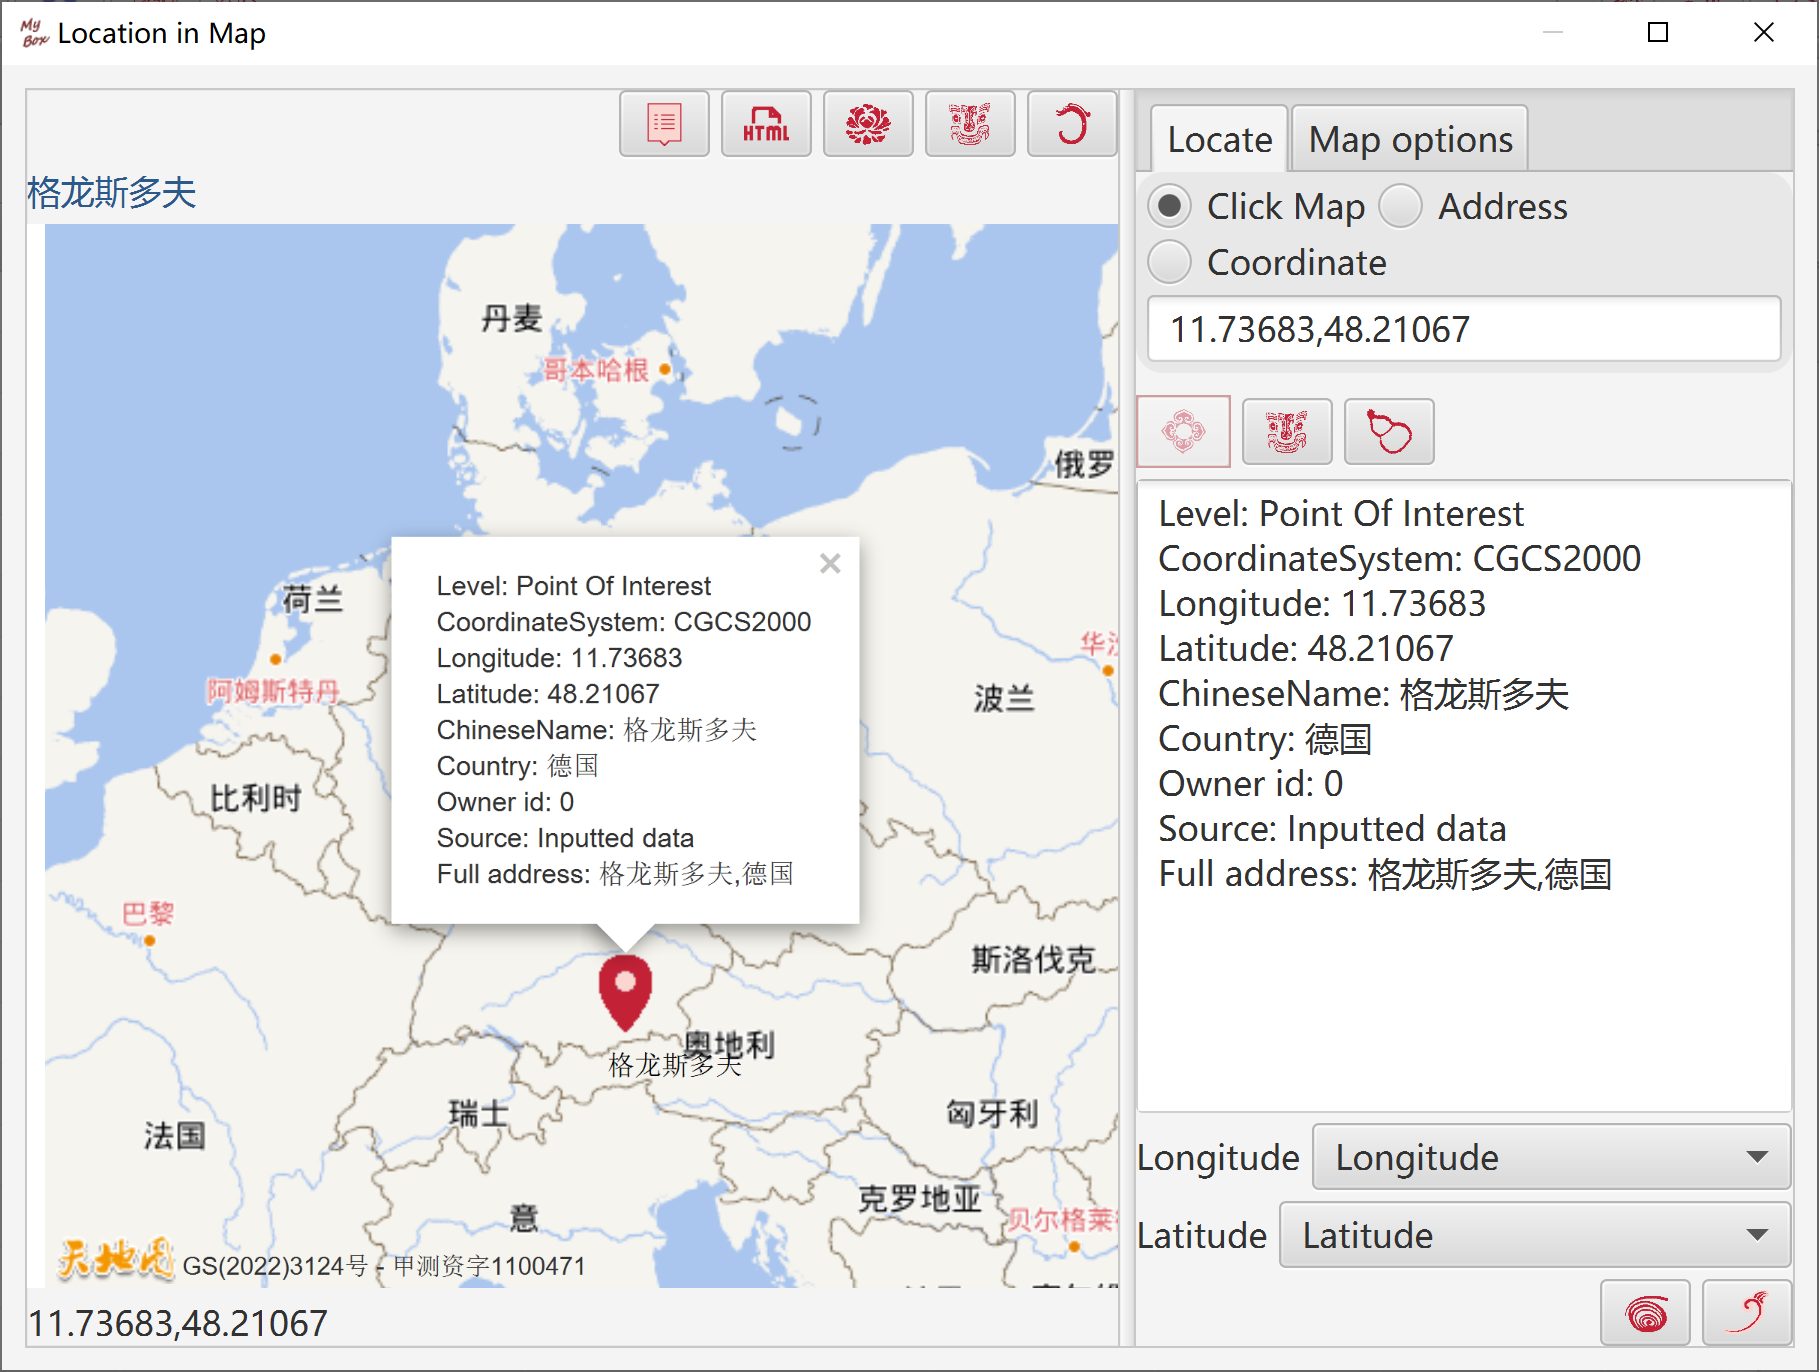
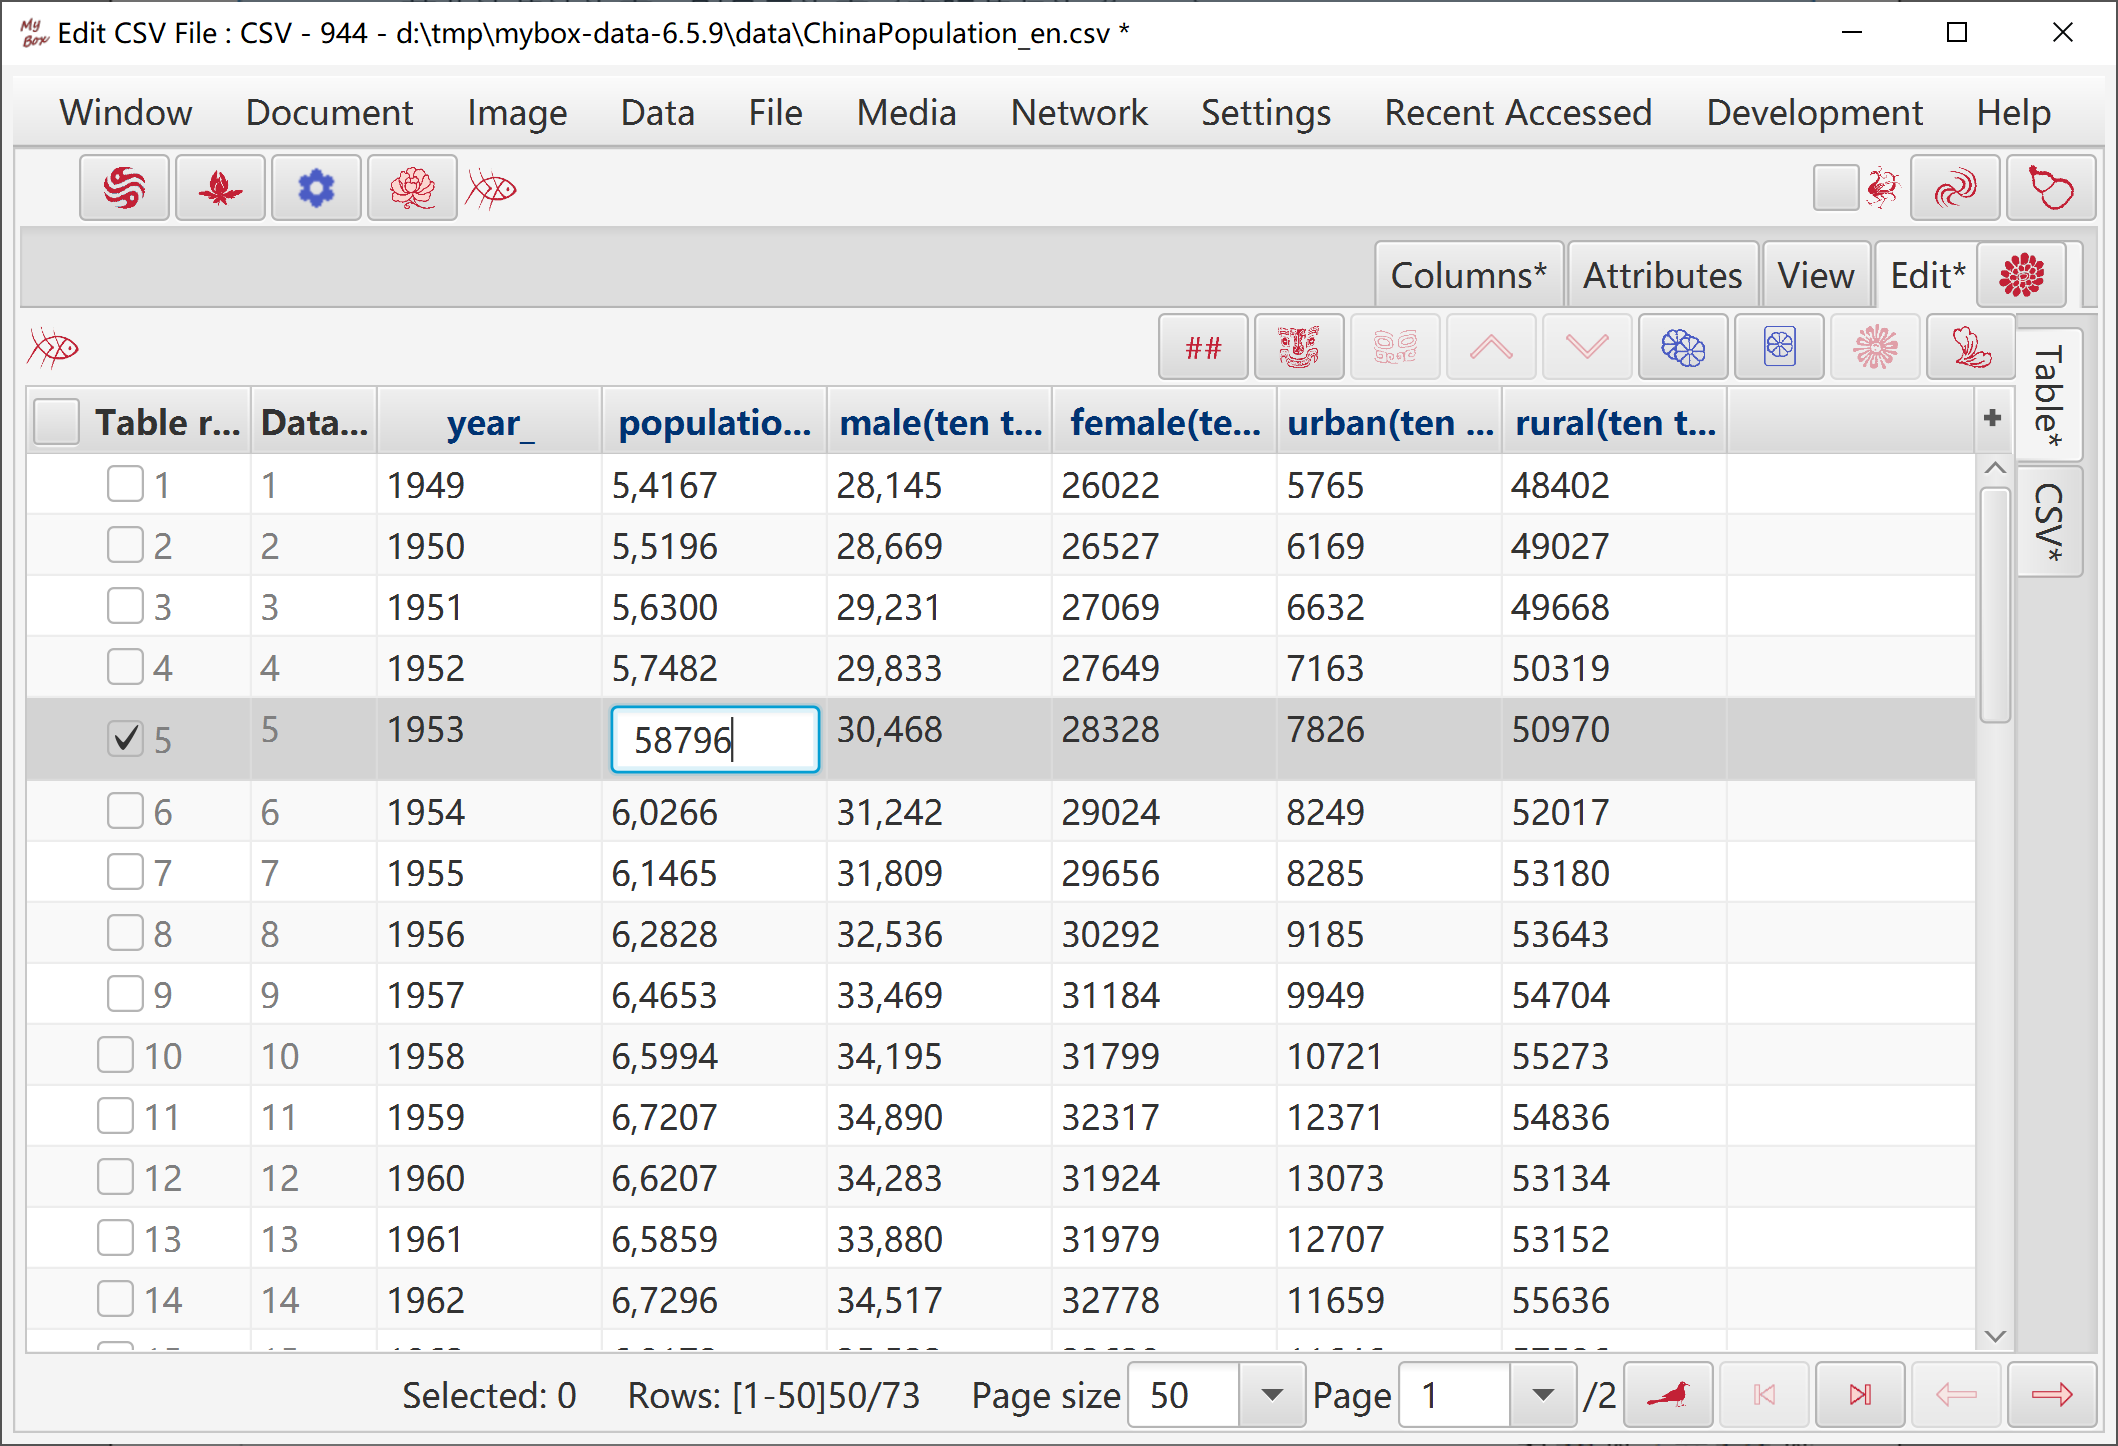
When user clicks a data cell in table view, editing is started. Its original value is displayed, while both type and format of column are ignored.
While user inputs and modifies the value, value in the edit control is checked by column type:
If value is invalid, then edit contorl is displayed in abnormal color.
If value is valid, then edit control is displayed in normal color.
The value is always kept as what user has inputted.
When focus leaves the data cell, value in the edit control is checked:
If value is not changed, then no checking of column type nor saving.
If value is changed, then check the changed value as column type:
To invalid value, discard it, and then restore and display original value.
To valid value, submit and save as new value, and then dsiplay saved value as type and format of the column.
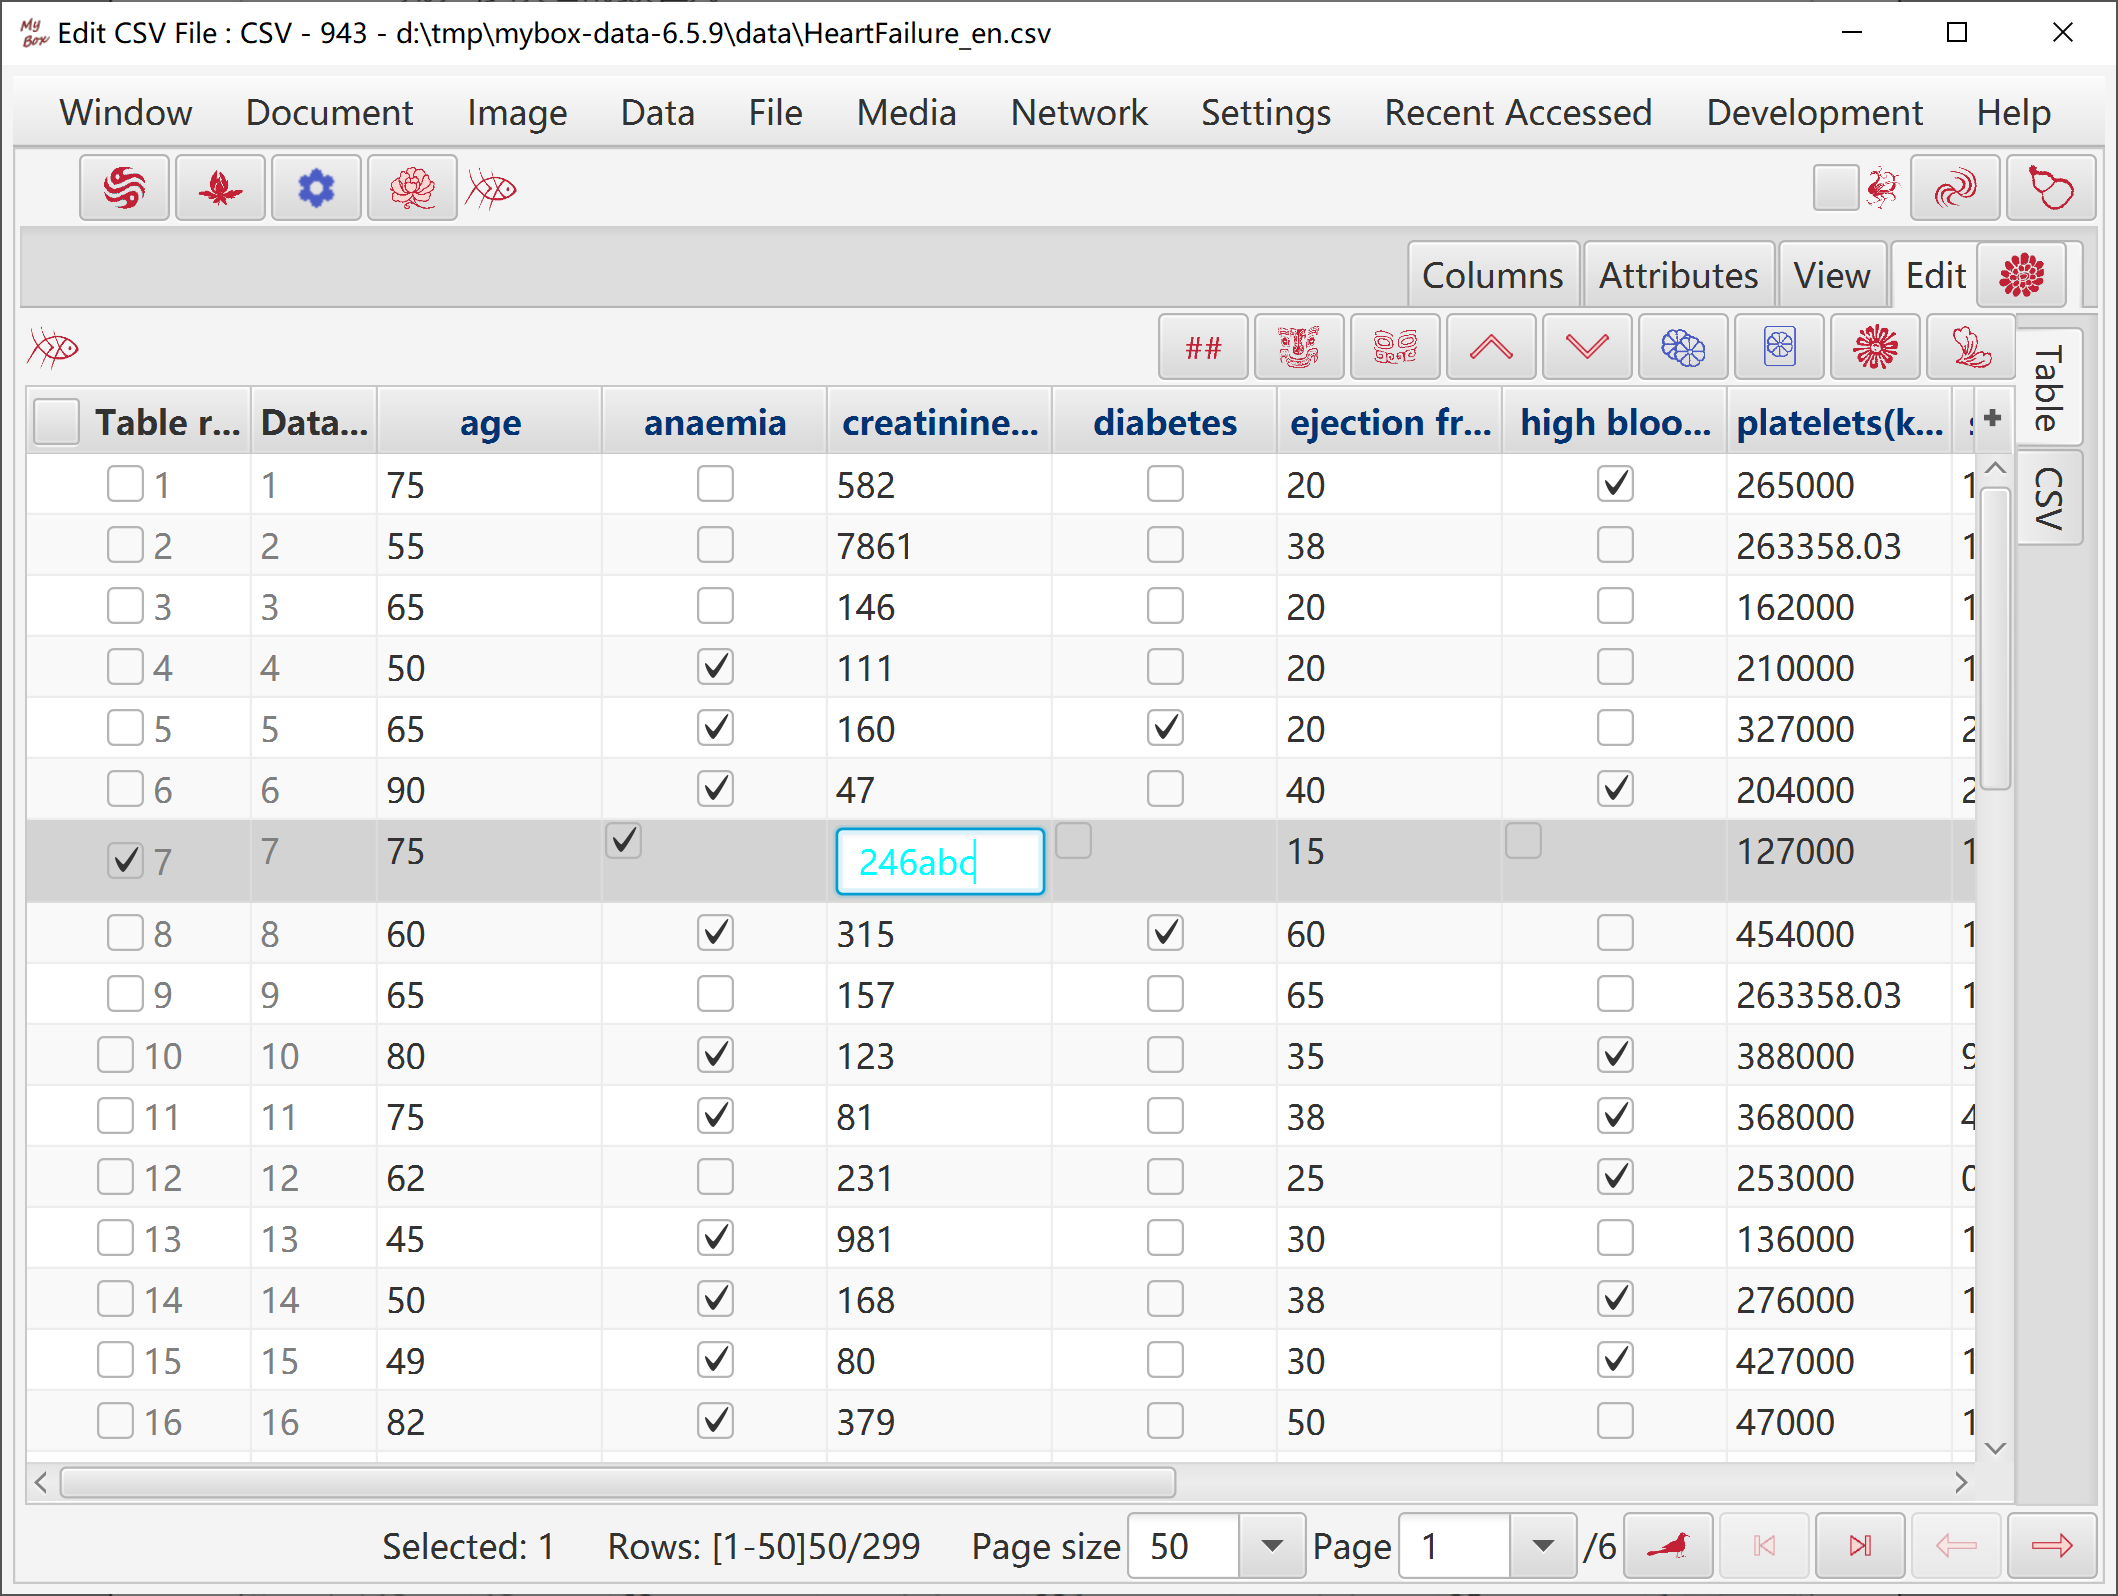
Example, column type is Double, count invalid as empty, and decimal scale is 2. When read “abc”:
The data cell is displayed as “abc”.
User modifies it as “abc123”:
While user inputs the change, the text field is always in abnormal color.
After user clicks Enter or other control, this data cell comes back as “abc” in normal color.
User modifies it as “123.4567”:
While user inputs the change, the text field is always in normal color.
After user clicks Enter or other control, this data cell is saved as “123.4567” and displayed as “123.46”.
Other data cells are not affected. That is, data cells are always in originial values if they are not changed.
Values are written into file of CSV/Texts/Excel as strings.
Values are written into database table as nearest types:
|
Column Type of MyBox |
Data Type of JDBC |
|
String |
VARCHAR |
|
Double |
DOUBLE |
|
Float |
FLOAT |
|
Long |
BIGINT |
|
Integer |
INT |
|
Short |
SMALLINT |
|
Boolean |
BOOLEAN |
|
Datetime |
TIMESTAMP |
|
Date |
DATE |
|
Era |
BIGINT |
|
Longitude |
DOUBLE |
|
Latitude |
DOUBLE |
|
Enumeration |
VARCHAR |
|
Color |
VARCHAR |
Notice: derby does not support negative date, so Ear is saved as long.
All values in Matrix are saved as Double.
Data are handled as original values, without concern about types and formats of columns.
Values are parsed as need. Example, if the calculation requires double values, then try to convert values as doubles.
If value conversion fails, then invalid value is handled as definition of column.
Calculation itself can define how to handle invalid values. Definition of calculation priors to definition of column.
Both column and calcultion can define decimal scale. Definition of calculation priors to definition of column.
Example, Column type is String, and descriptive statistic is running against it:
Try to convert each value as double.
If “count invalid value as zero”, then invalid values are calculated into “Count”, and participate in calculations of “Mean” and “Sum”.
If “skip invalid value”, then invalid values are not involved in any calculation.
If “count invalid value as empty”, then invalid values cause results of all calculations as invalid(Double.NaN).
For any calculations involved in sorting, data will be translated into a temporary database table, and be sorted by database system.
Results of sorting are related to columns' types. Example, string “124” is smaller than string “18”, while number “124” is bigger than number “18”.
Column color is mainly used for data charts.
When chart is generated, elements in it are displayed in colors as their columns' definitions.. Then user can set chart in random colors.
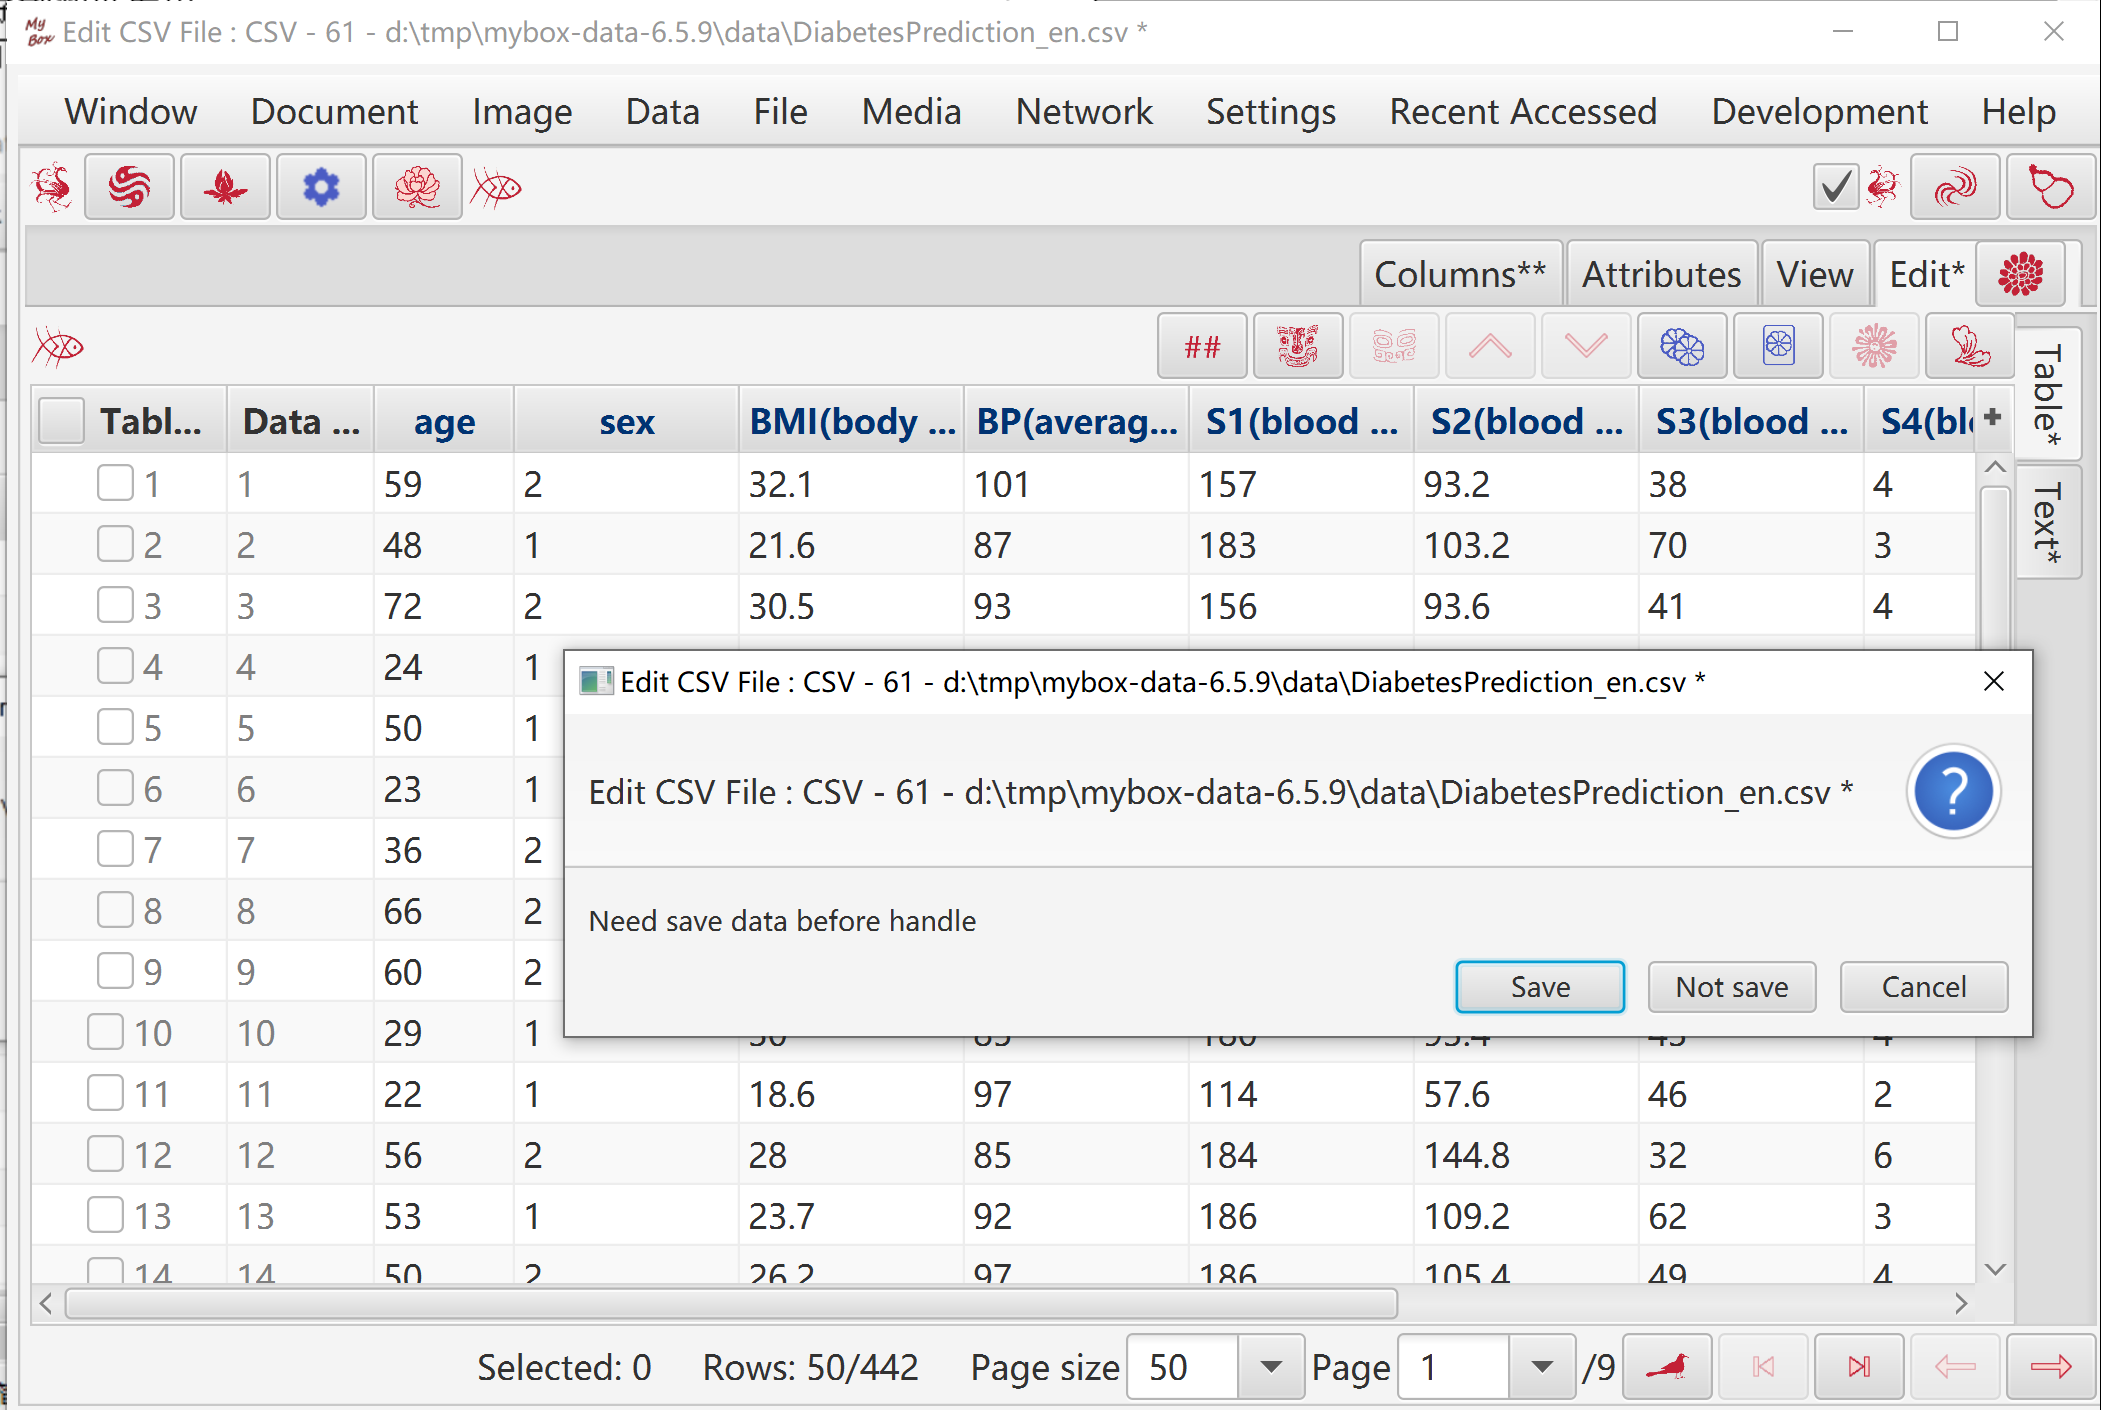
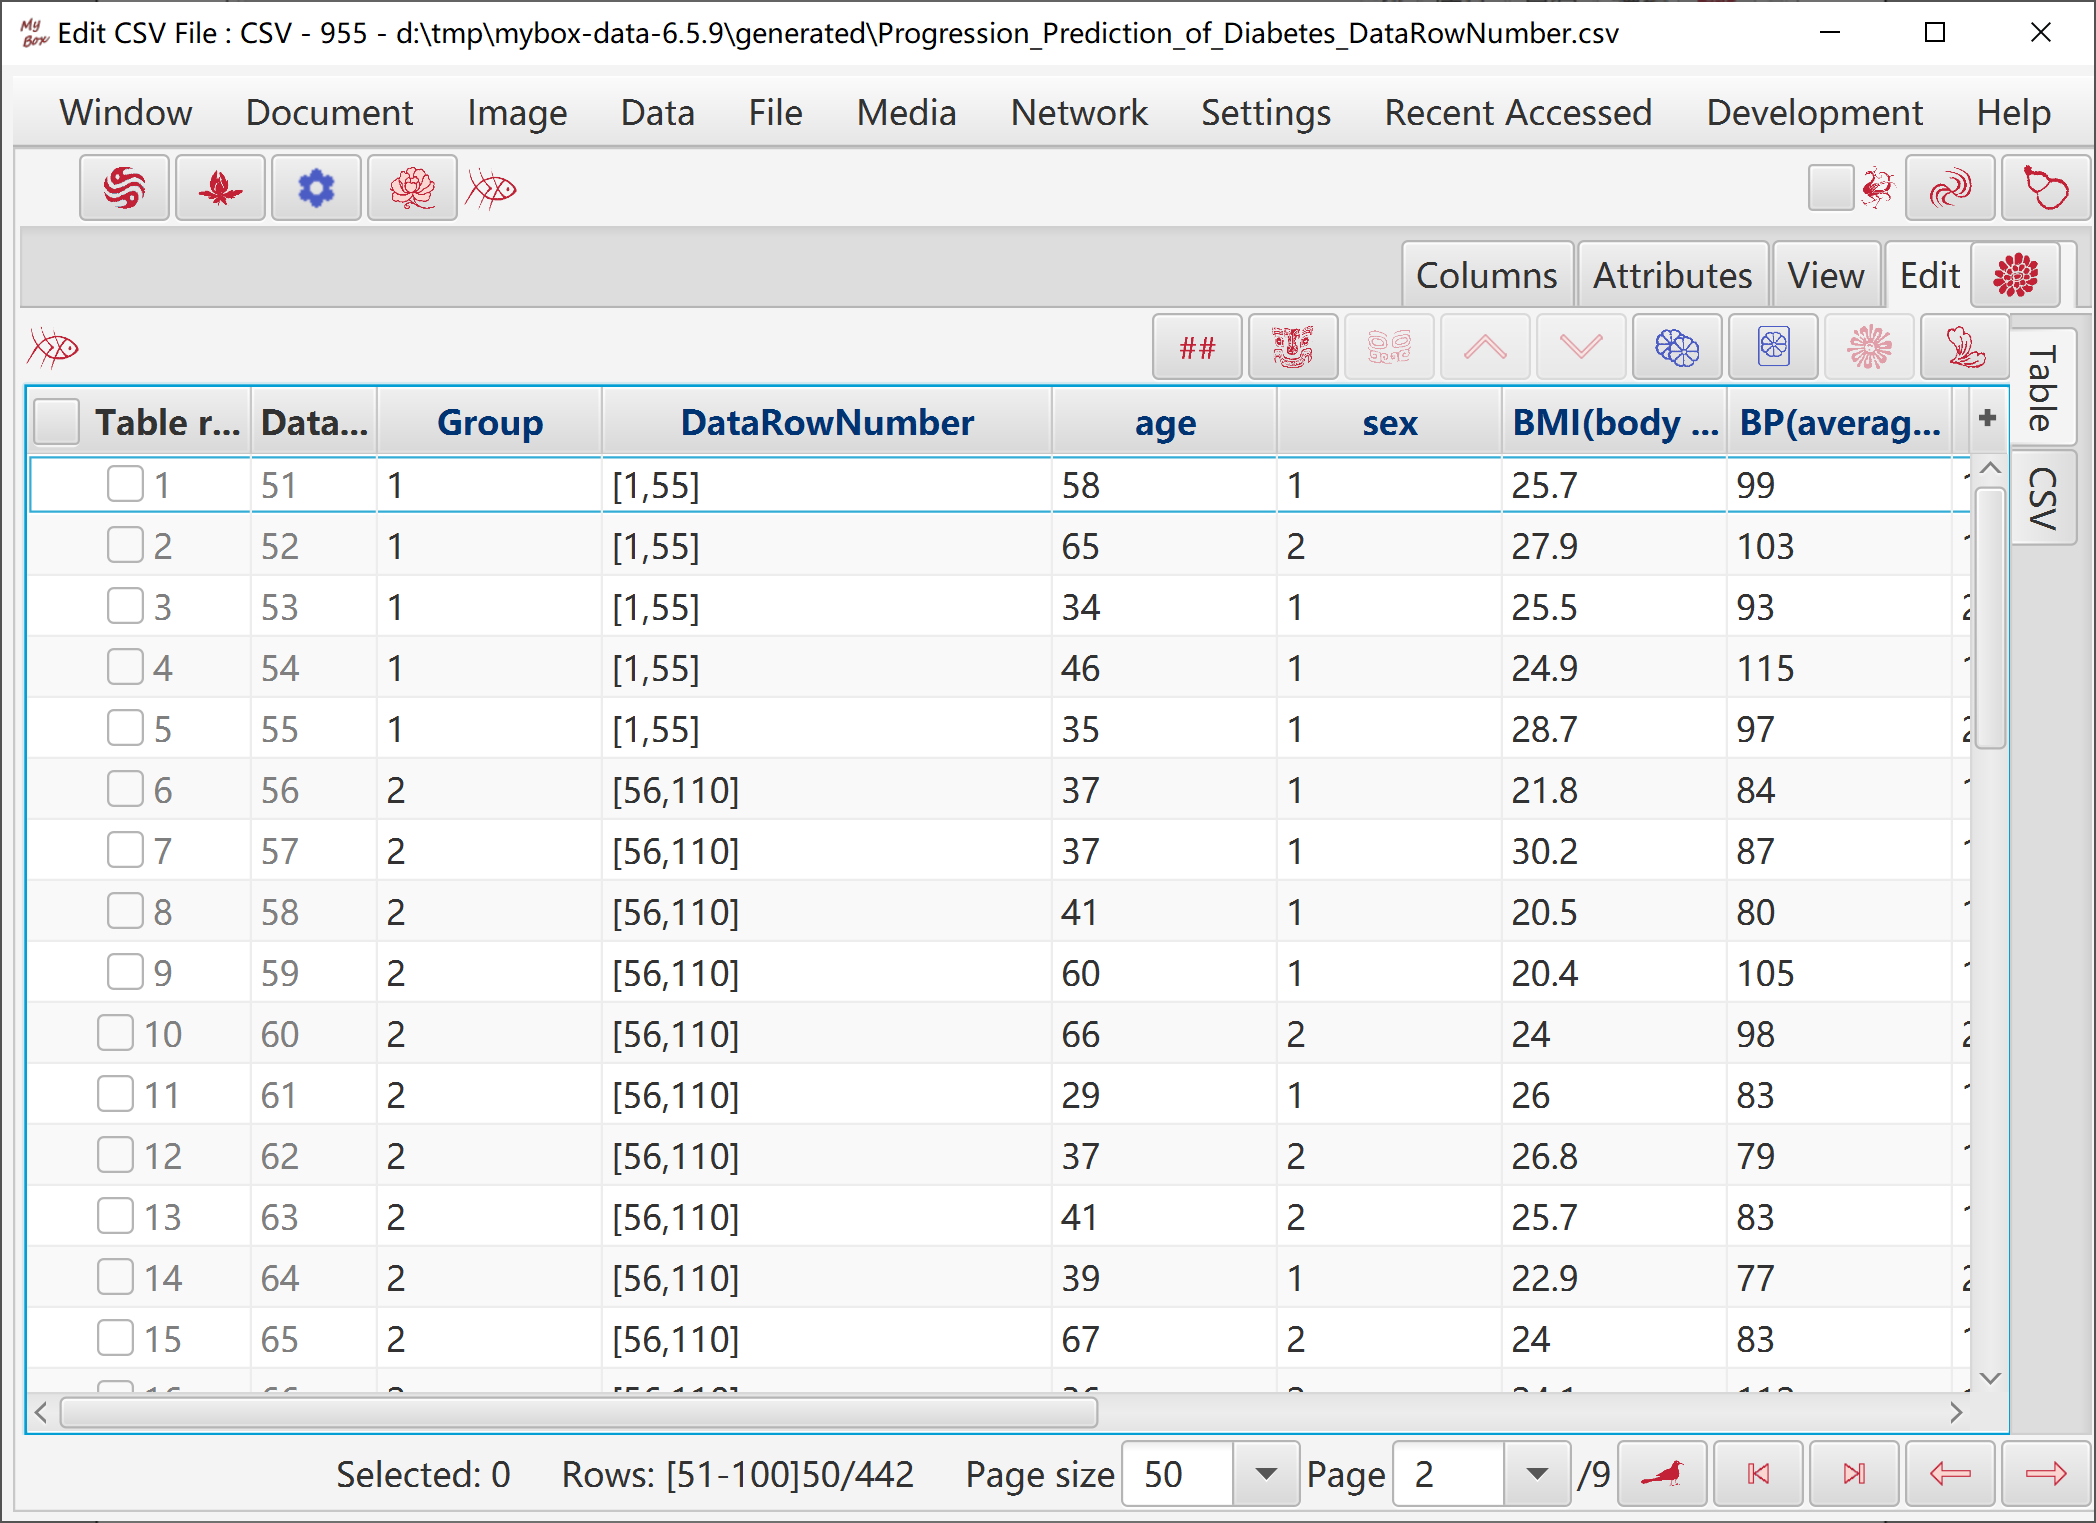
"Table" is the master edit mode:
Its modifications are applied to other panes automatically.
It is the final data to save.
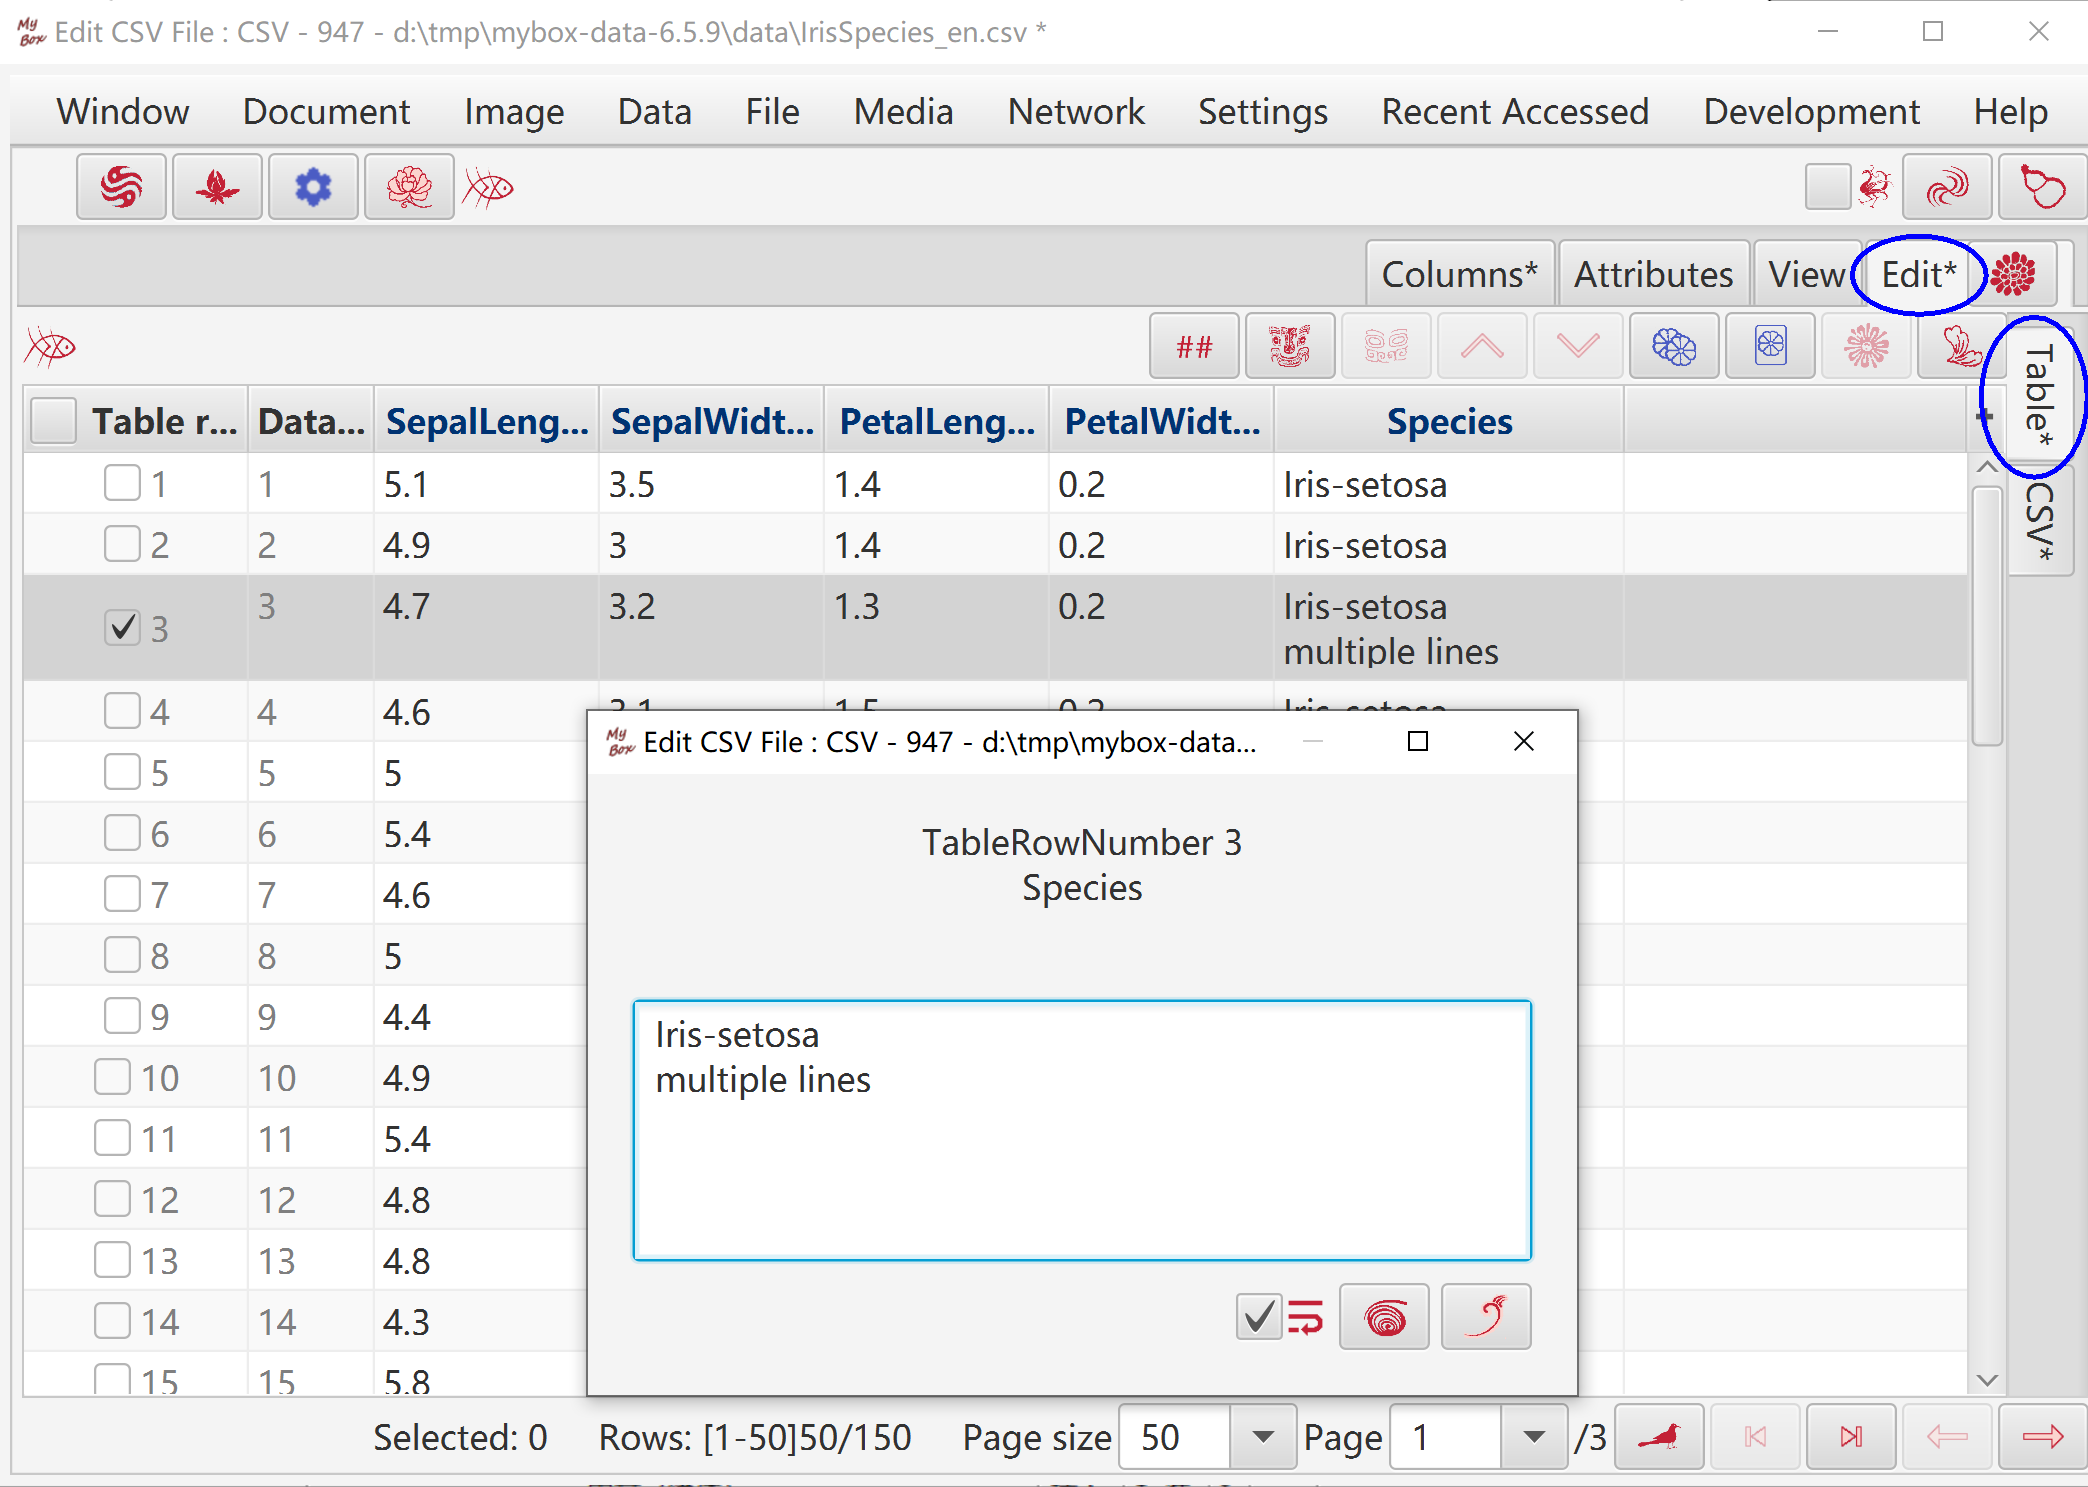
To string values, except for text file, multiple lines can be edited and saved:
When the value is single line(not contain line break):
Text field is shown when click the data cell.
Write "\n" as line break in the value and commit the change(return or click other place).
When the value contains line breaks:
Text area is shown when click the data cell.
Write the text in multiple lines directly.
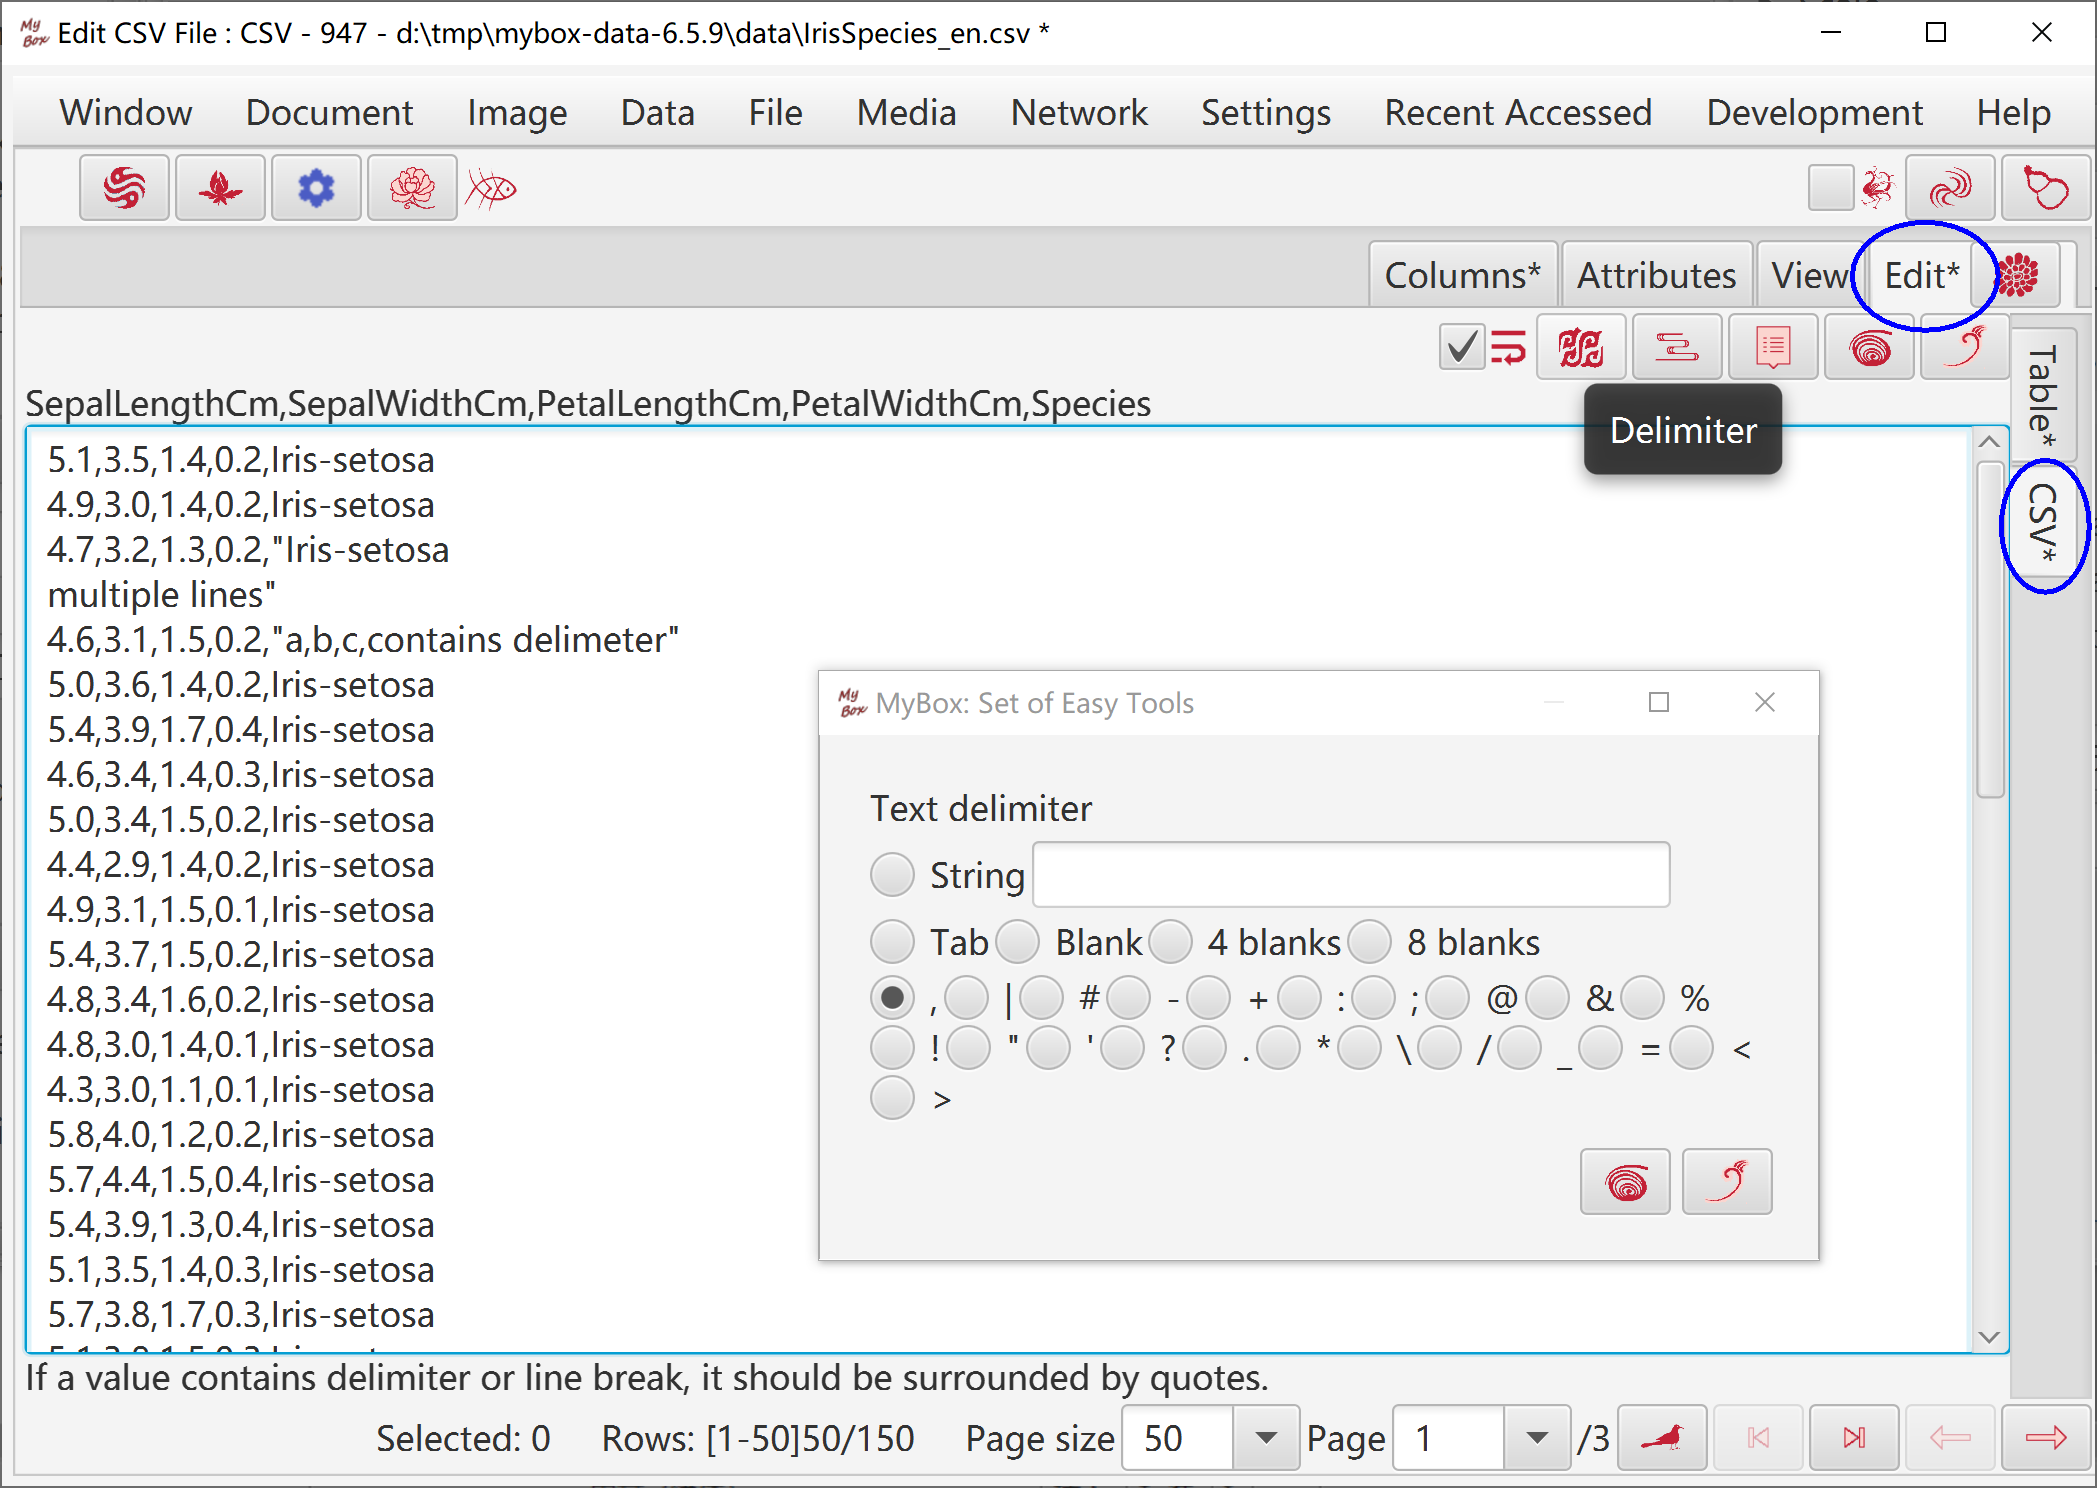
"CSV" is the assist edit mode.
Click button "OK" to apply its modifications to "Table".
Click button "Cancel" to discard its modifications and pick data from "Table".
Click button "Delimiter" to pick data from "Table" and apply new delimiter while its modifications are discarded.
If value contains delimeter or line break, it should be surrounded by quotes.
When changes are not saved, * is displayed in tab header.
Click button "Save" to write modifications to file and database:
Changes of rows in "Table", including modify/add/delete/sort, affect rows of current page in file.
Changes in "Columns" tab, including modify/add/delete/sort, affect all rows in file.
Changes of attributes and columns are saved in database.
Click button "Recover" to discard all modifications and load data from file and database.
View data of current data.
Options: Form, Title, Column Names, Row Numbers.
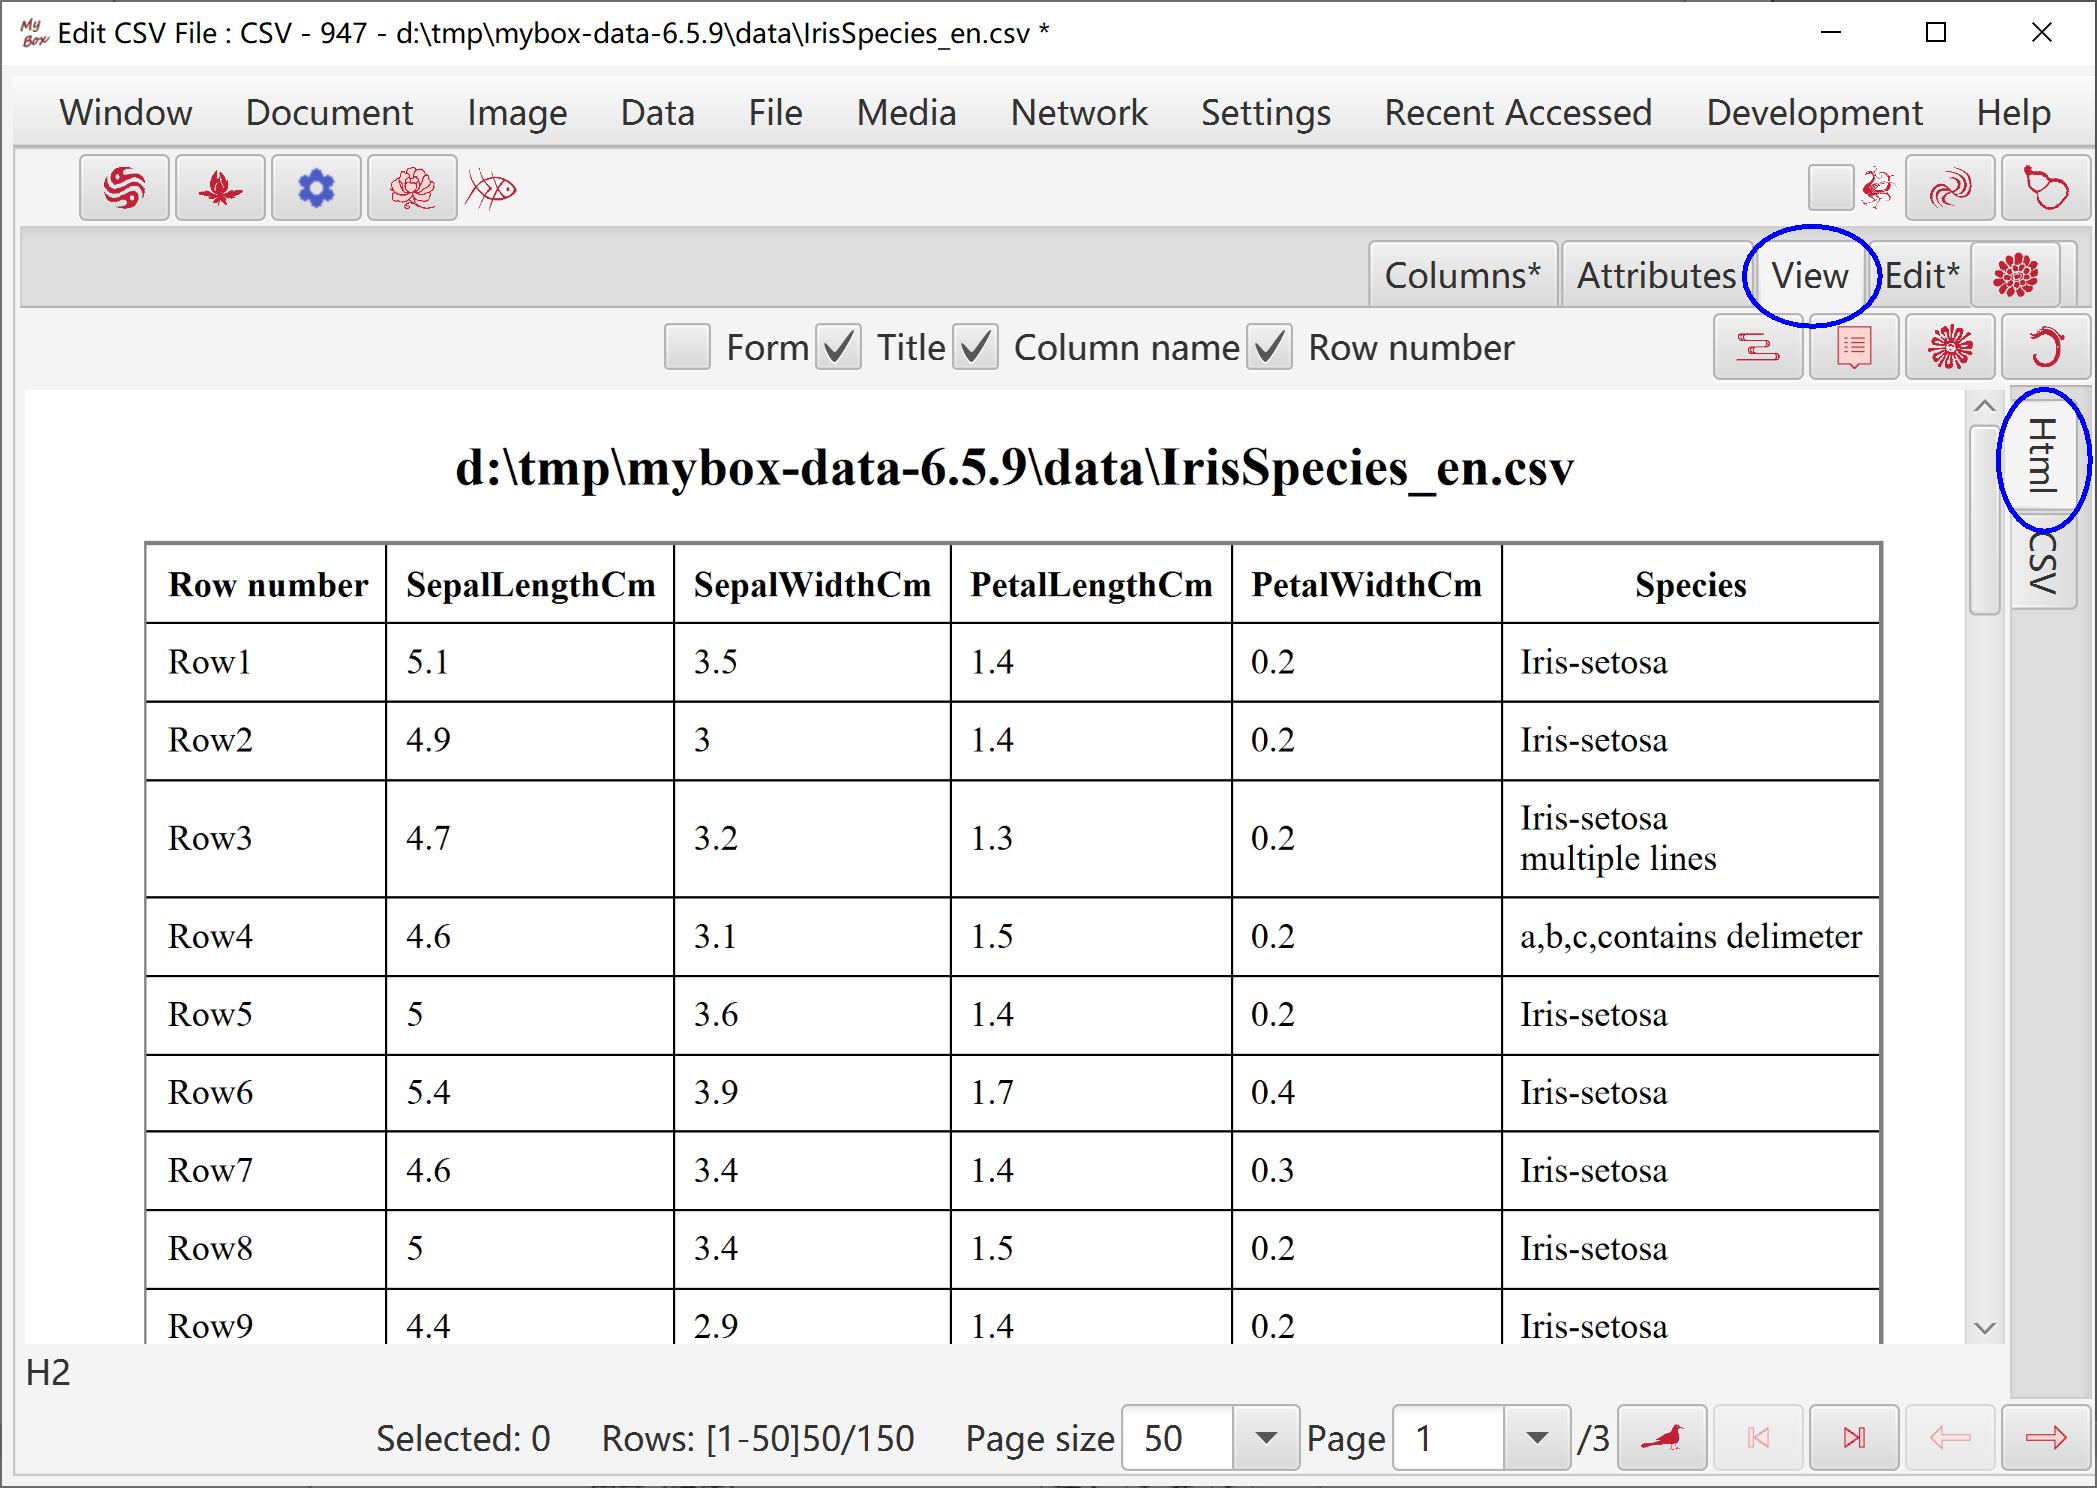
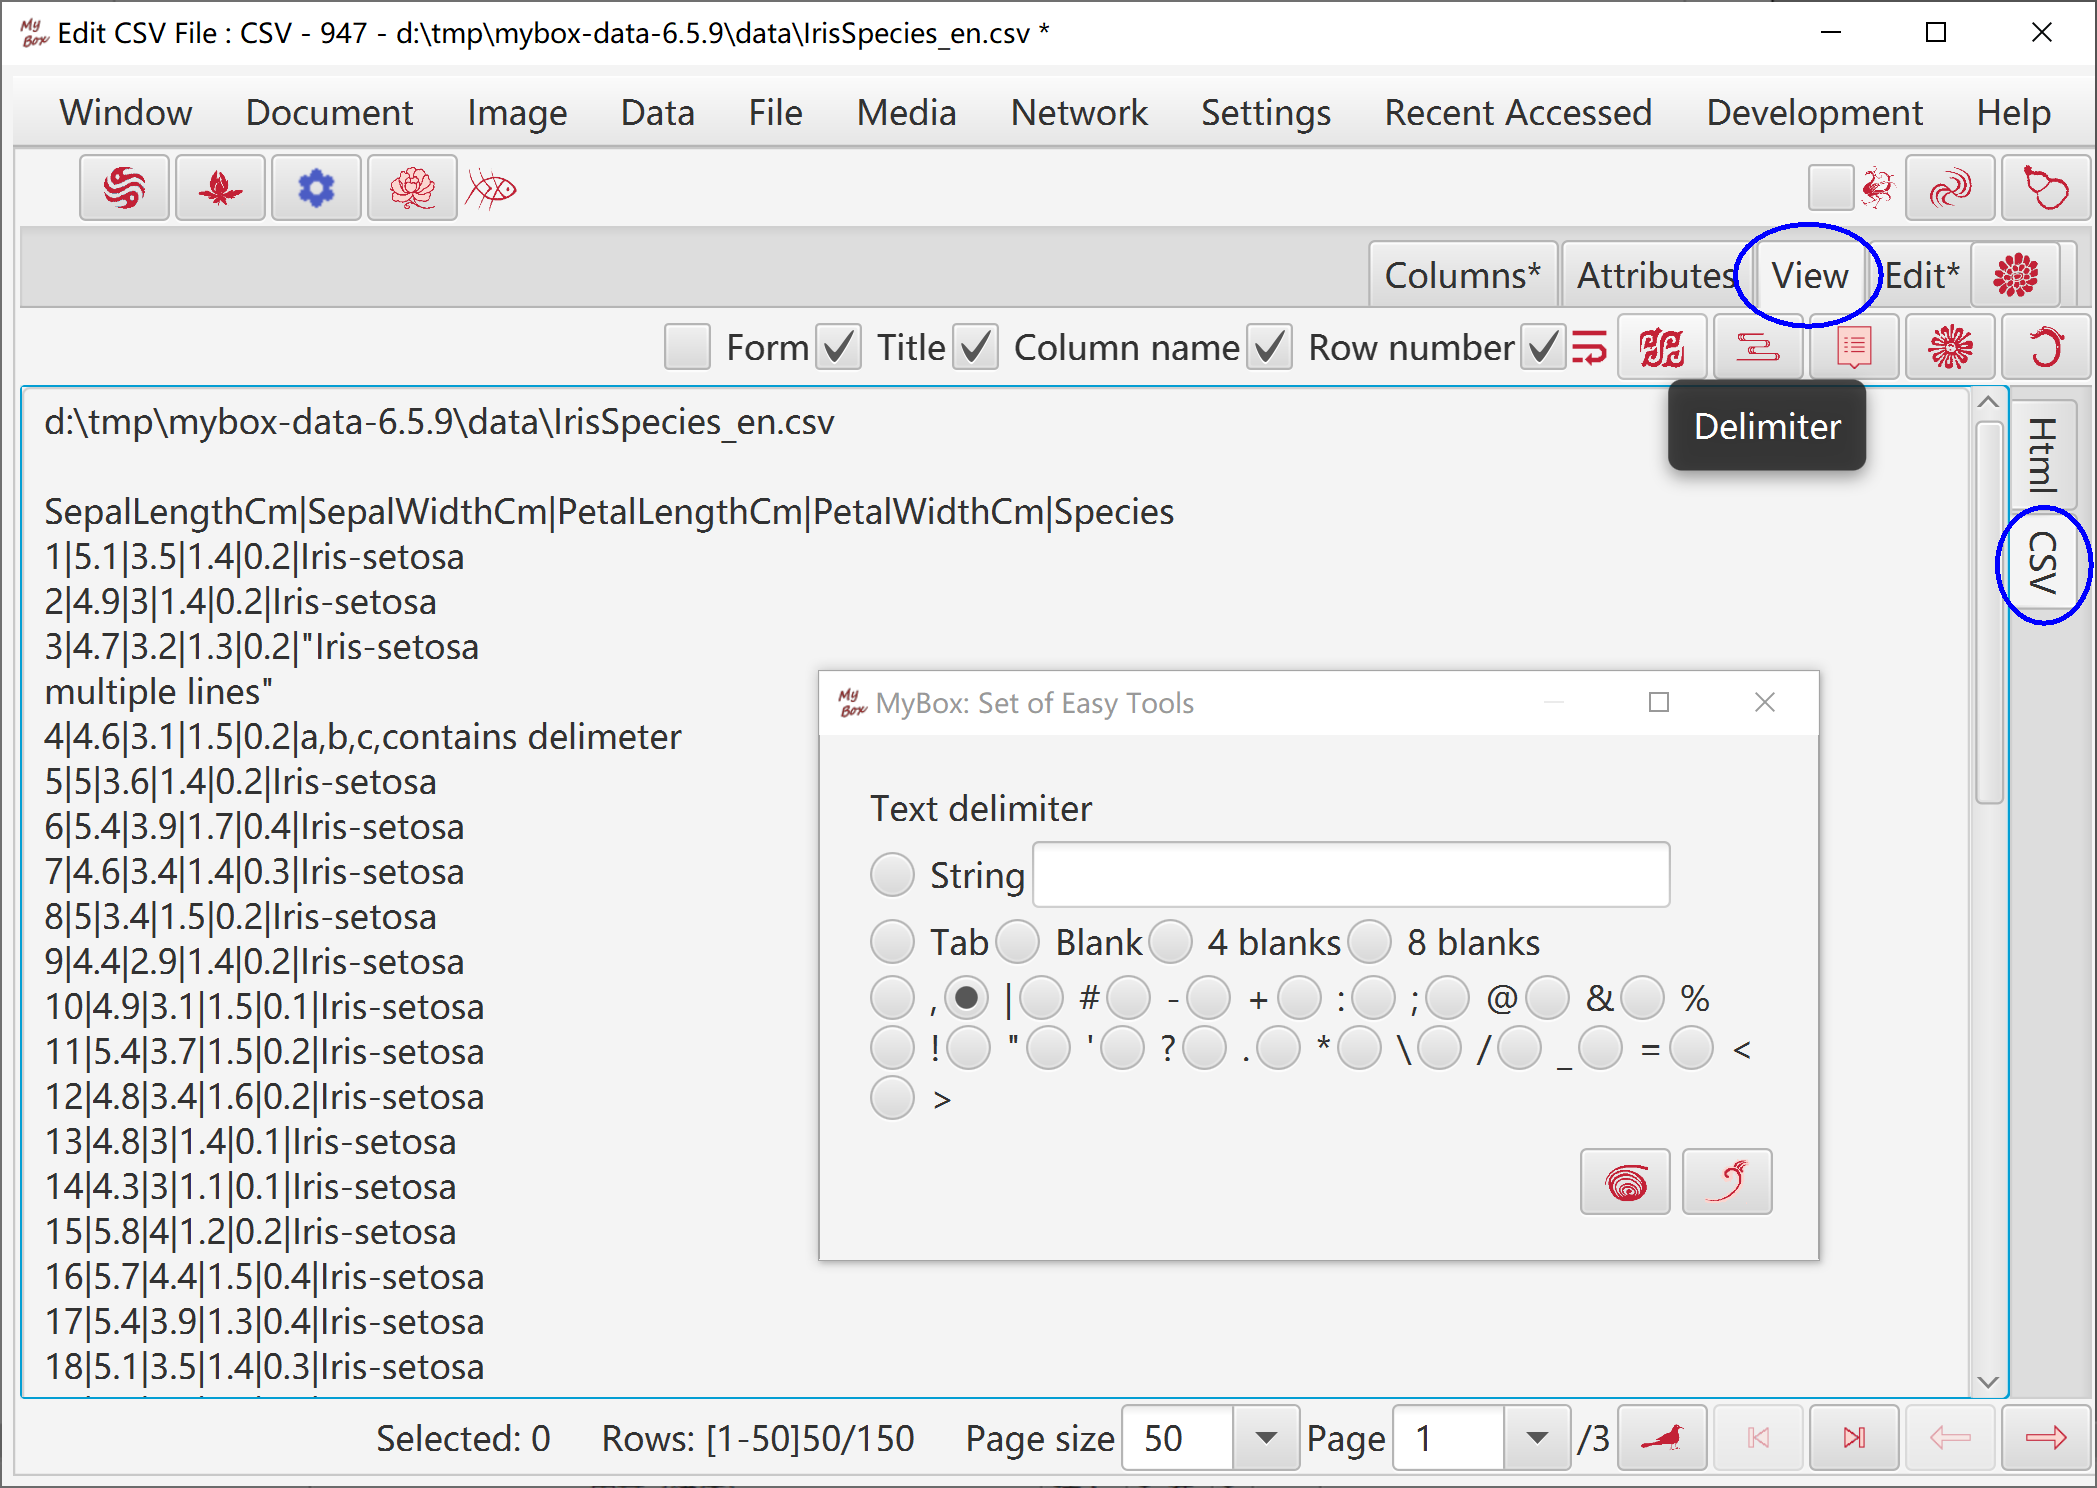
View data of current data.
Options: Form, Title, Column Names, Row Numbers.
Set delimiter.
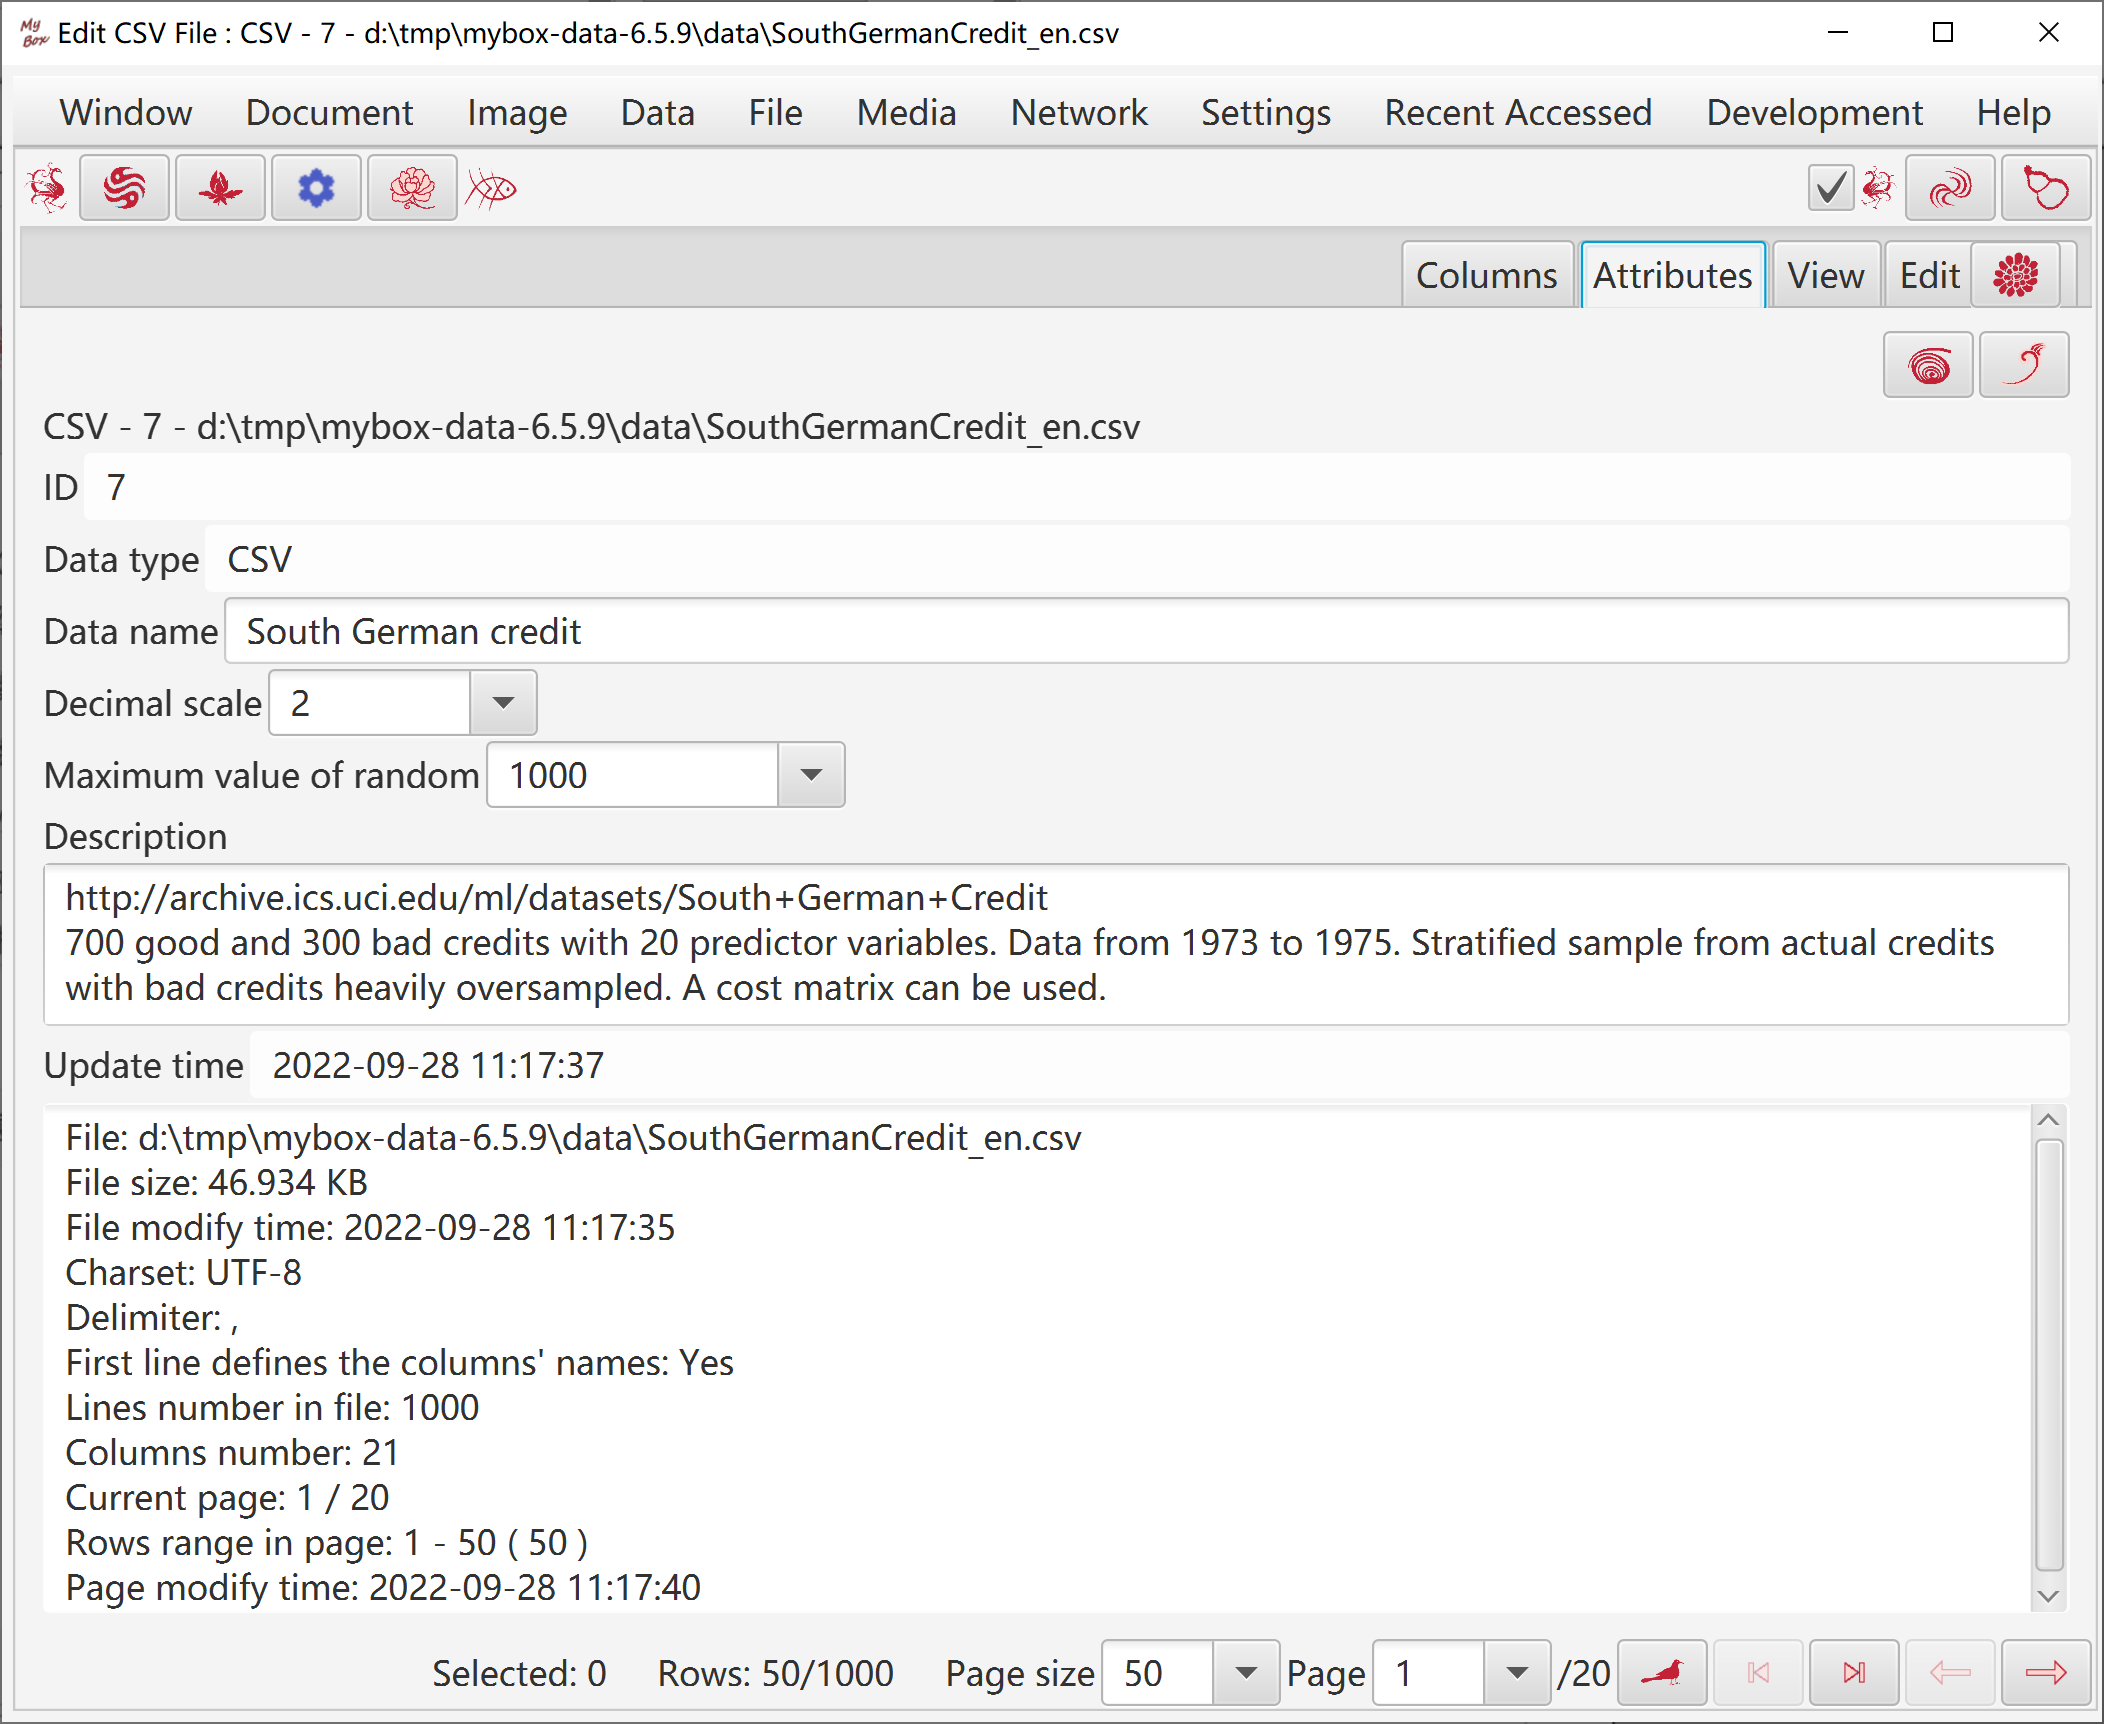
Data name, decimal scale, and maximum value of random.
JavaScript expression can be data values when manufacture/trim/calculate data or generate chart.
If the script is blank, then return empty string.
It can include any valid elments which Nashorn can parse(ECMAScript 5.1).
It should be a value finally.
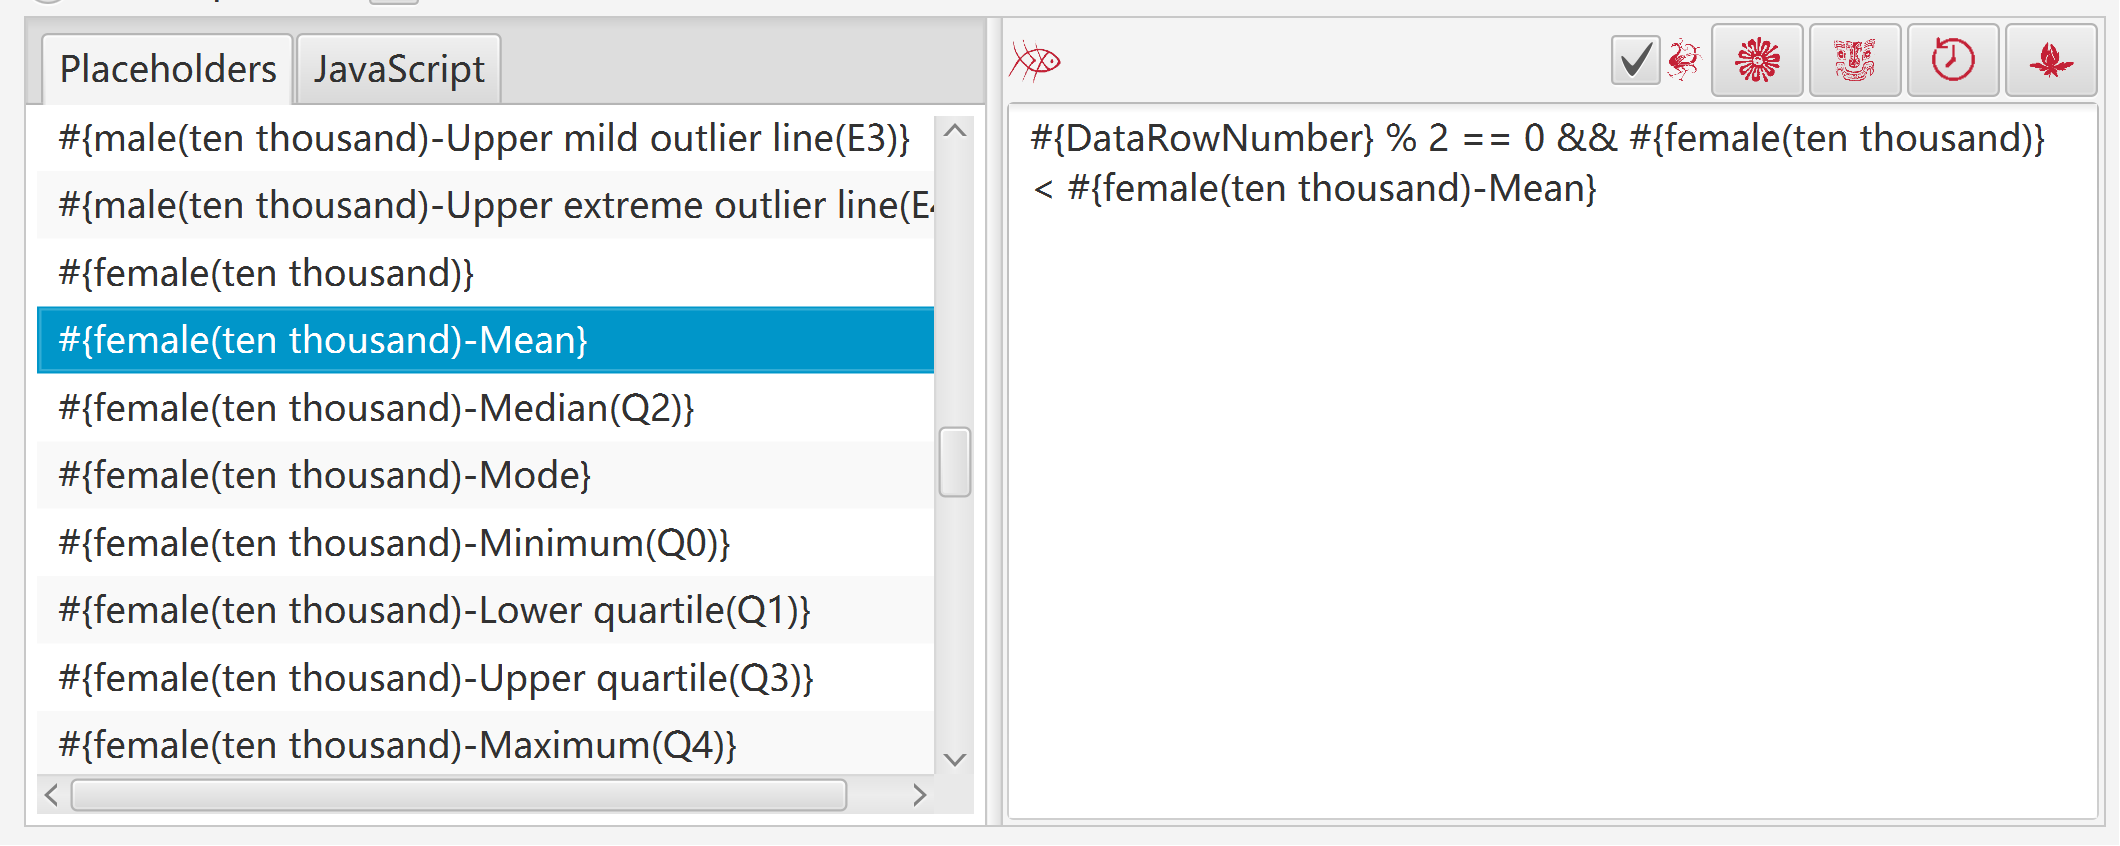
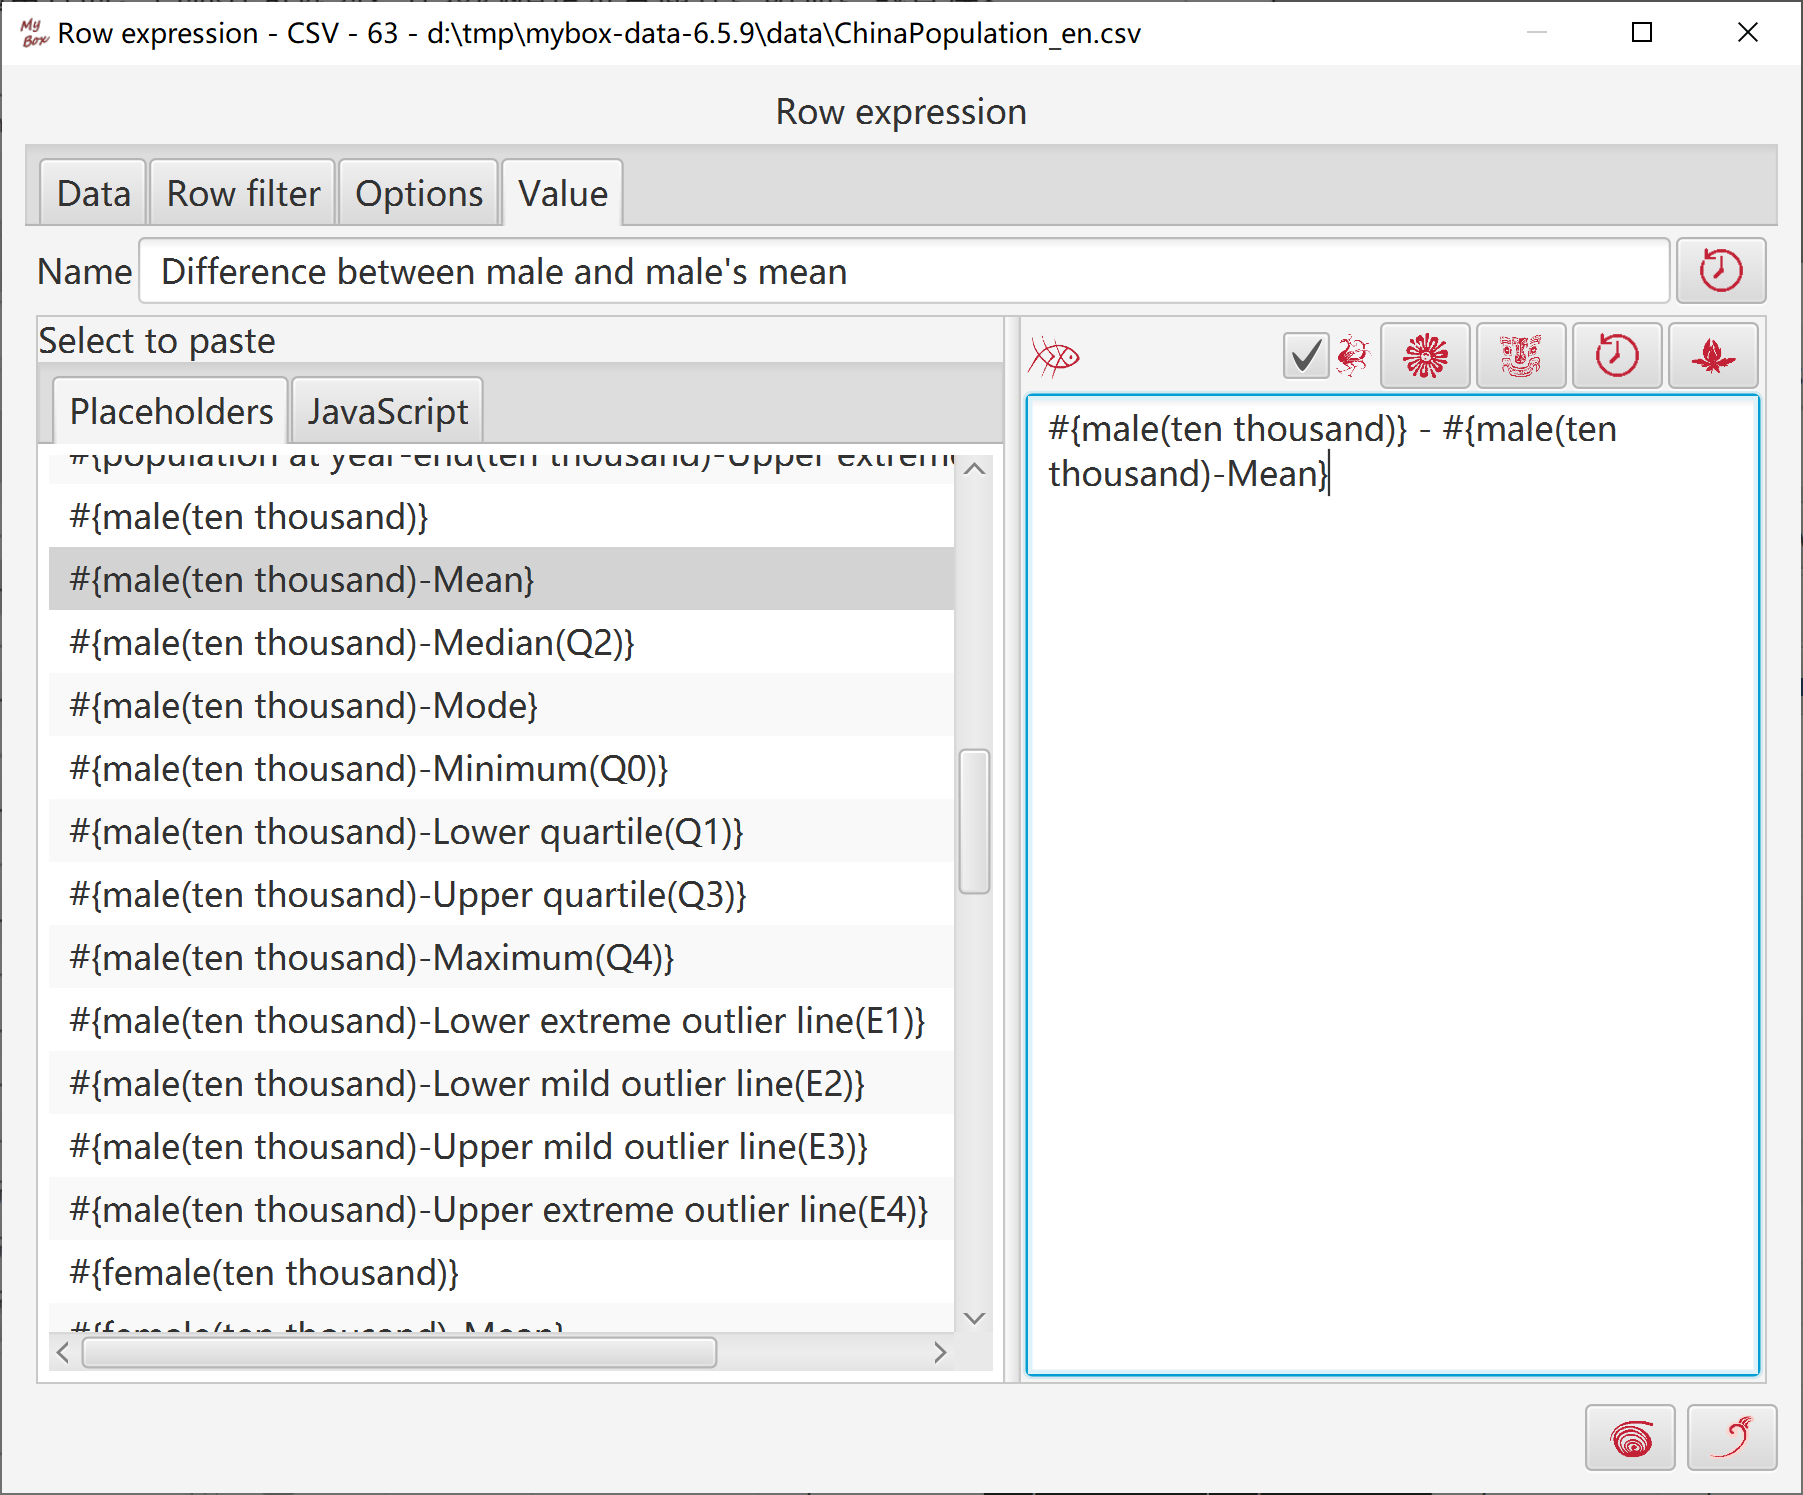
It can include following placeholders:
#{TableRowNumber}
#{DataRowNumber}
#{<column_name>}
#{<column_name>- <statistic-name>}
All valid placeholders are listed in left.
To save the script, click "Edit" button.
Hover or click button “Examples” to paste example codes.
Hover or click button “Histories” to paste codes in histories.
When MyBox evaluates the expression:
Placeholders are replaced with actual values of each data row.
Statistic values are calculated by all data.
'#{xxx}' is handled as string while #{xxx} is handled as number.
When handles all pages, script fails when it includes “#{TableRowNumber}” .
|
expression |
meaning |
|---|---|
|
#{DataRowNumber} % 2 == 0 |
data row number is even |
|
#{TableRowNumber} % 2 == 1 |
odd rows in current page |
|
Math.abs(#{v1}) + Math.PI * Math.sqrt(#{v2}) |
calculation |
|
'#{v1}'.replace(/hello/ig, 'Hello') |
replace all “hello”(case-insensitive) as “Hello” in column “v1” |
|
'#{v1}'.toLowerCase() |
lower case of value of column “v1” |
|
'#{v1}'.split(‘,’) |
split value of column “v1” by comma |
|
#{v1} - #{v1-Mean} |
difference between value of column “v1” and mean of column “v1” |
|
new Date('#{time}'.replace(/-/g,'/')).getFullYear() |
year of value of column “time” |
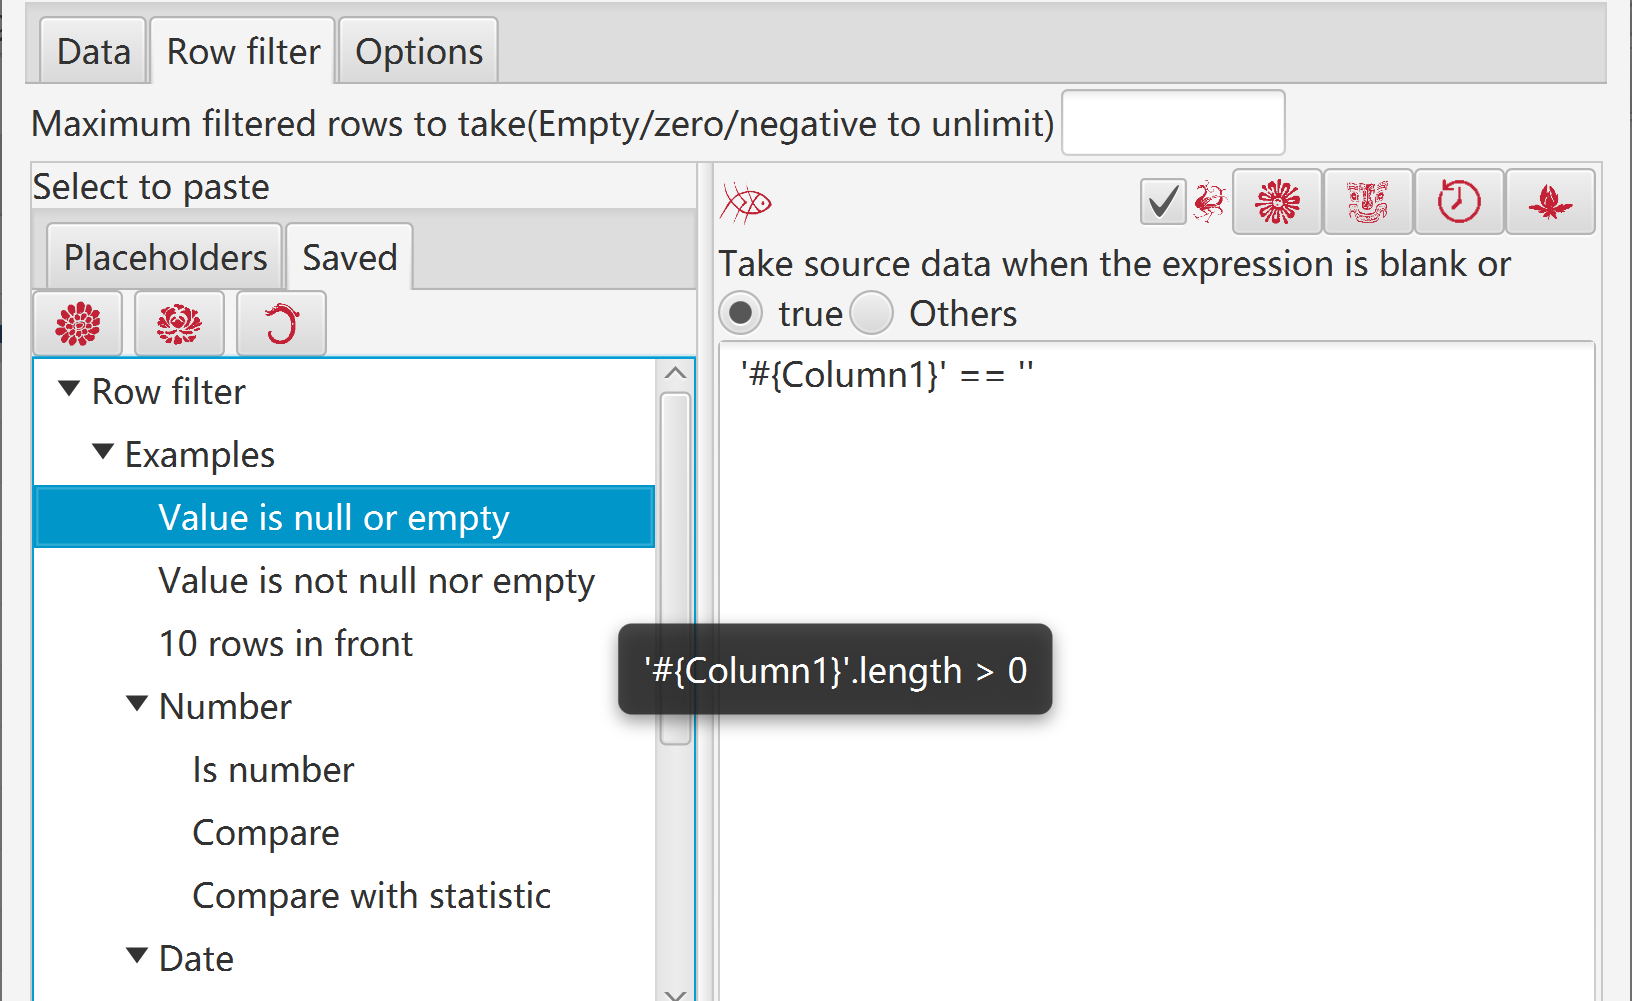
“Row Filter” is special “Row Expression”, and can be condition to filter data rows.
It should be boolean value("true" or "false") finally.
Can set maximum rows to take.
Can be saved in tree.
|
Expression |
meaning |
|---|---|
|
#{DataRowNumber} % 2 == 0 |
data row number is even |
|
#{TableRowNumber} % 2 == 1 |
odd rows in current page |
|
Math.abs(#{v1}) >= 0 |
value of column “v1” is number |
|
#{v1}) > 0 |
value of column “v1” is larger than zero |
|
#{v1} - #{v2} < 100 |
difference between values of “v1” and “v2” is less than 100 |
|
'#{v1}’ == ‘’ |
value of column “v1” is null or empty |
|
'#{v1}'.length > 0 |
value of column “v1” is not empty |
|
'#{v1}'.search(/Hello/ig) >= 0 |
value of column “v1” includes “Hello”(case-insensitive) |
|
'#{v1}'.startsWith(‘Hello’) |
value of column “v1” starts with “Hello” |
|
var array = [ ‘A’, ‘B’, ‘C’];array.includes(‘#{v1}’) |
value of column “v1” is one of “A”, “B”, “C” |
|
#{v1} < #{v1-Mean} |
value of column “v1” is less than mean of column “v1” |
|
new Date('#{time}'.replace(/-/g,'/')).getTime() > new Date('2016/05/19 09:23:12').getTime() |
value of column “time” is later than '2016/05/19 09:23:12' |
Before grouping, rows can be filtered. That is, objects of grouping are filtered rows.
In order to implement sorting and statistic with database system, data are converted as temporary database table automatically before grouping.
Sorting condition and maximum data number of each group can be set for grouped data.
With grouped data, following can be handled:
Add grouping information in source data, which are 2 new columns: Group Number and Group Parameter.
Split data into multiple files of groups.
Calculate descriptive statistic of groups.
Display following types of charts in sequence of groups dynamically: XY chart, pie chart, comparison bars chart, self comparison bars chart, box-and-whisker chart.
MyBox supports six ways to group data:
|
Grouping |
Results |
||
|
Way |
Parameters |
complete |
Non-intersect |
|
Equal values |
Several column names |
Yes |
Yes |
|
Value Ranges |
Column name + Size of split |
Yes |
Yes |
|
Column name + Number of split |
Yes |
Yes |
|
|
Column name + List of “start-end” |
Possible |
Possible |
|
|
Time values |
Column of date/time + Time unit |
Yes |
Yes |
|
Expression |
Row expression |
Yes |
Yes |
|
Conditions |
Several row filters |
Possible |
Possible |
|
Row numbers |
Size of split |
Yes |
Yes |
|
Number of split |
Yes |
Yes |
|
|
List of “Start-end” |
Possible |
Possible |
|
Following are their descriptions.
Select several columns and put rows into same group when they have same values of these columns.
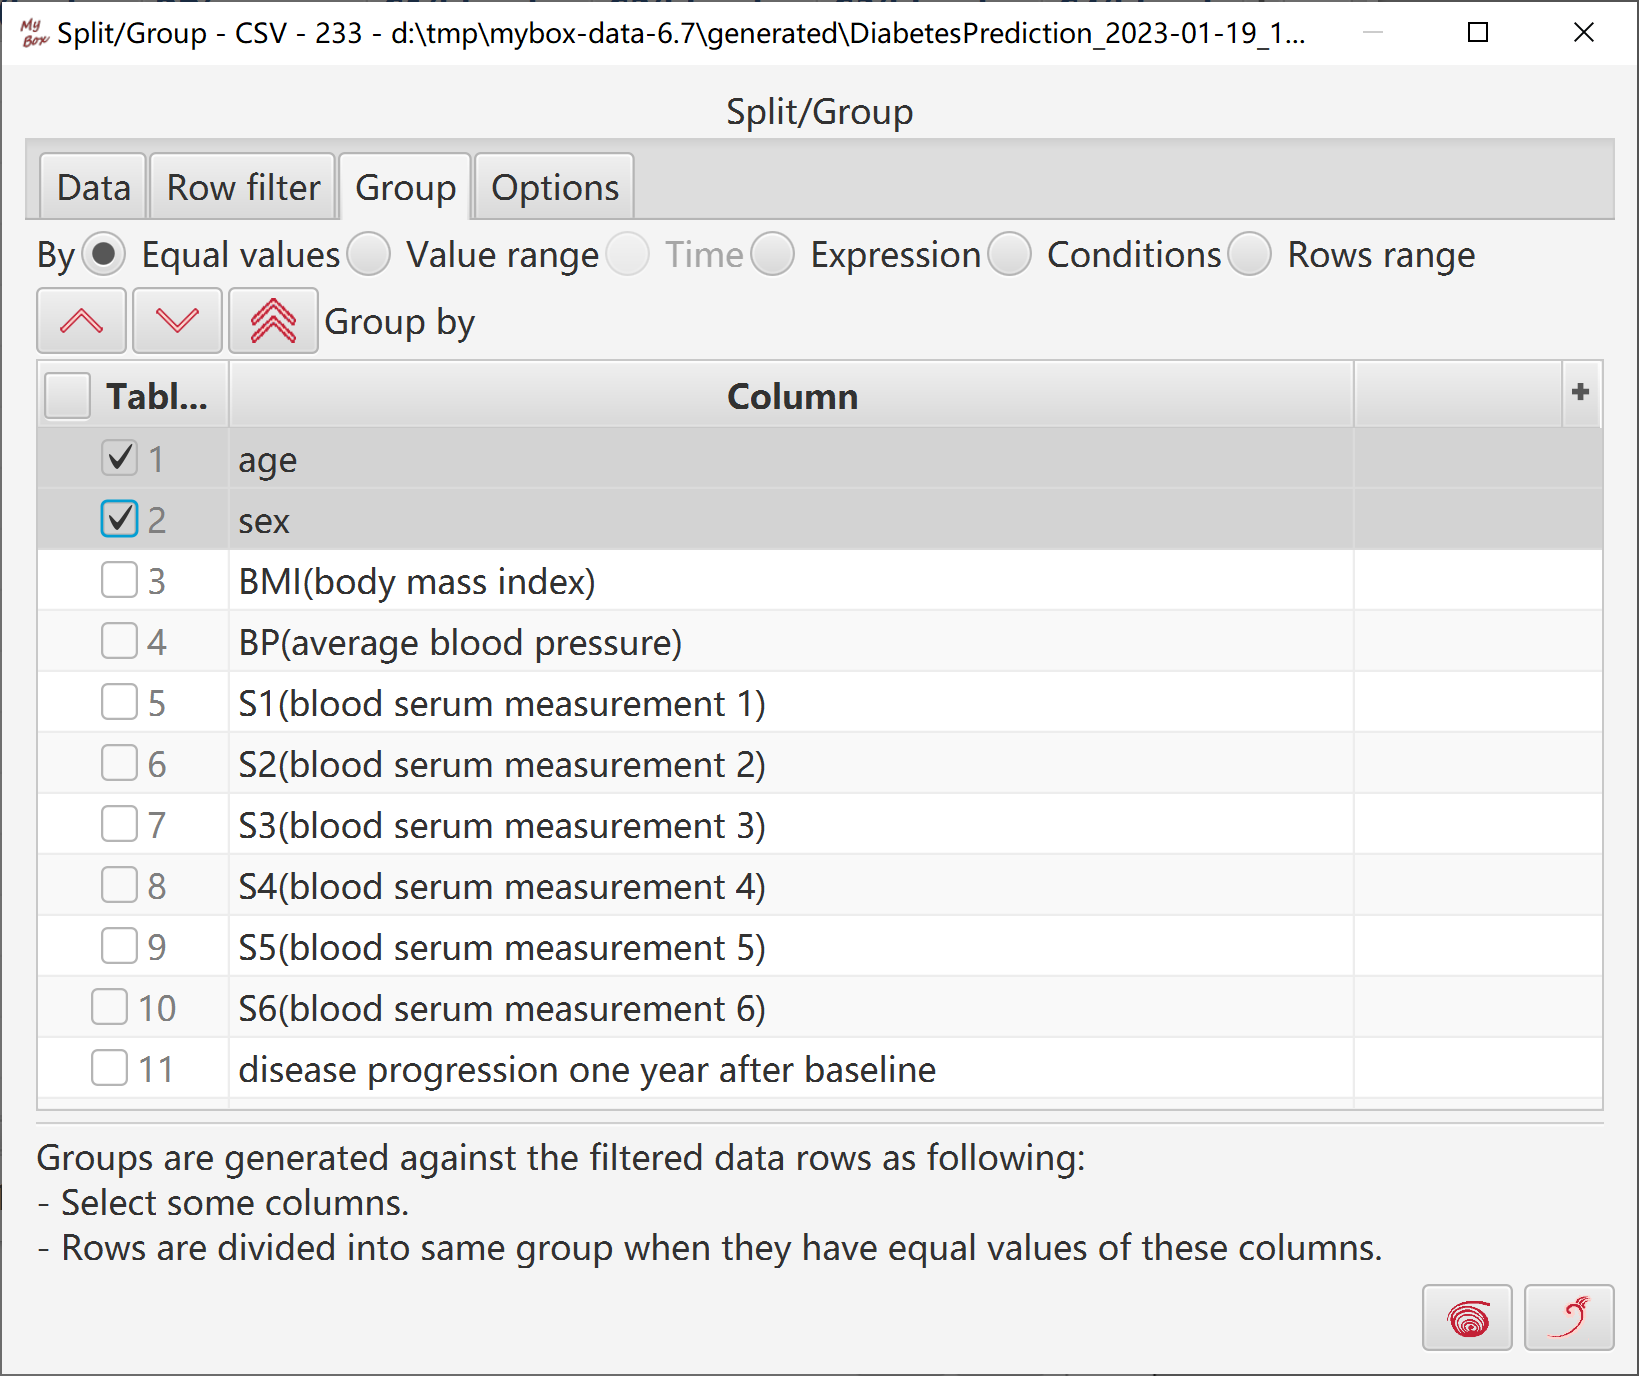
Convert data as a temporary database table
Read each row and group them by equal values of selected columns. The results like executing SQL of “group by”.
Complete: Each row belongs to a group.
Non-intersect: Each row only belongs to one group.
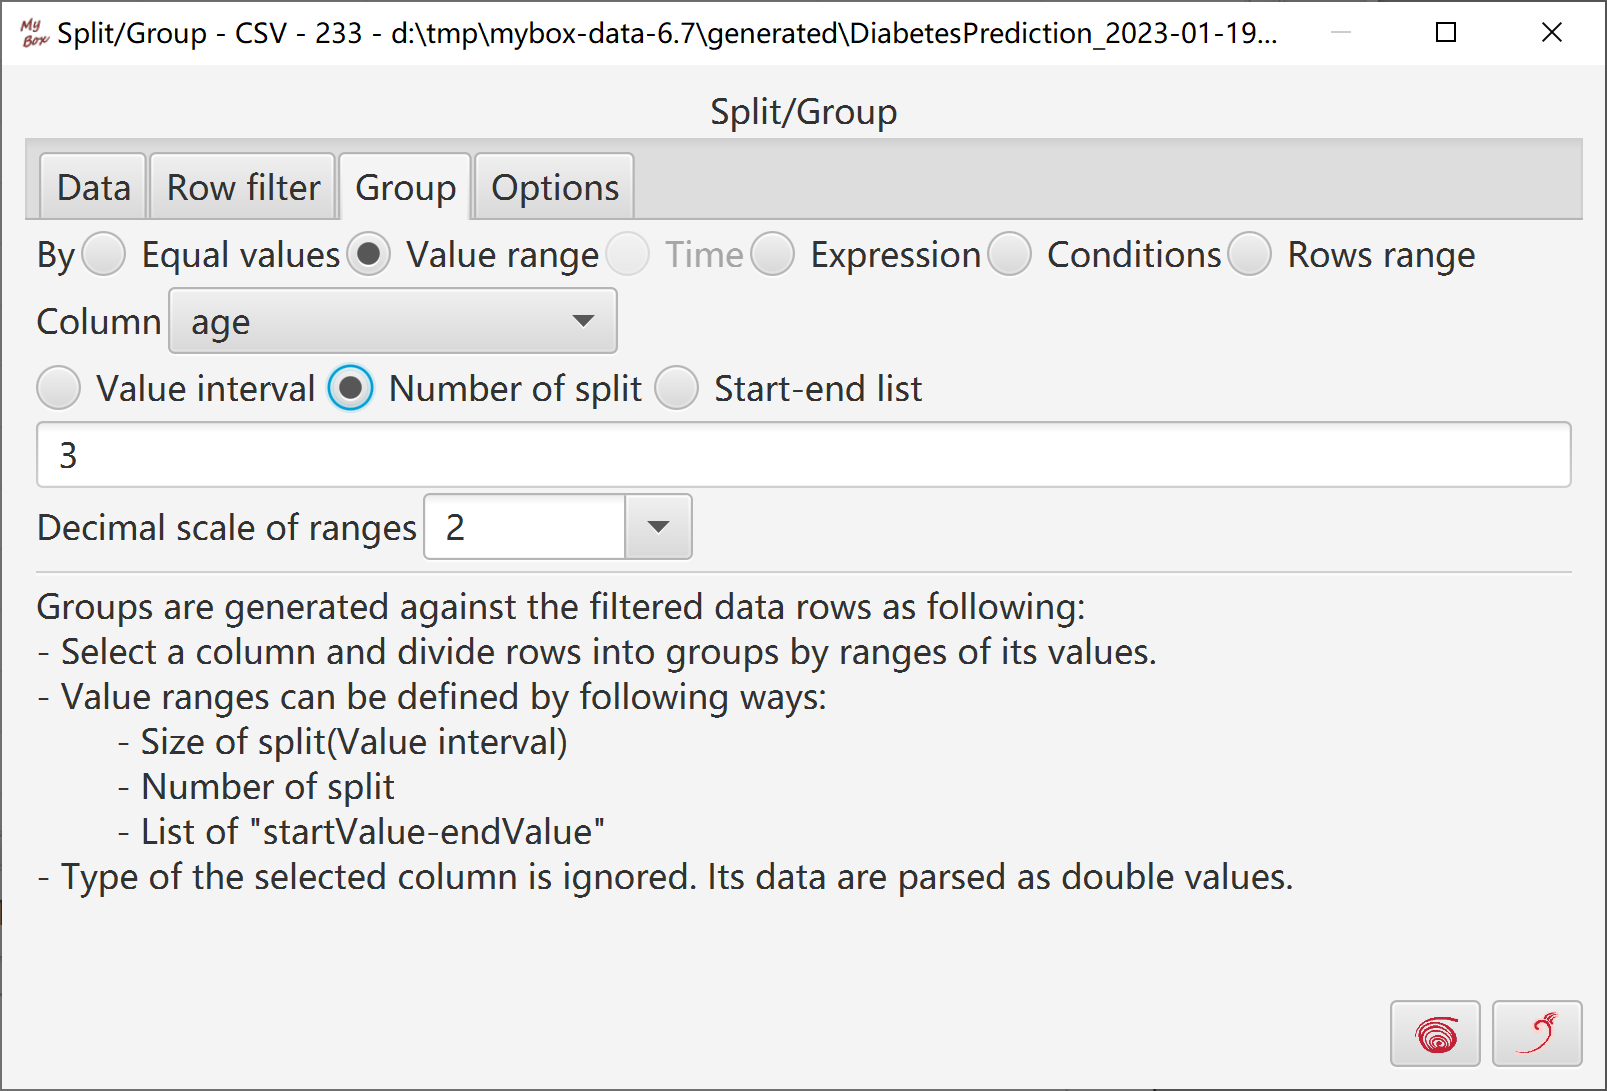
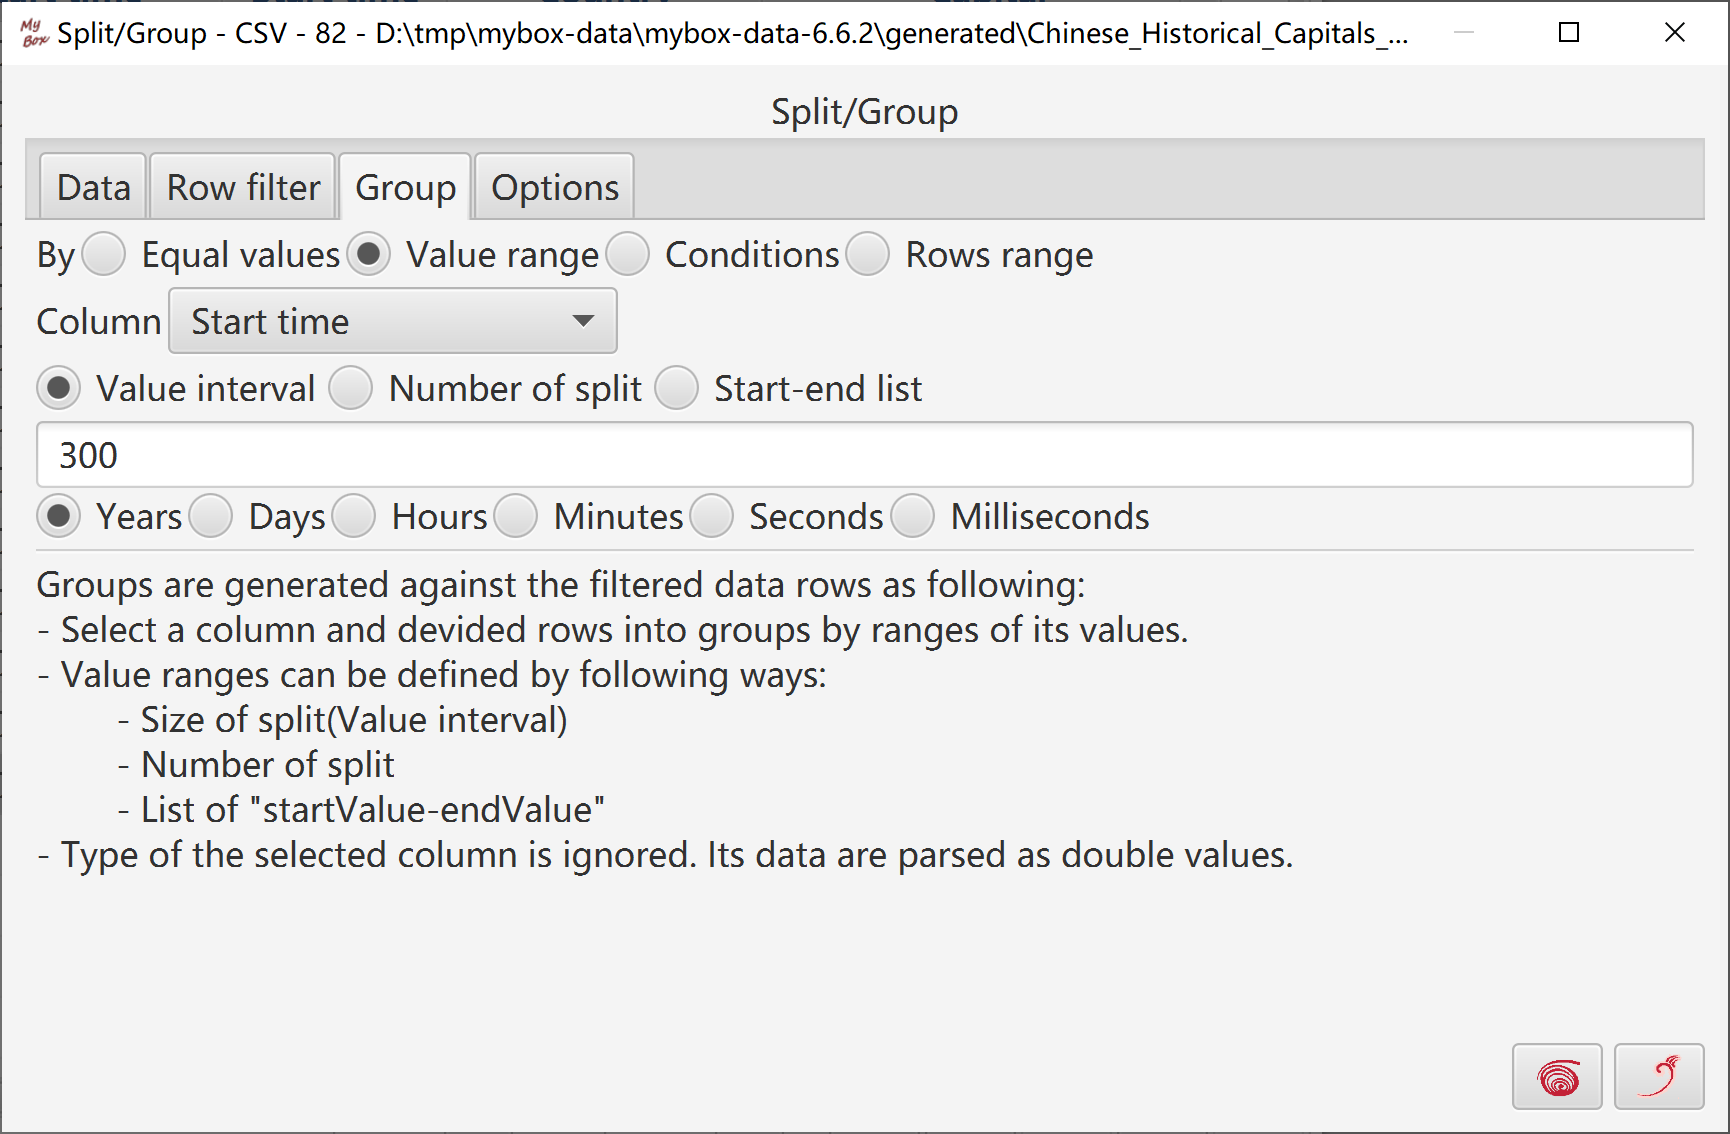
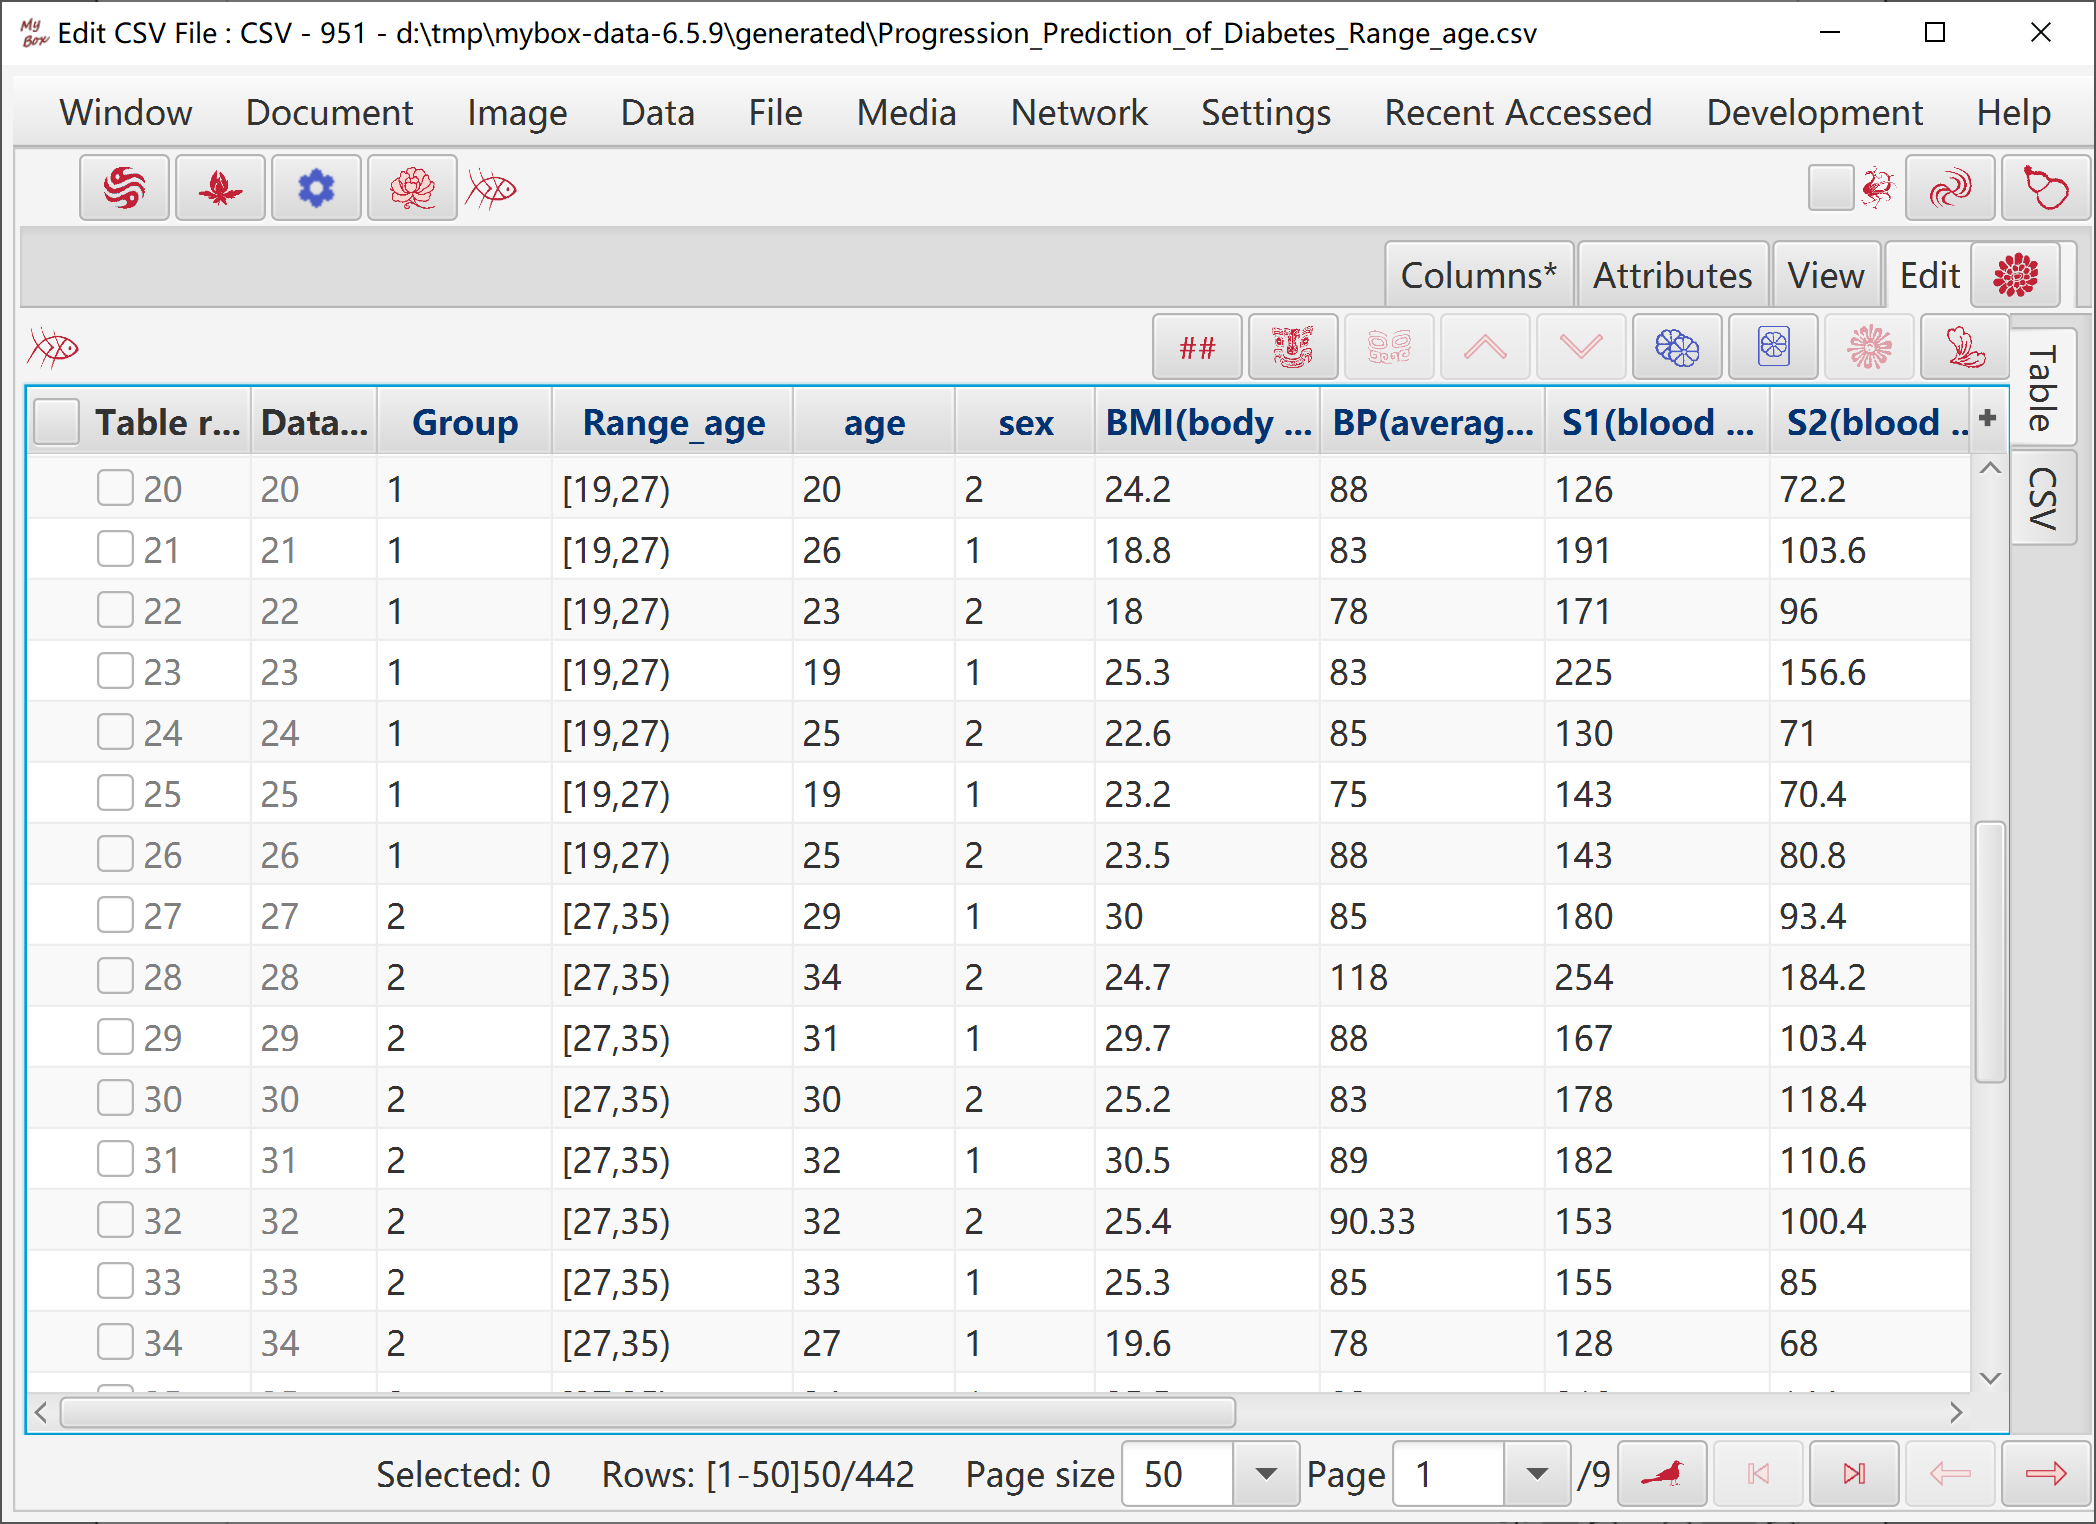
Select one column and divide data by value ranges of this column.
Following 3 selections can be for the split:
Interval of values
Number of split
List of "StartValue-EndValue"
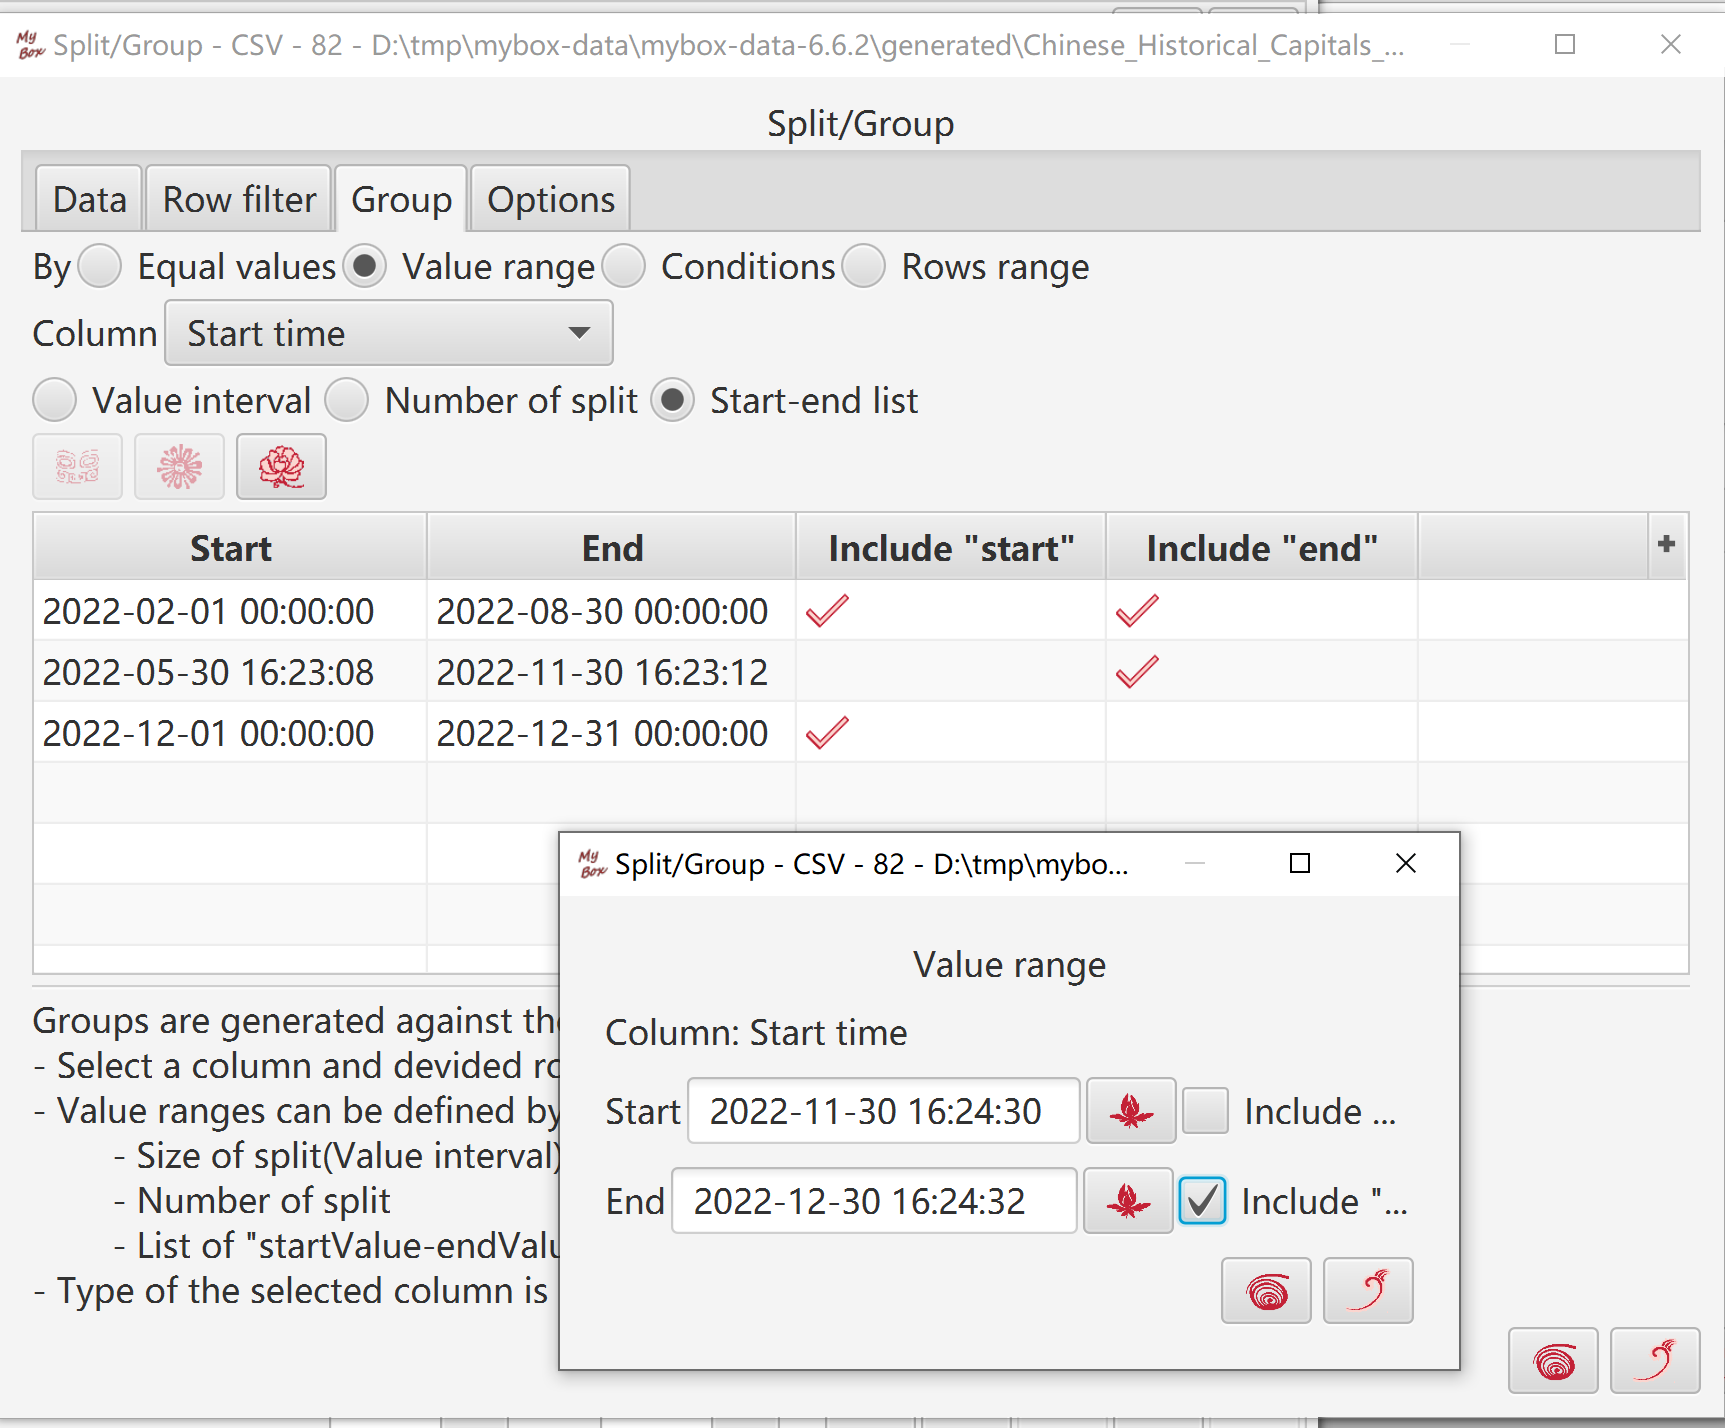
When split rows of date/era:
Values of the column are converted as milliseconds.
Time unit can be set.
For items of “Start-End”, ranges should be in valid formats of date/era.
Add/Delete/Update start-end items in table.
Set whether includes “start”/“end” for “start-end” items.
Convert data as a temporary database table.
Ignore type of selected column, and parse its values as double.
Calcuate maximu value and minimum value of this column.
Count ranges of each group.
Compose query statements for each group. The conditions are like “column-name >= start-value-of-range AND column-name < end-value-of-range”.
If split as size or number, then:
Complete: Each row belongs to a group.
Non-intersect: Each row only belongs to one group.
If split as start-end list, then:
Possible incomplete: Some rows may not belong to any group.
Possible intersect: Some rows may belongs to several groups.
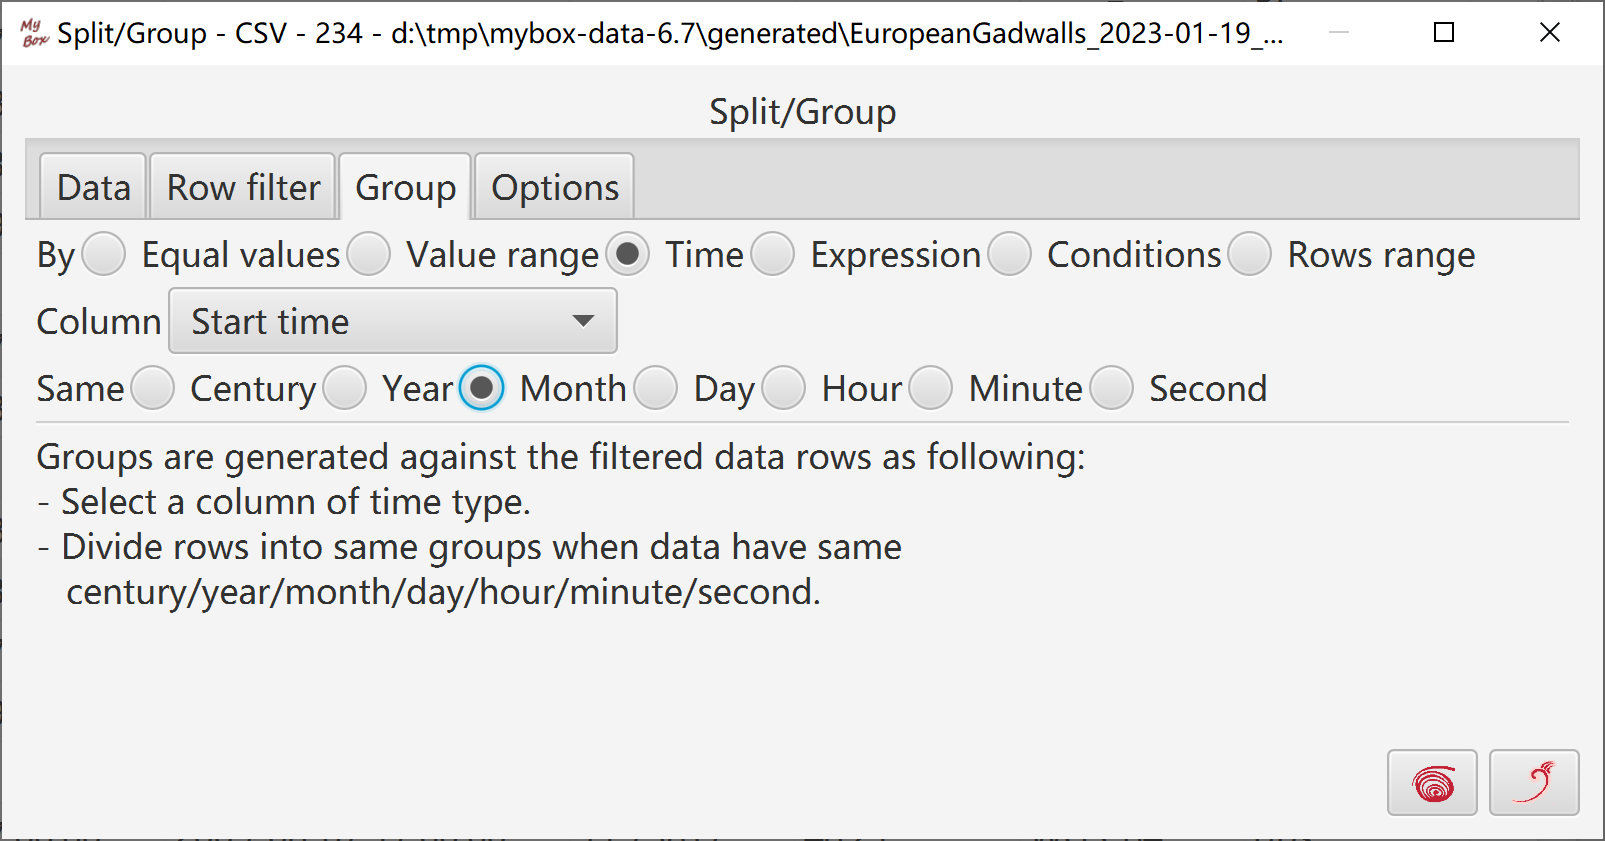
Only when data include date/time columns, this way can be taken:
Select a column of date/time type.
Select time unit: century/year/month/day/hour/minute/second.
Examples:
When time unit is “century”, data are calculated to get century values and grouped by them.
When time unit is “month”, data are divided as same groups when they have same values of year and month.
When time unit is “hour”, data are divided as same groups when they have same values of year, month, day, and hour.
When time unit is “second”, data are divided as same groups when they have same values of year, month, day, hour, minute, and second.
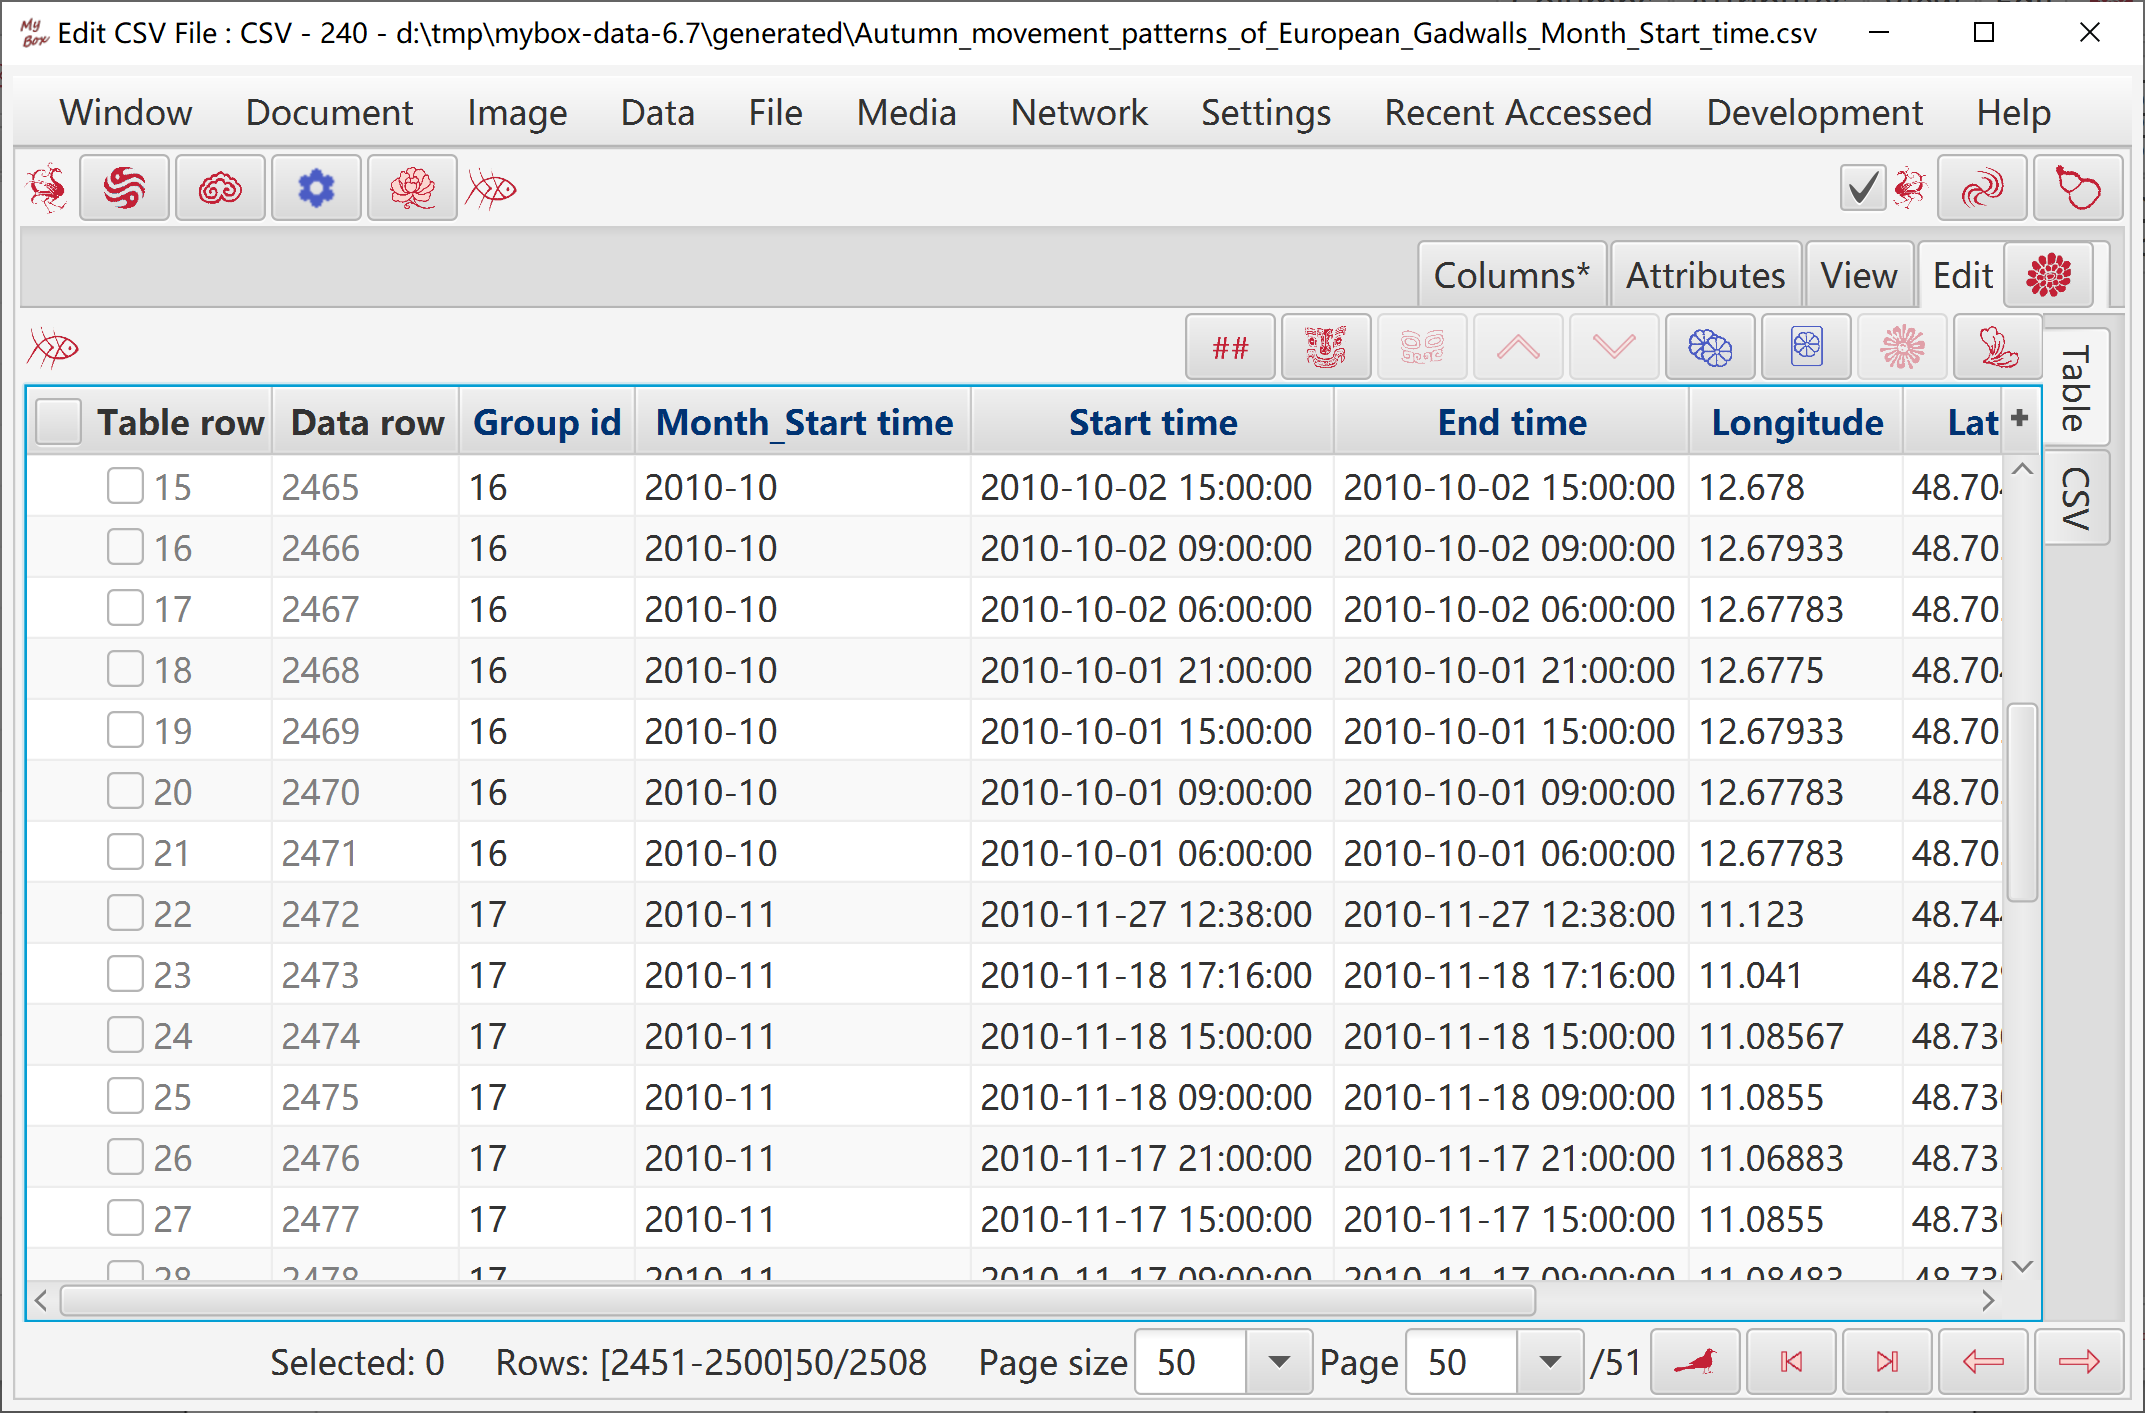
Convert data as a temporary database table.
As time unit, save values are in same groups.
Complete: Each row belongs to a group.
Non-intersect: Each row only belongs to one group.
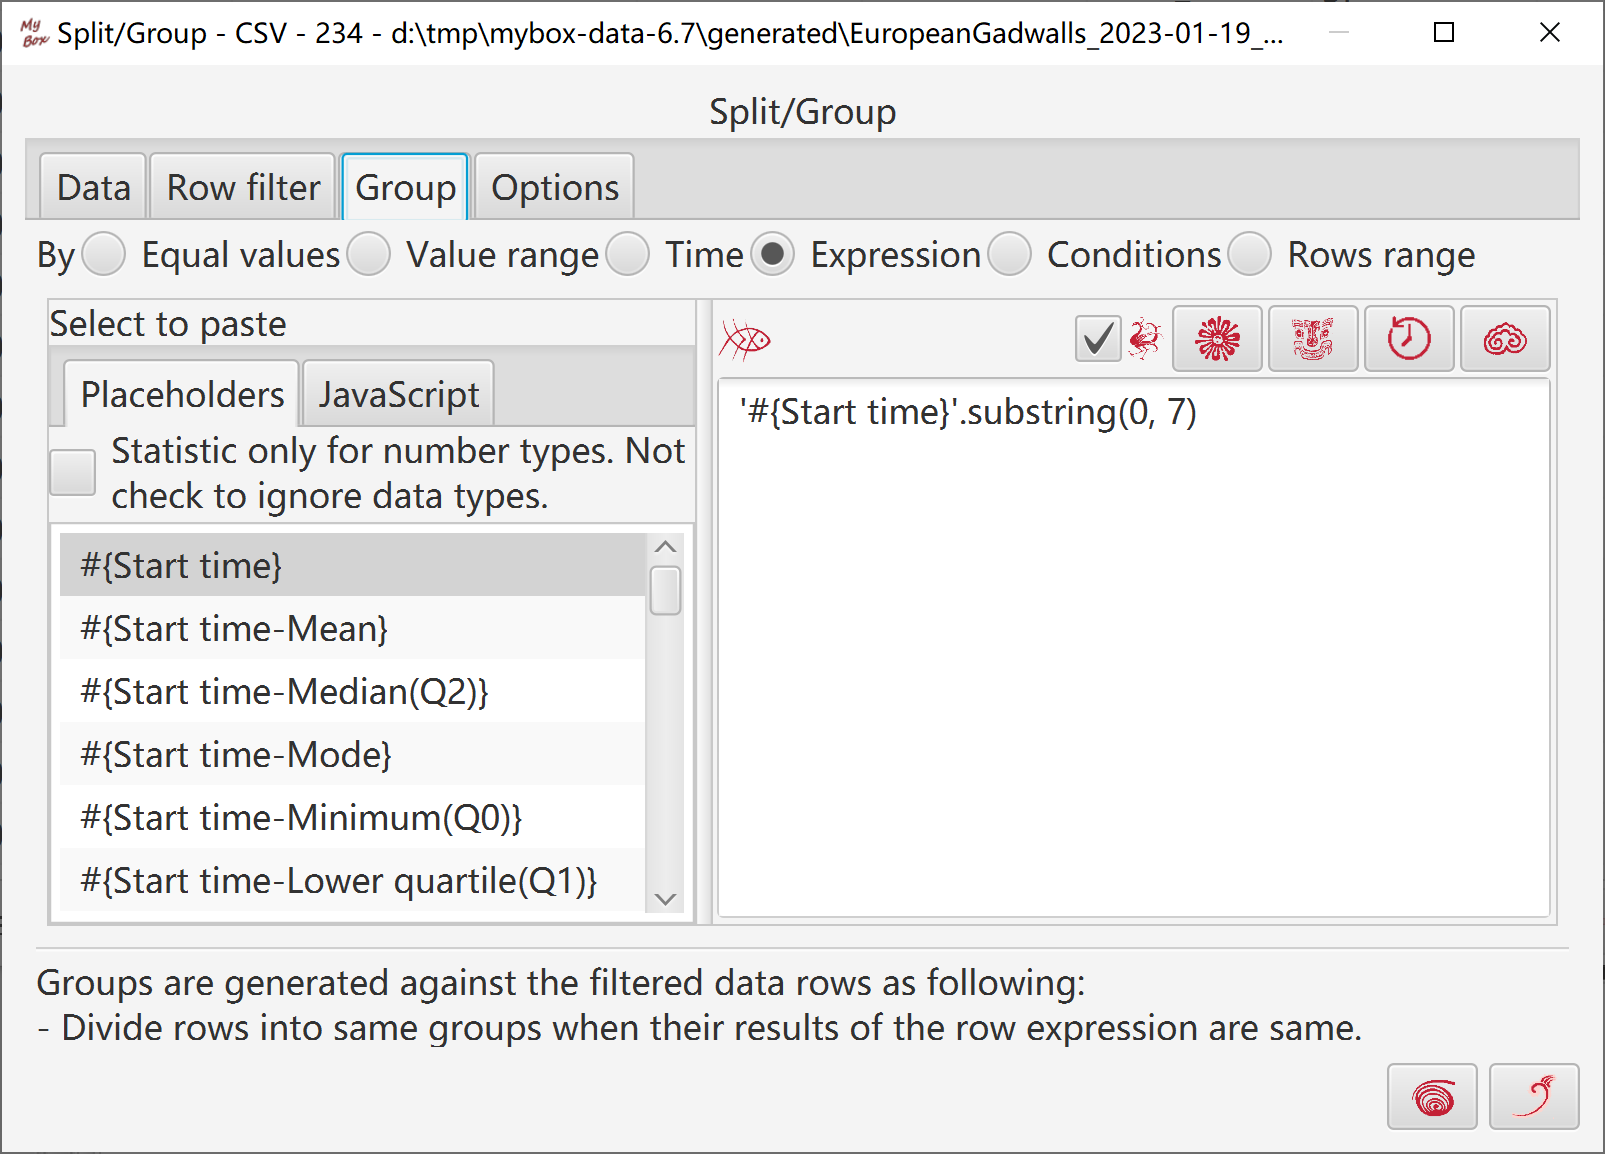
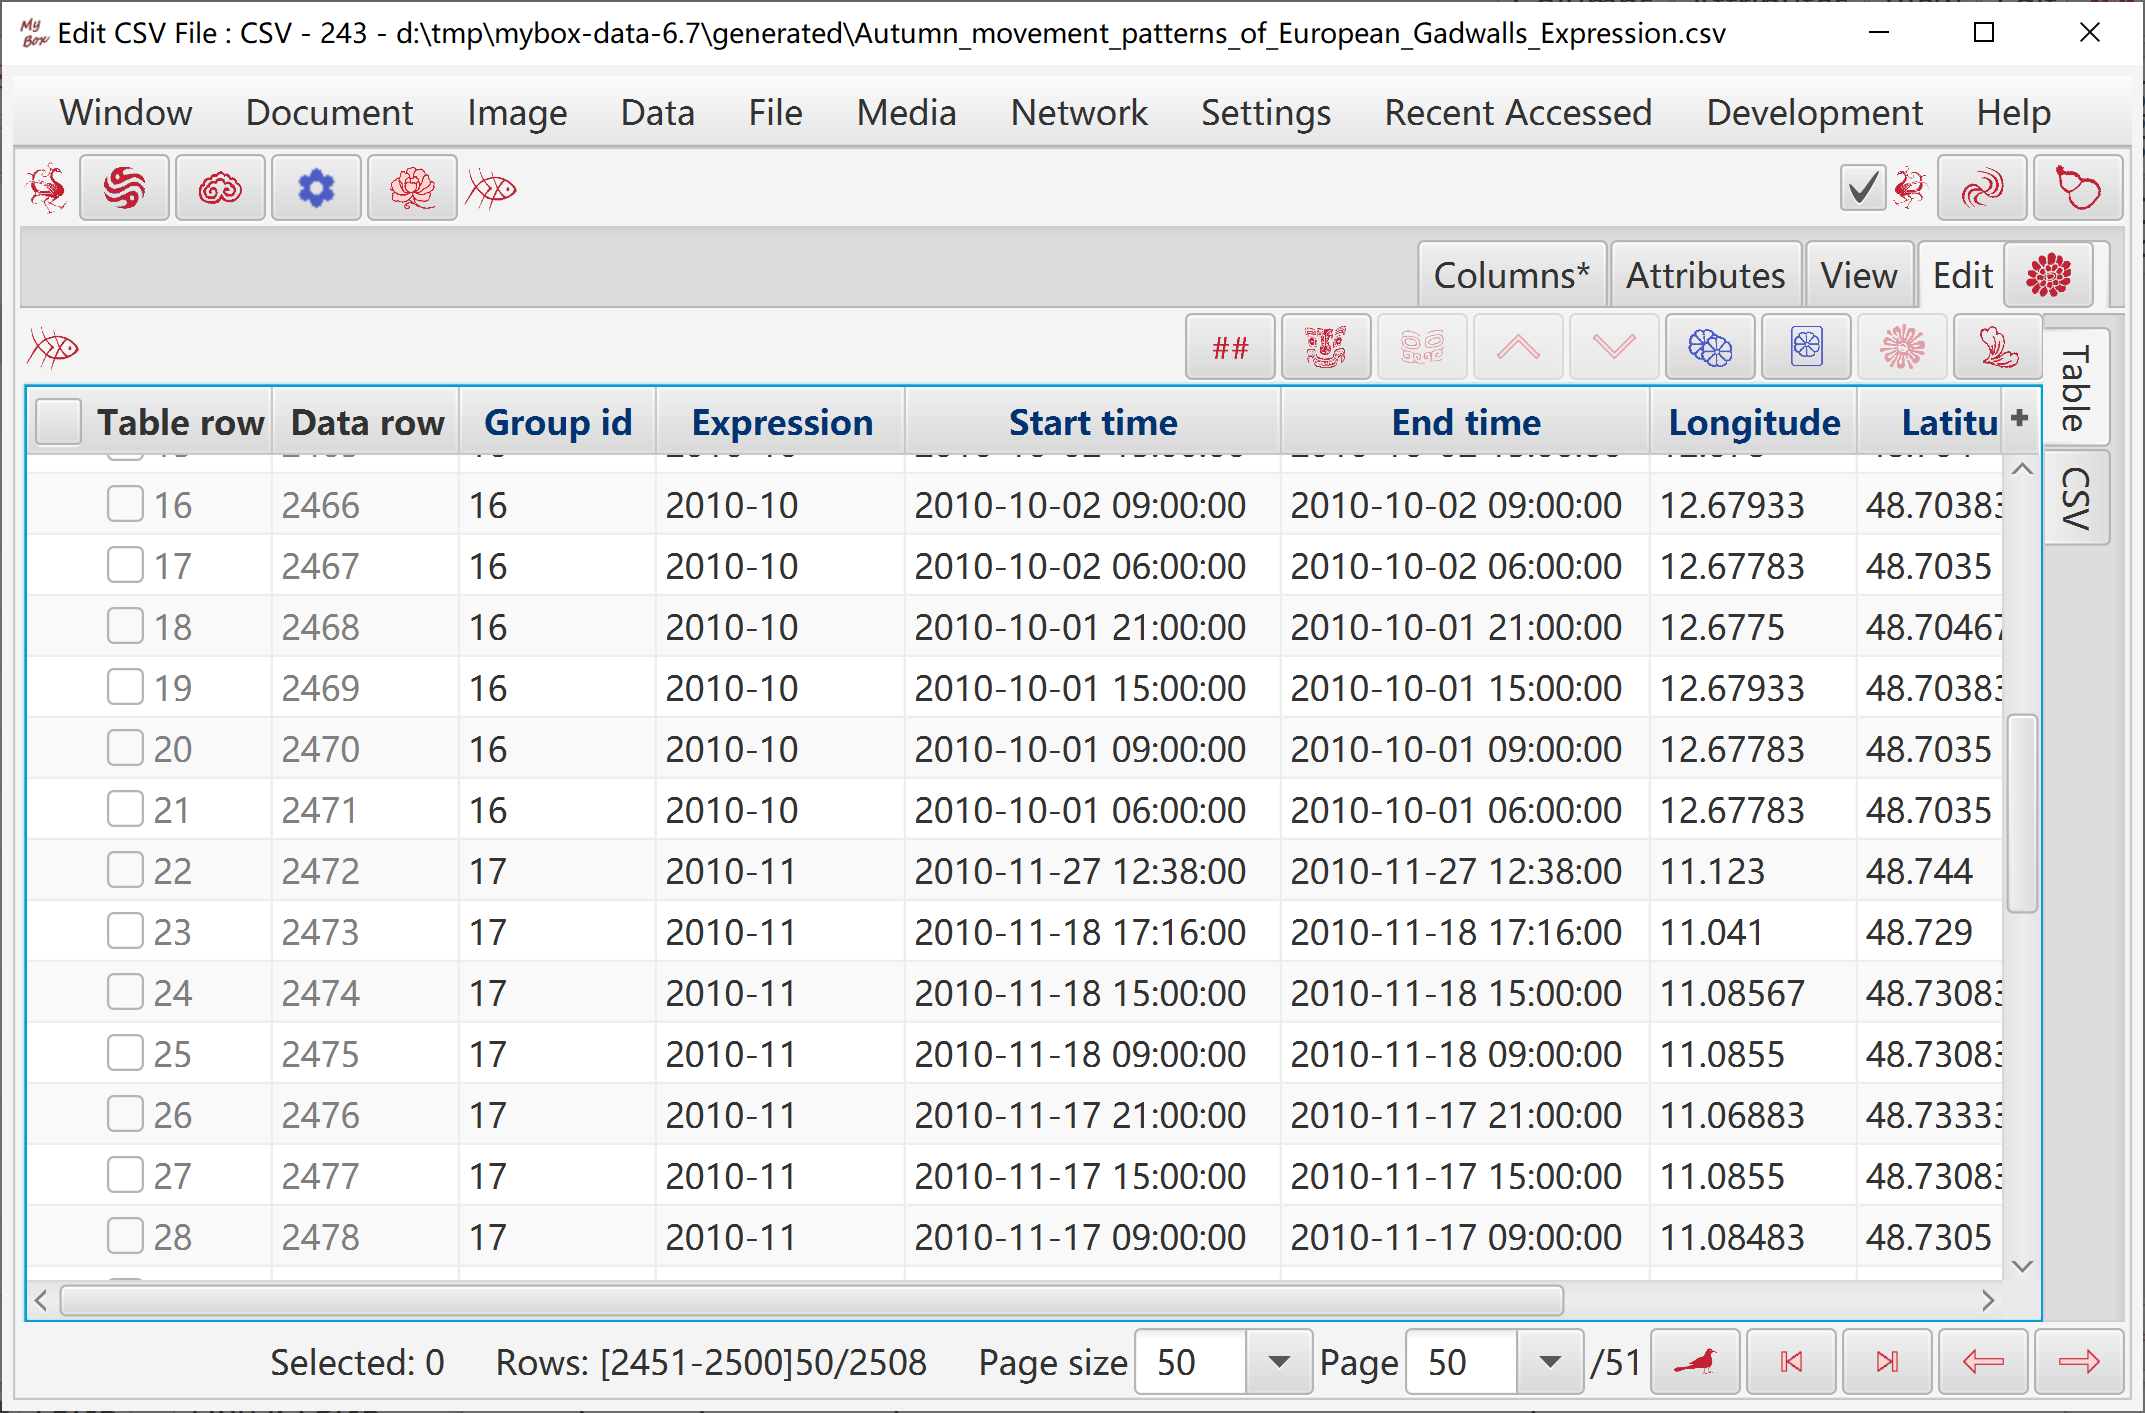
Define a row expresion, and rows are in same groups when they have same values of this expression.
Examples:
Expression “new Date('#{StartTime}').getDay()”, group as the week values of column “StartTime”.
Expression “#{description}'.charAt(2)”, group as the 2th character of column “description”.
Expression “'#{StartTime}'.substring(0, 7)”, group as the first 7 characters of column “StartTime”.
Convert data as a temporary database table.
Calculate the expression against each row, save values are in same groups.
Complete: Each row belongs to a group.
Non-intersect: Each row only belongs to one group.
Define some row filters and data rows are divided in groups by these row filters.
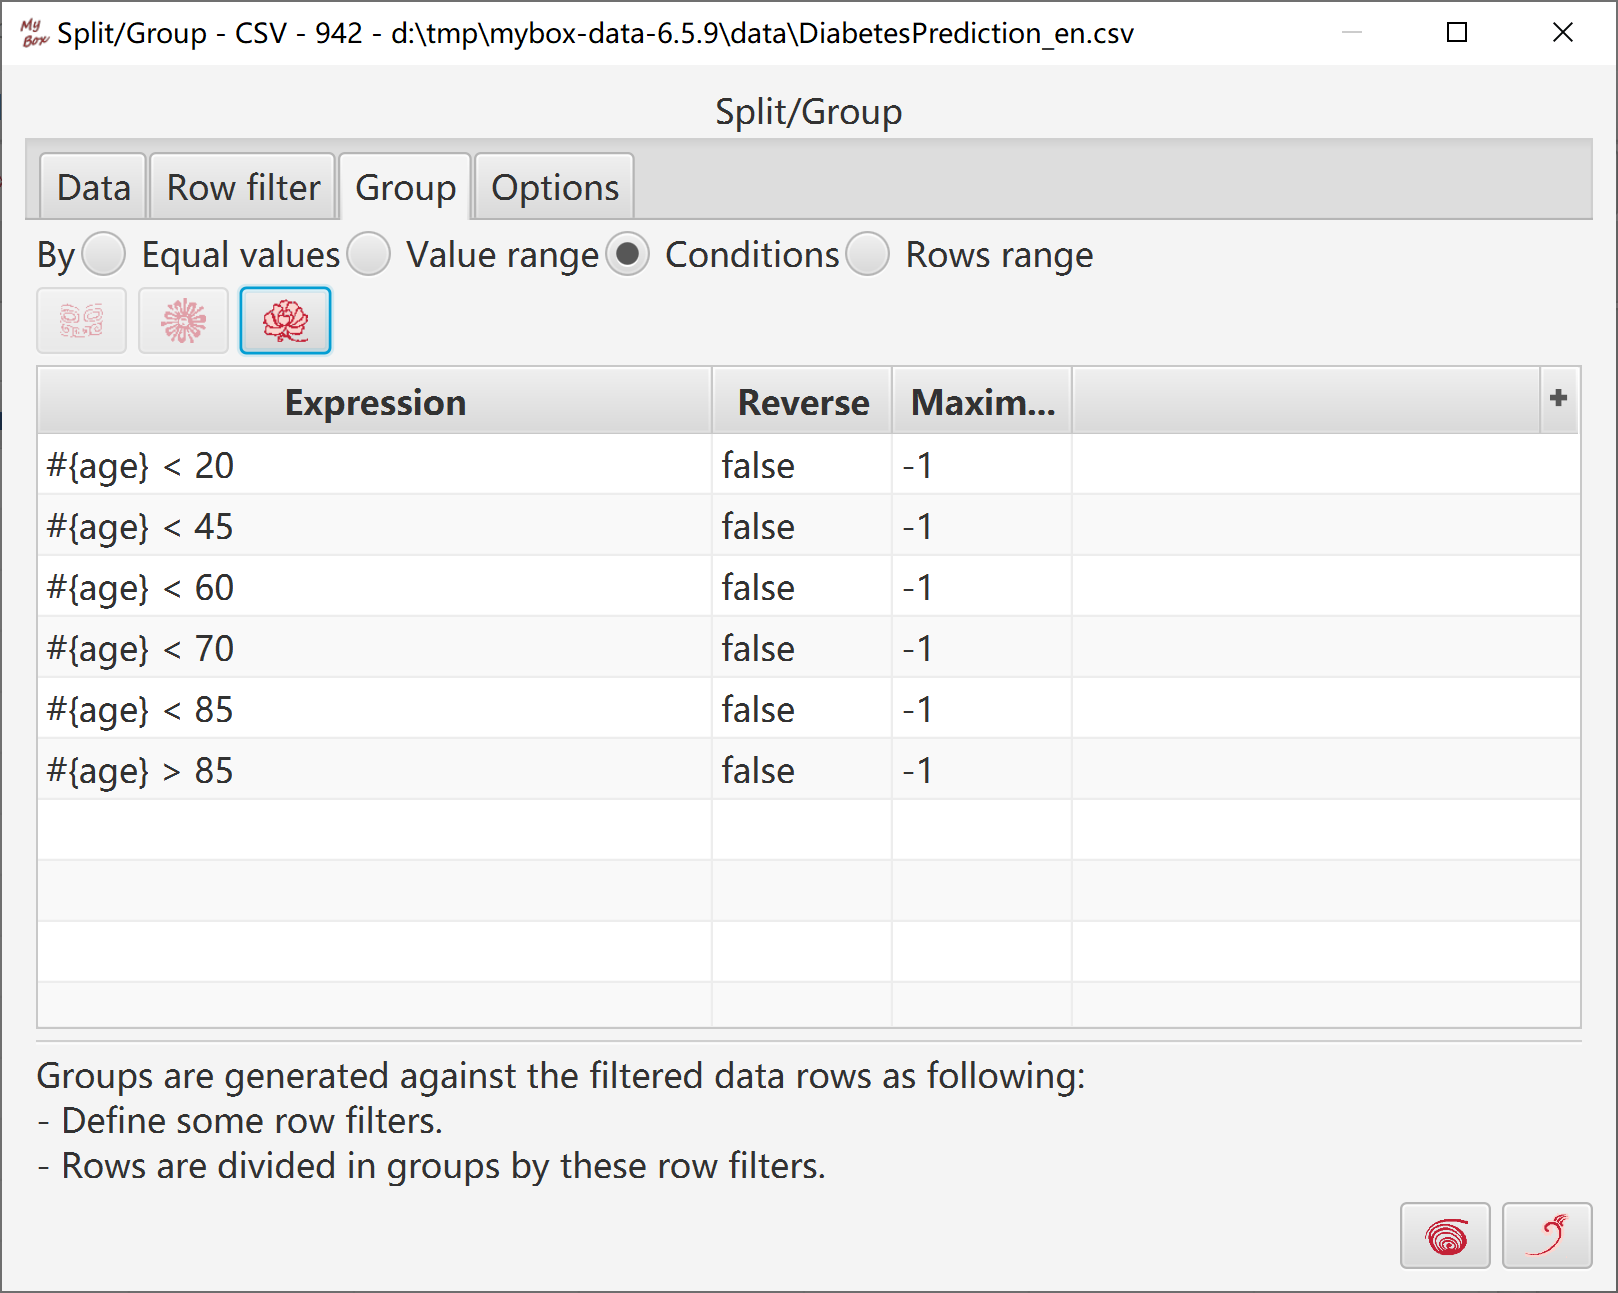
Convert data as a temporary database table.
For each row filter, scan data rows to pick out group members which satisfy condition.
Possible incomplete: Some rows may not belong to any group.
Possible intersect: Some rows may belongs to several groups.
Divide data rows by their row numbers. Following 3 selections can be for the split:
Size of split(interval of row numbers)
Number of split
List of "StartNumber-EndNumber"
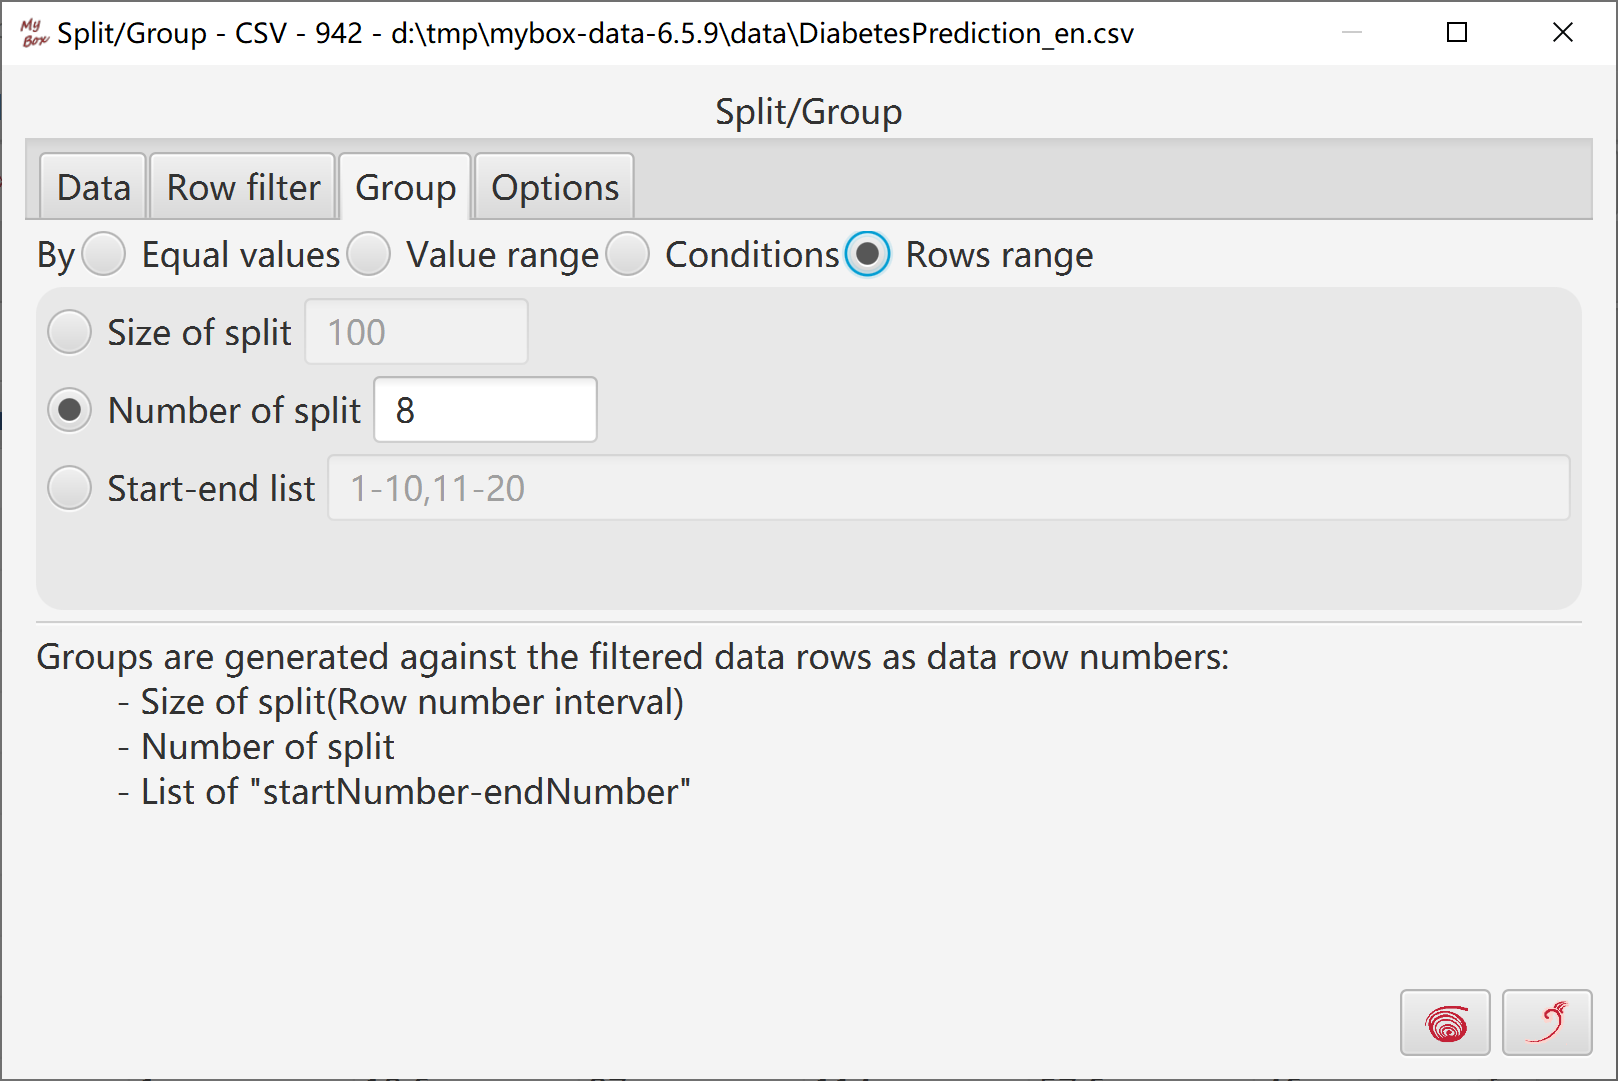
Convert data as a temporary database table.
Count range of row numbers for each group.
Scan data rows, and set groups as row numbers.
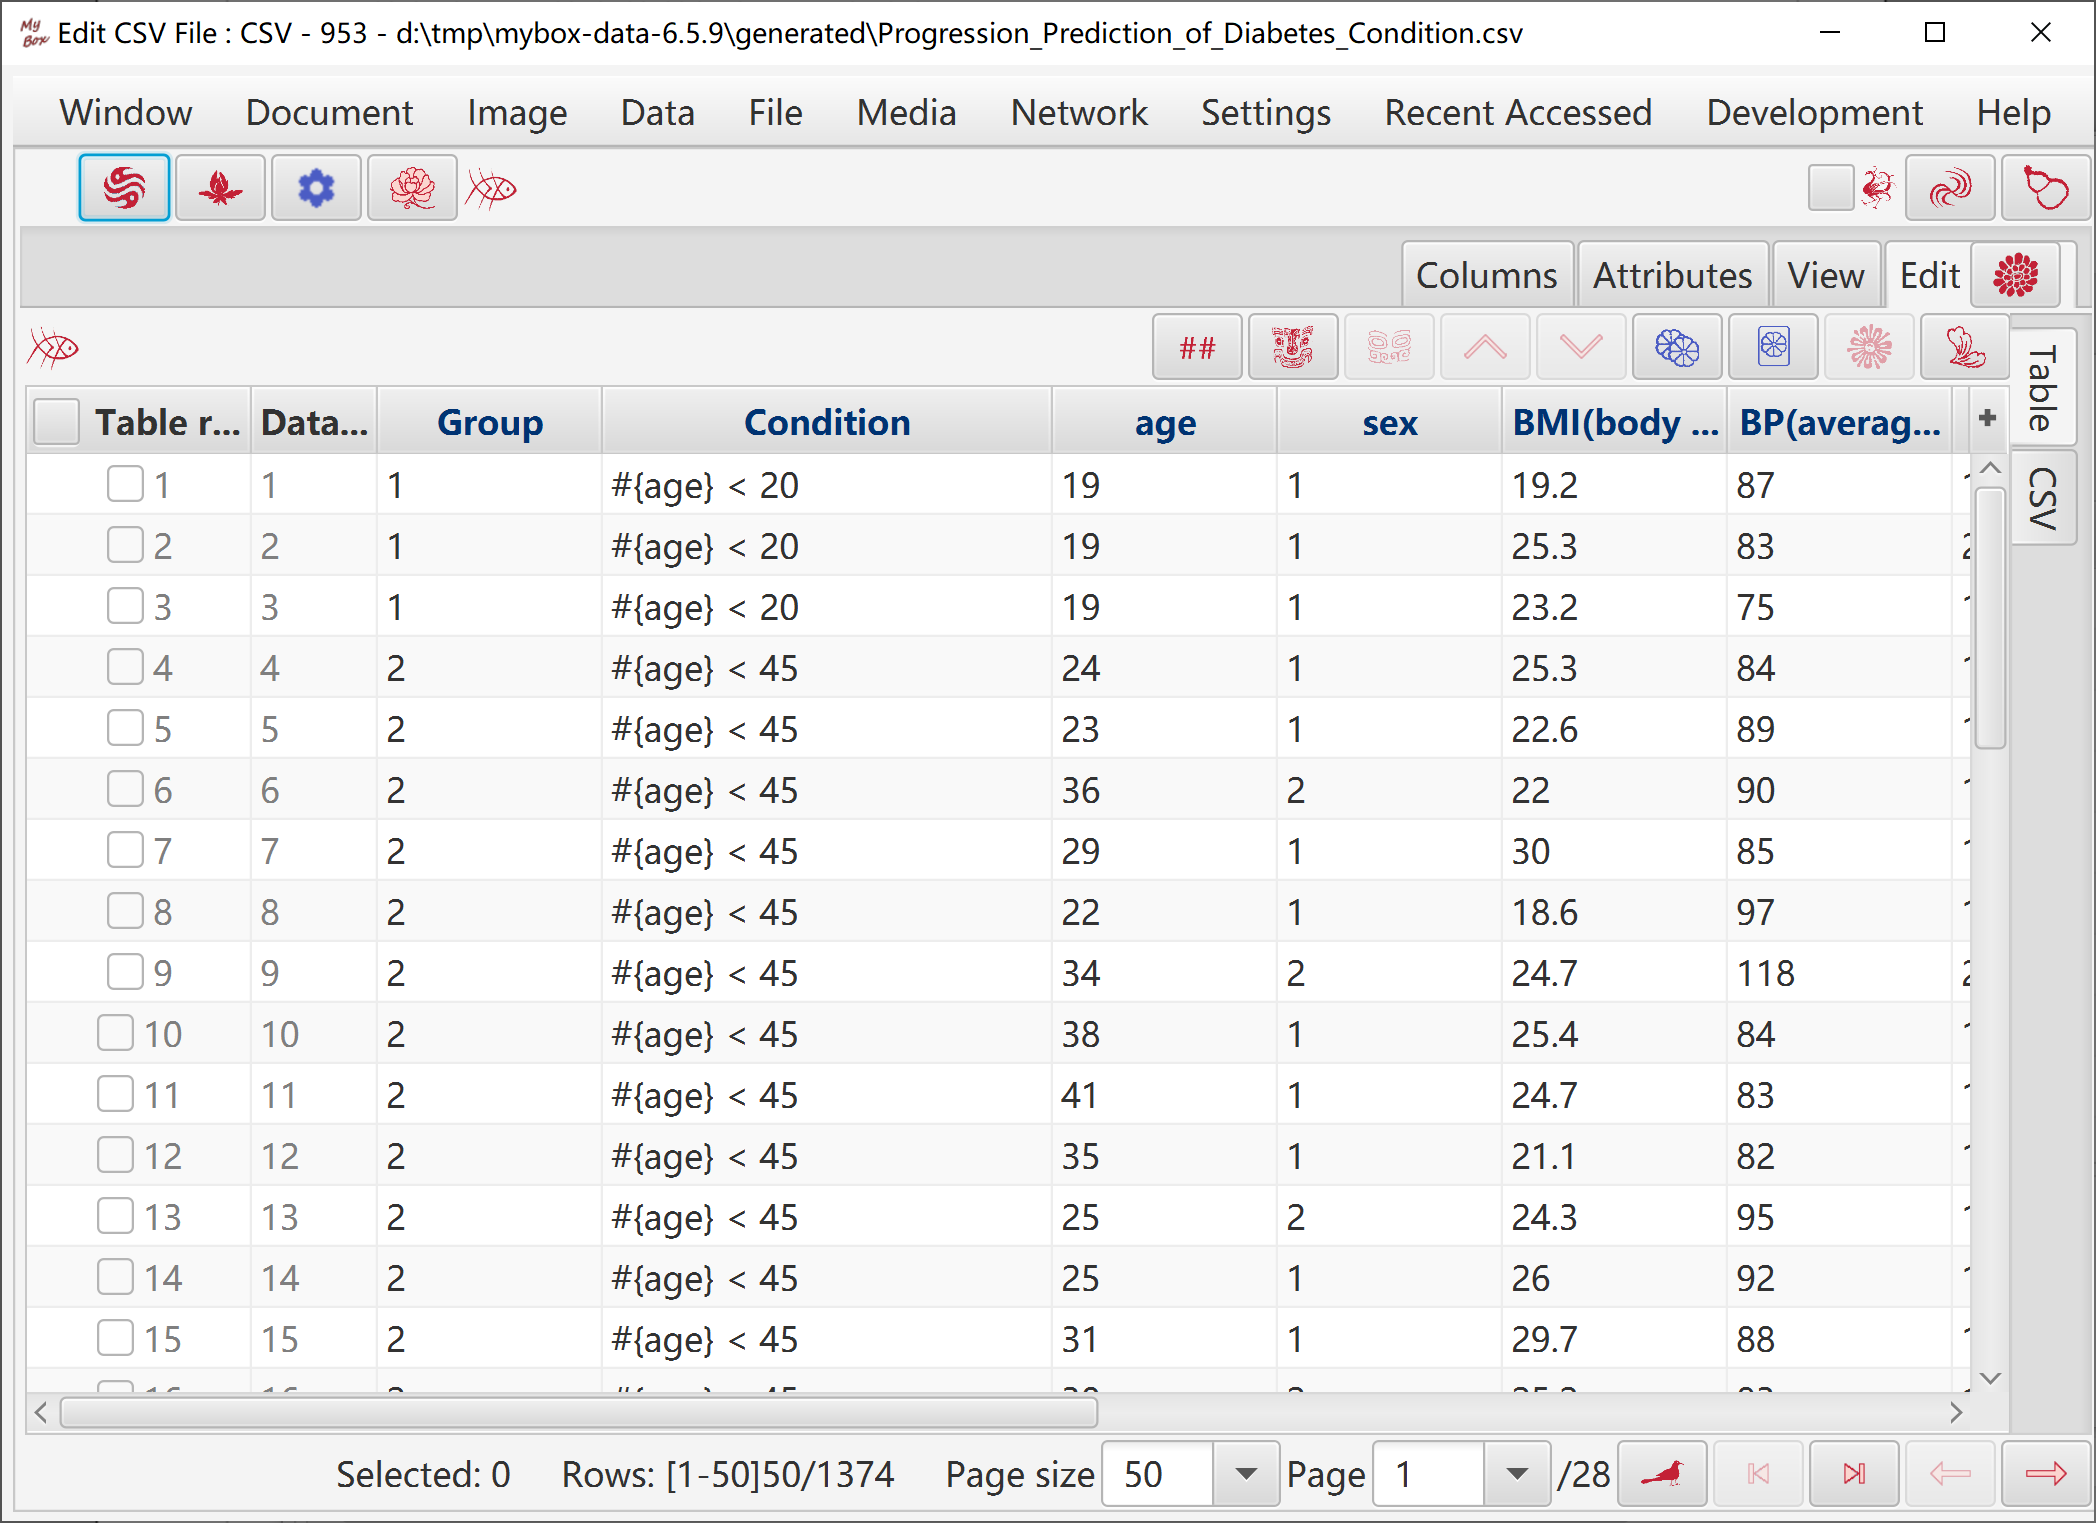
If split as size or number, then:
Complete: Each row belongs to a group.
Non-intersect: Each row only belongs to one group.
If split as start-end list, then:
Possible incomplete: Some rows may not belong to any group.
Possible intersect: Some rows may belongs to several groups.
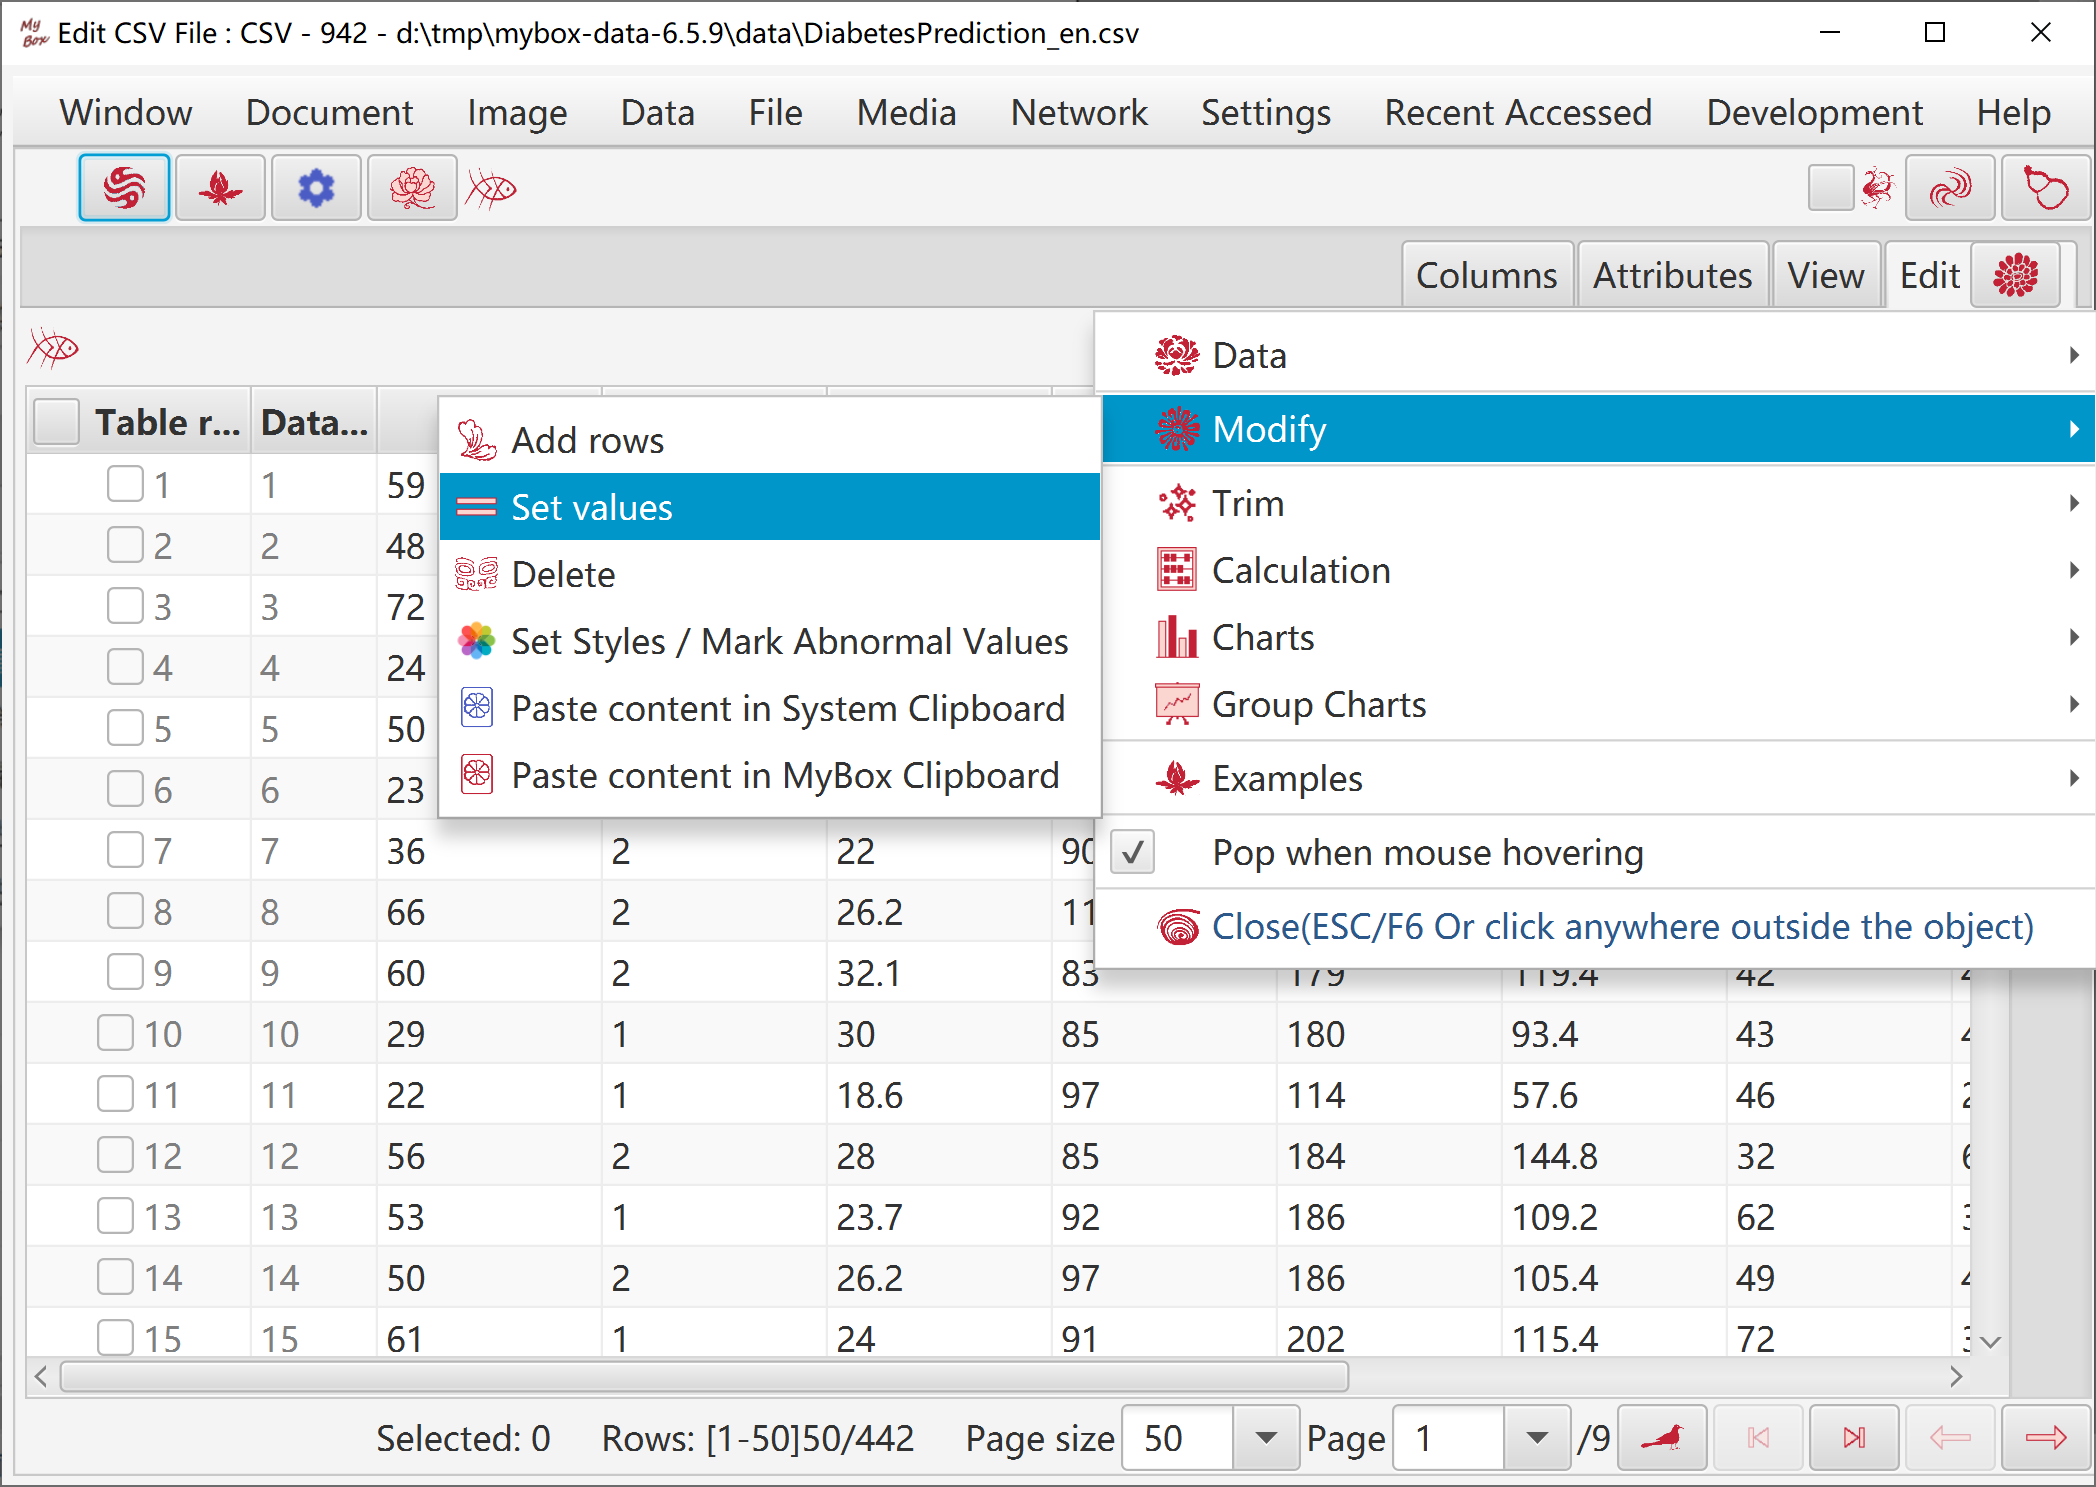
Hover or click button “Function” to select functions under menu item “Modify”.
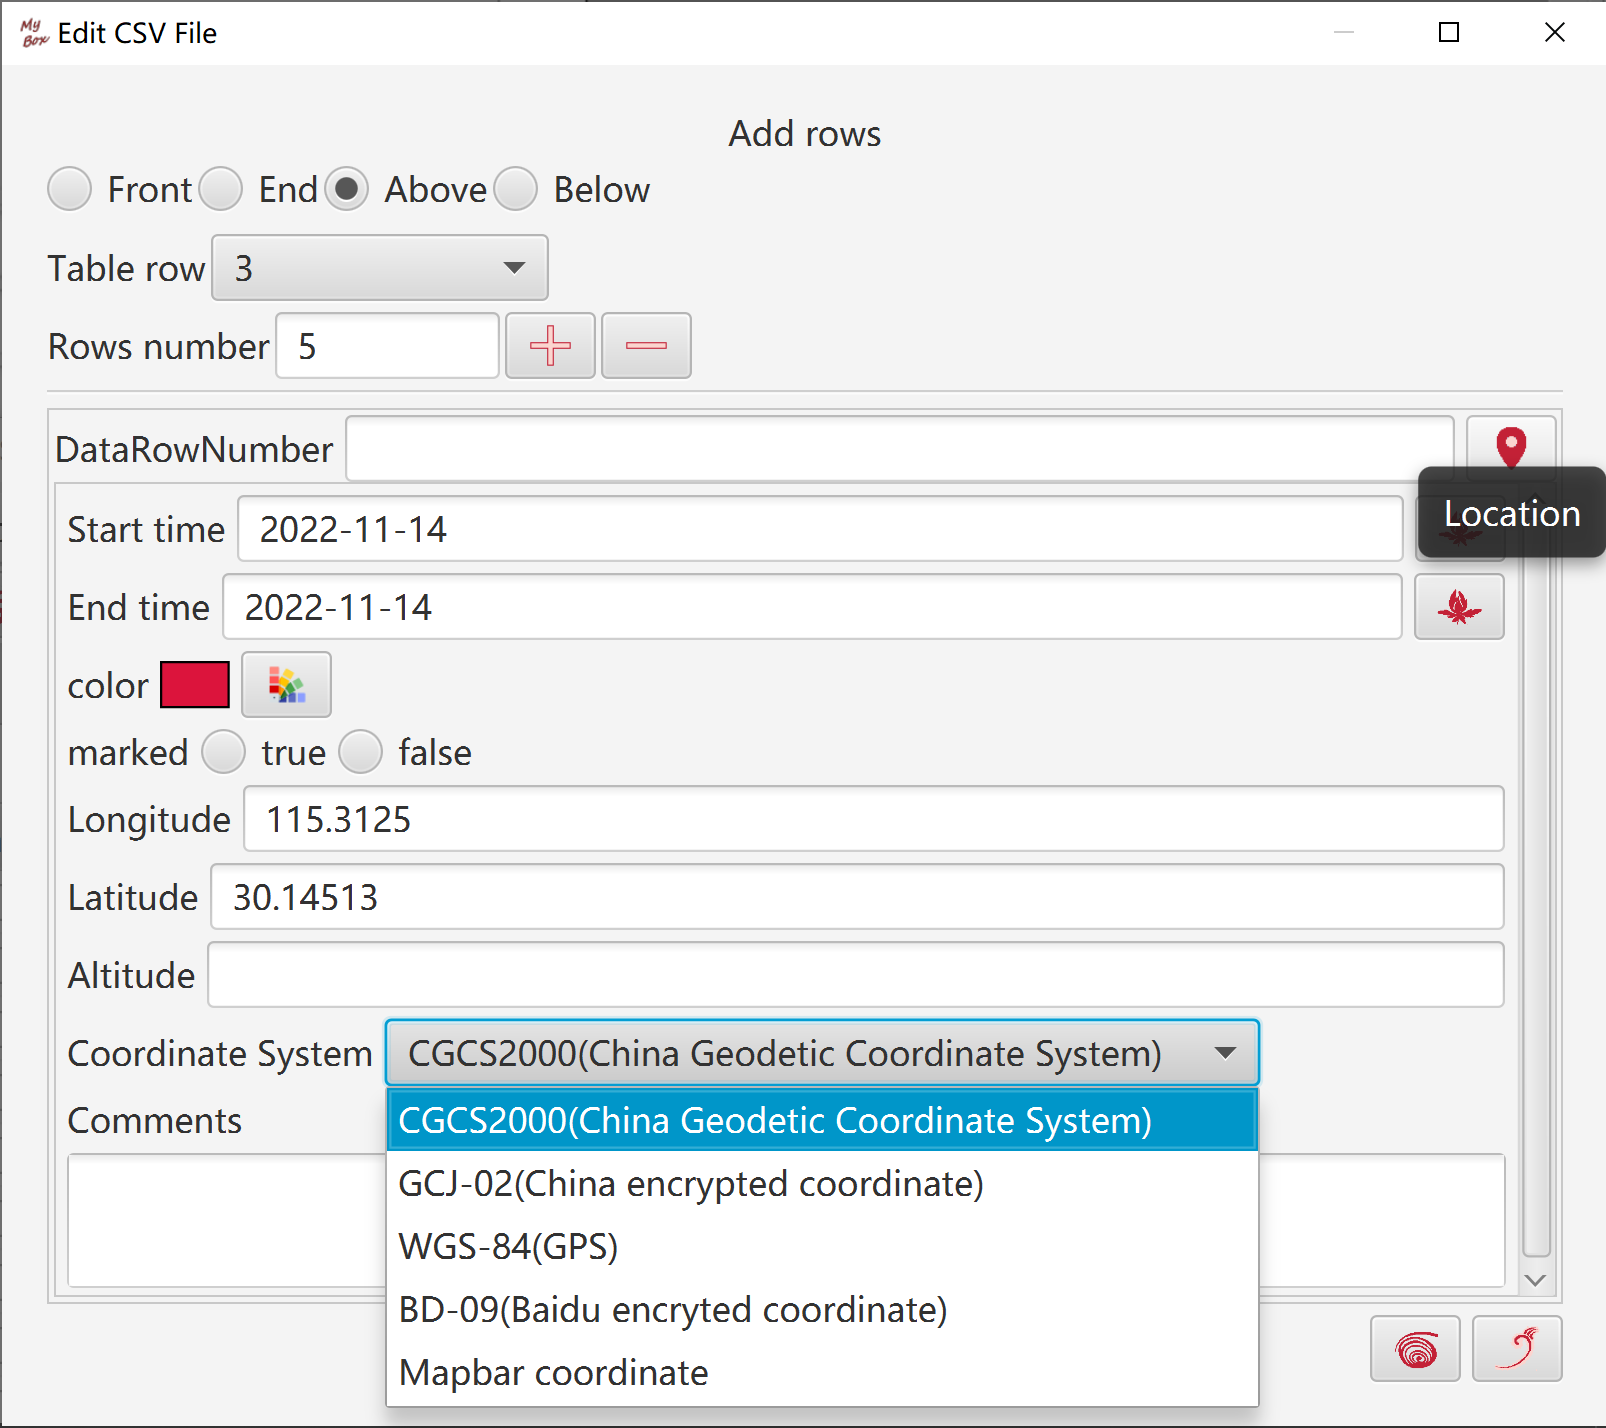
Select where to add new rows: Front, End, Above some row, Below some row.
Set rows numberto be added.
Set values for new rows. Edit controls are provided as types of columns:
If data contains both Longitude and Latitude, display button “Location”.
For datetime, date, or era, display button “Example”.
For boolean, display selection buttons.
For enumeration, display value list.
For color, display button “Color”.
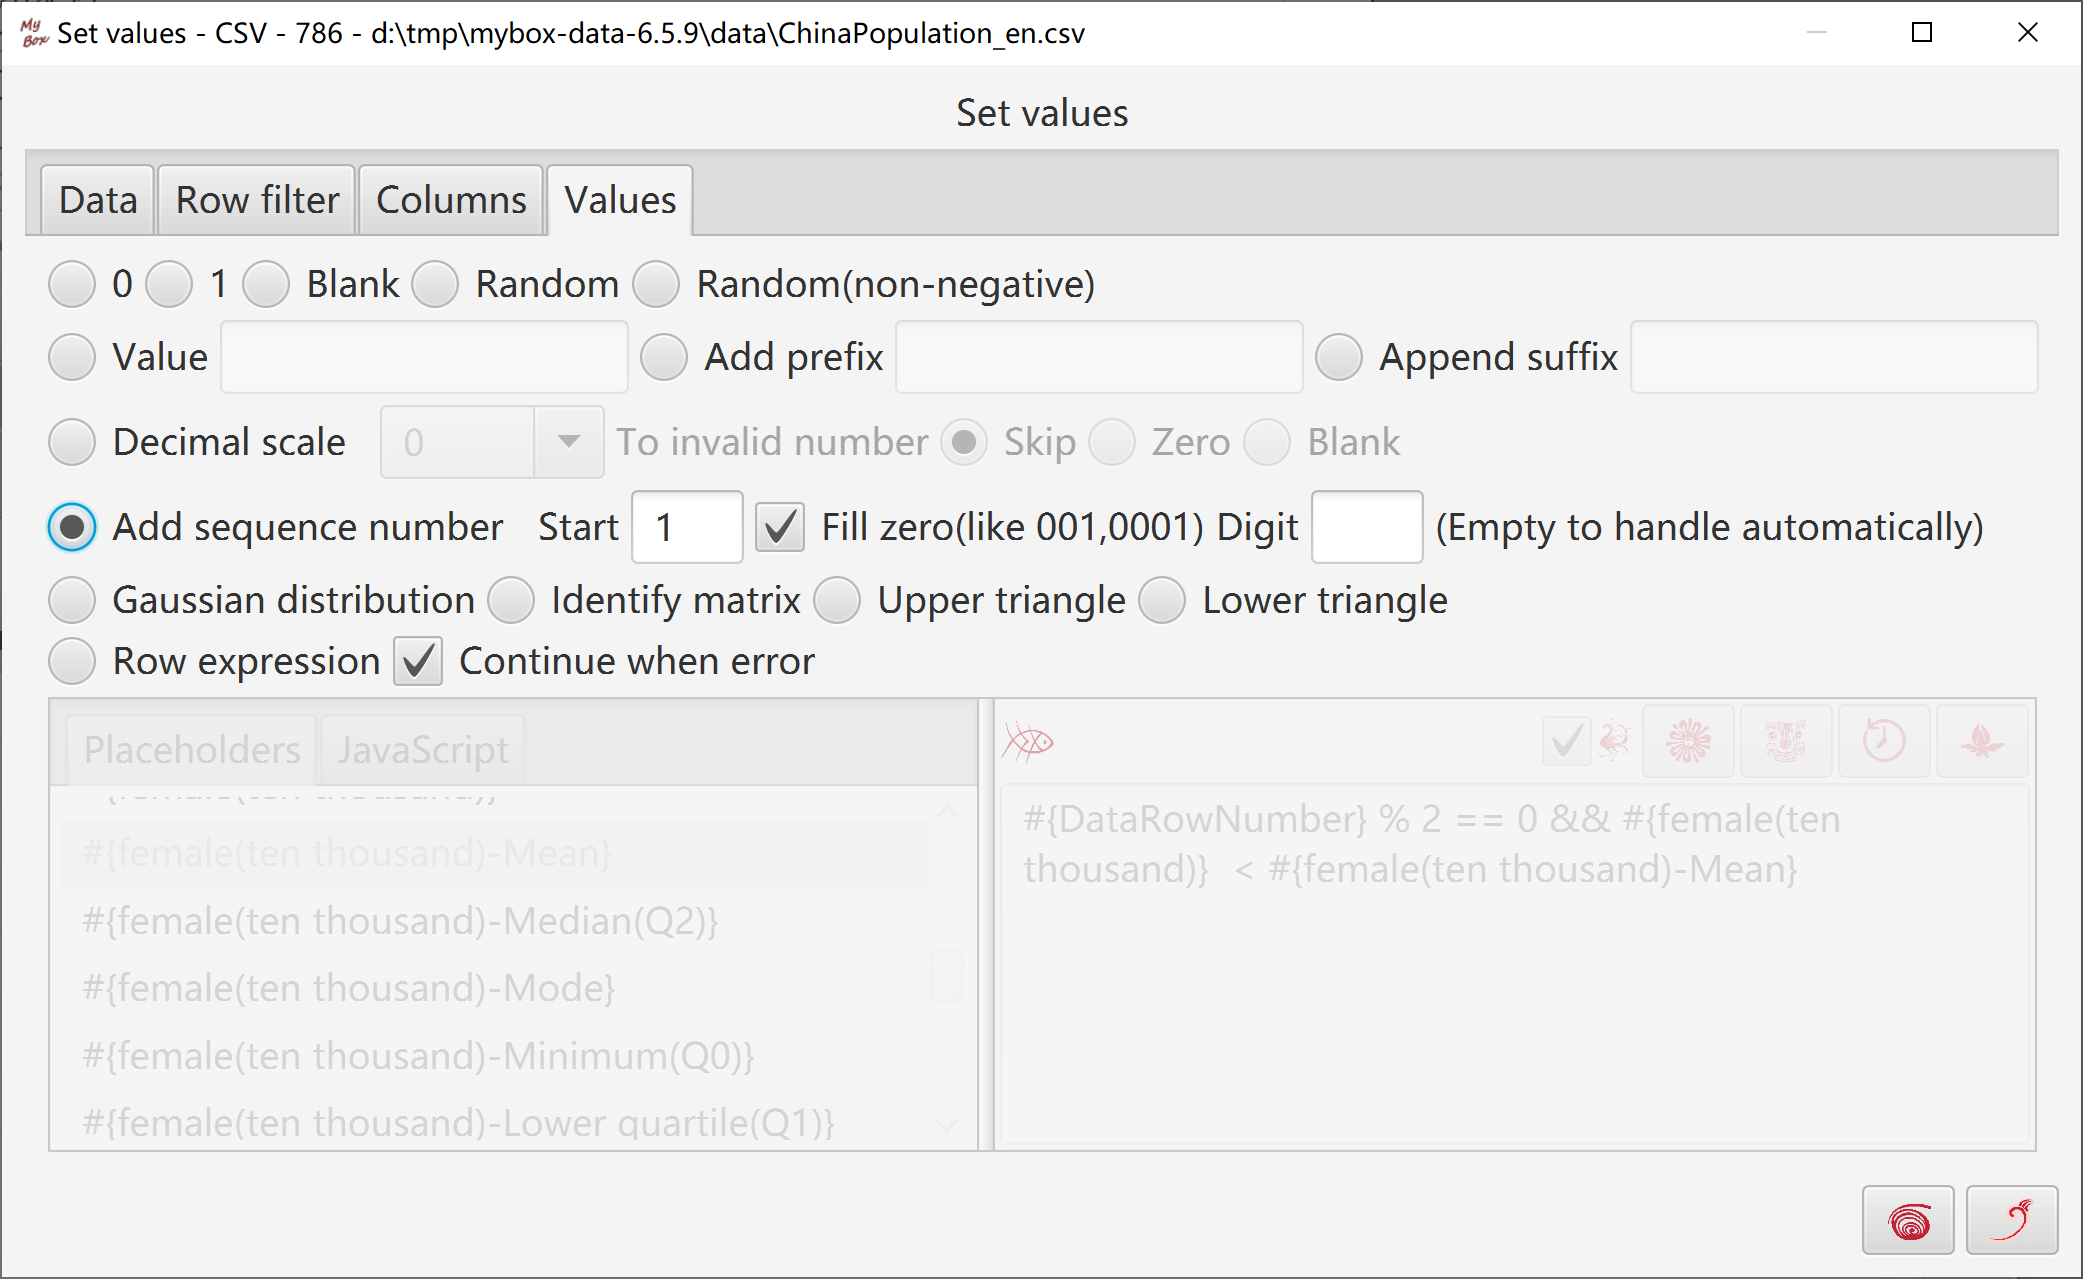
Select data rows. Row filter can be set.
Select columns to be set.
Select way to set values:
Constant:0, 1, blank, or inputted value
Random, random of non-negative
Add prefix, append suffix, set decimal scale, or add sequence numbers
When selected data are sqaure, whose rows number equals to columns number, they can be set as following: gaussian distribution, identify matrix, upper triangular matrix, lower triangular matrix.
Row expression
If handle all pages of data file, then auto-backup before set values.
Select data rows. Row filter can be set.
Option: Whether continue when error.
If handle all pages of data file, then auto-backup before delete.
Add/Edit/Delete/Rename styles.
Define title and sequence number of the style.
Set whether the style marks abnormal values.
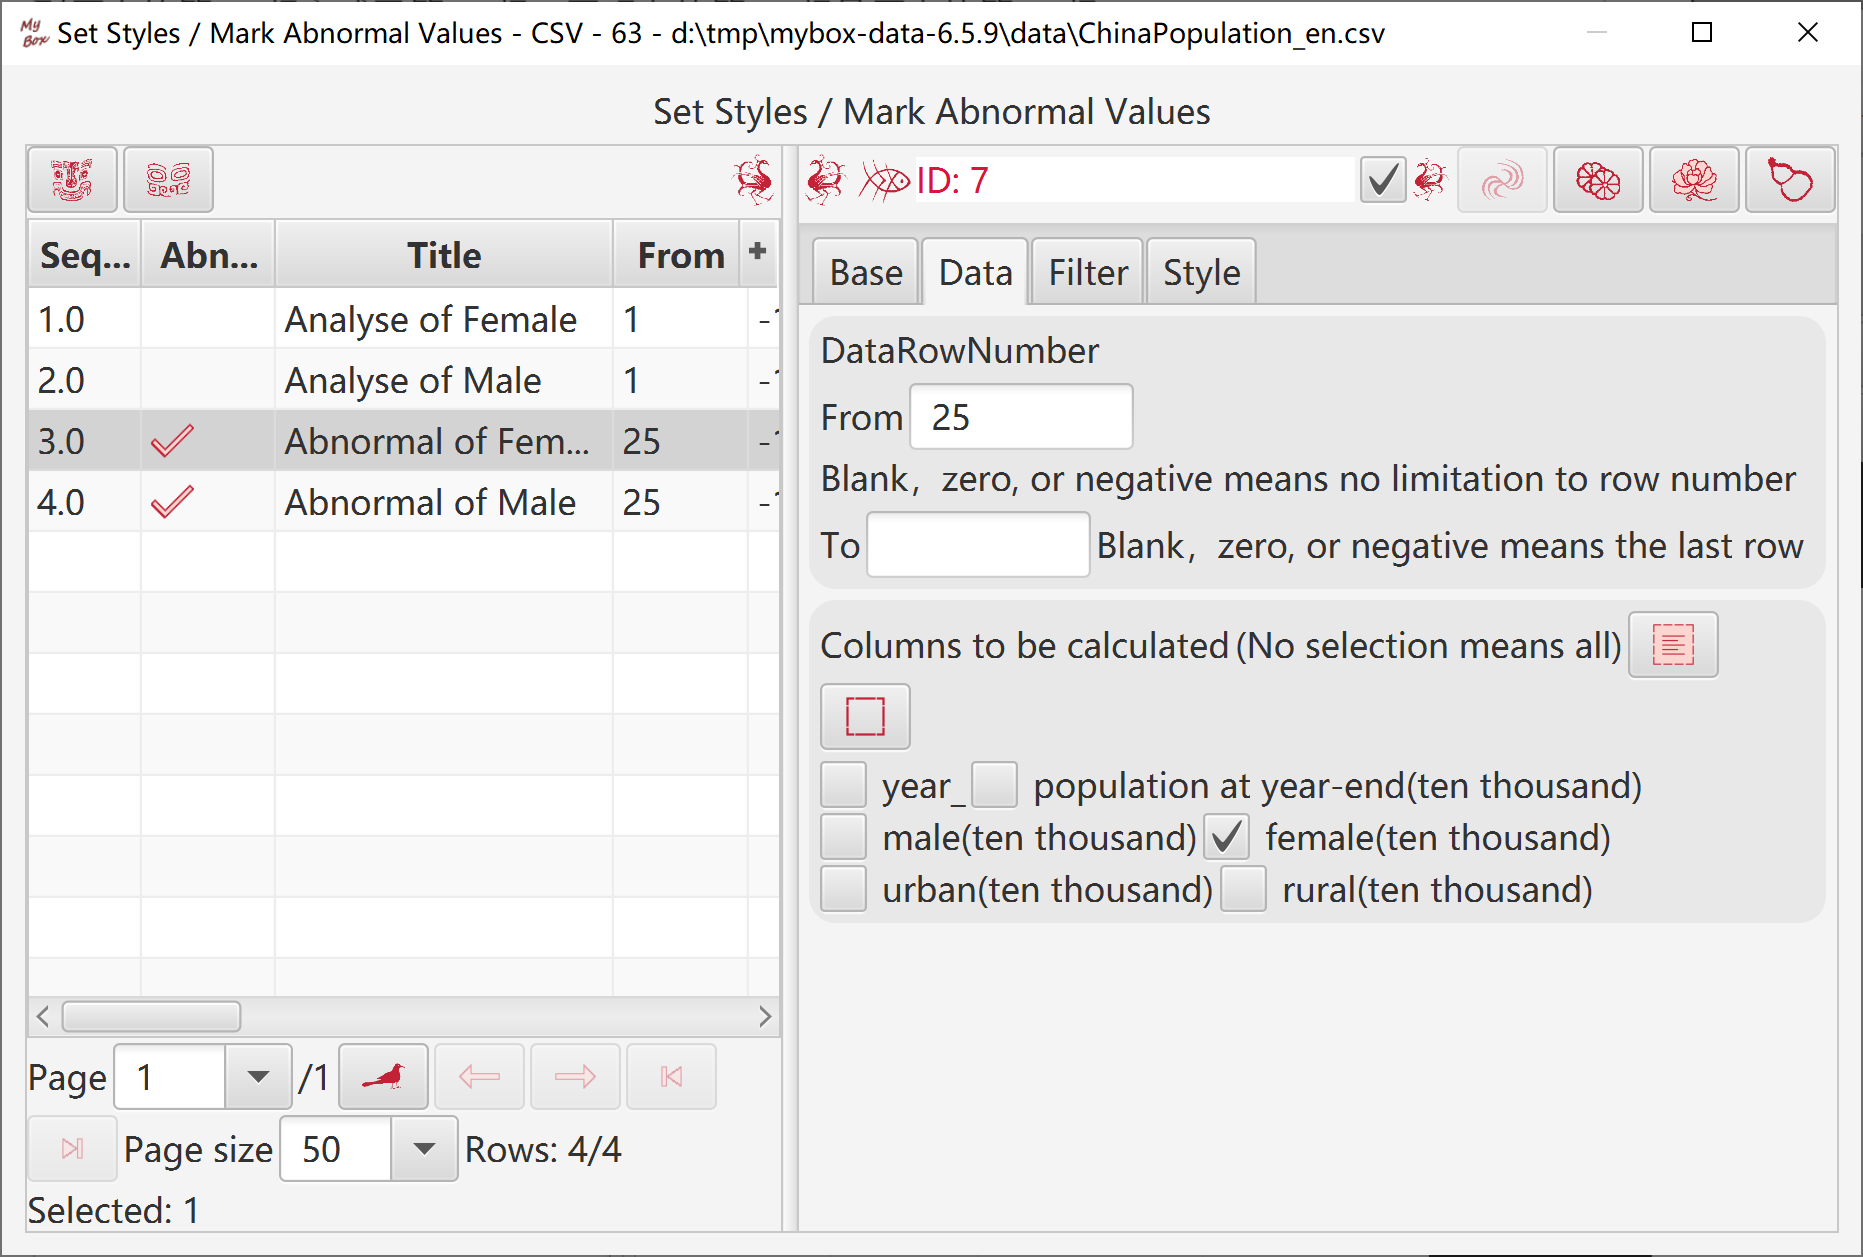
Define conditions to determine which data cells to apply the style:
Range of data rows
Column names.
Row filter.
Notice, data of a row number may be changed when some rows are added or deleted. Example, when insert 2 rows before "row 6", original "row 12" becomes "row 14" while current "row 12" was "row 10".
So "row number" is not right way to locate a specific data row while rows number is changing. A way to refer sepcial rows is the expression composed of column values.
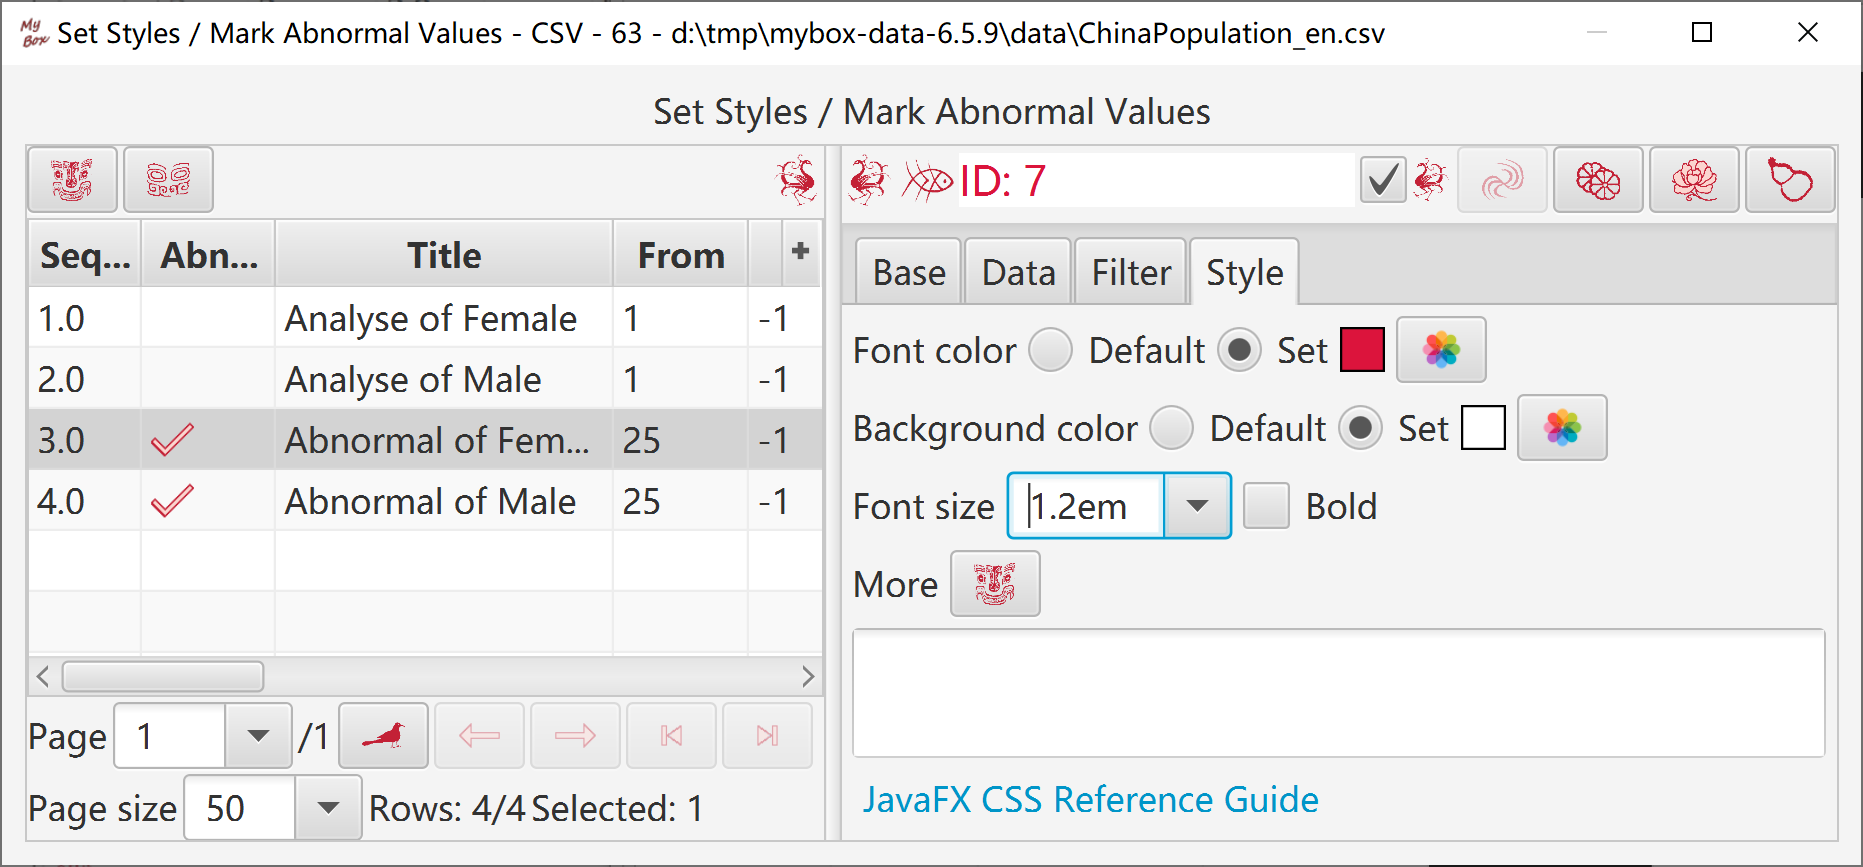
Font color, font size, background color, bold, etc.
More values in format of JavaFx CSS.
When load data page, all styles of the data are applied to the rows one by one in order of their sequence numbers(from small to large).
When data scopes of styles are interlaced, style with larger number overrides the one with smaller number for the interlaced part.
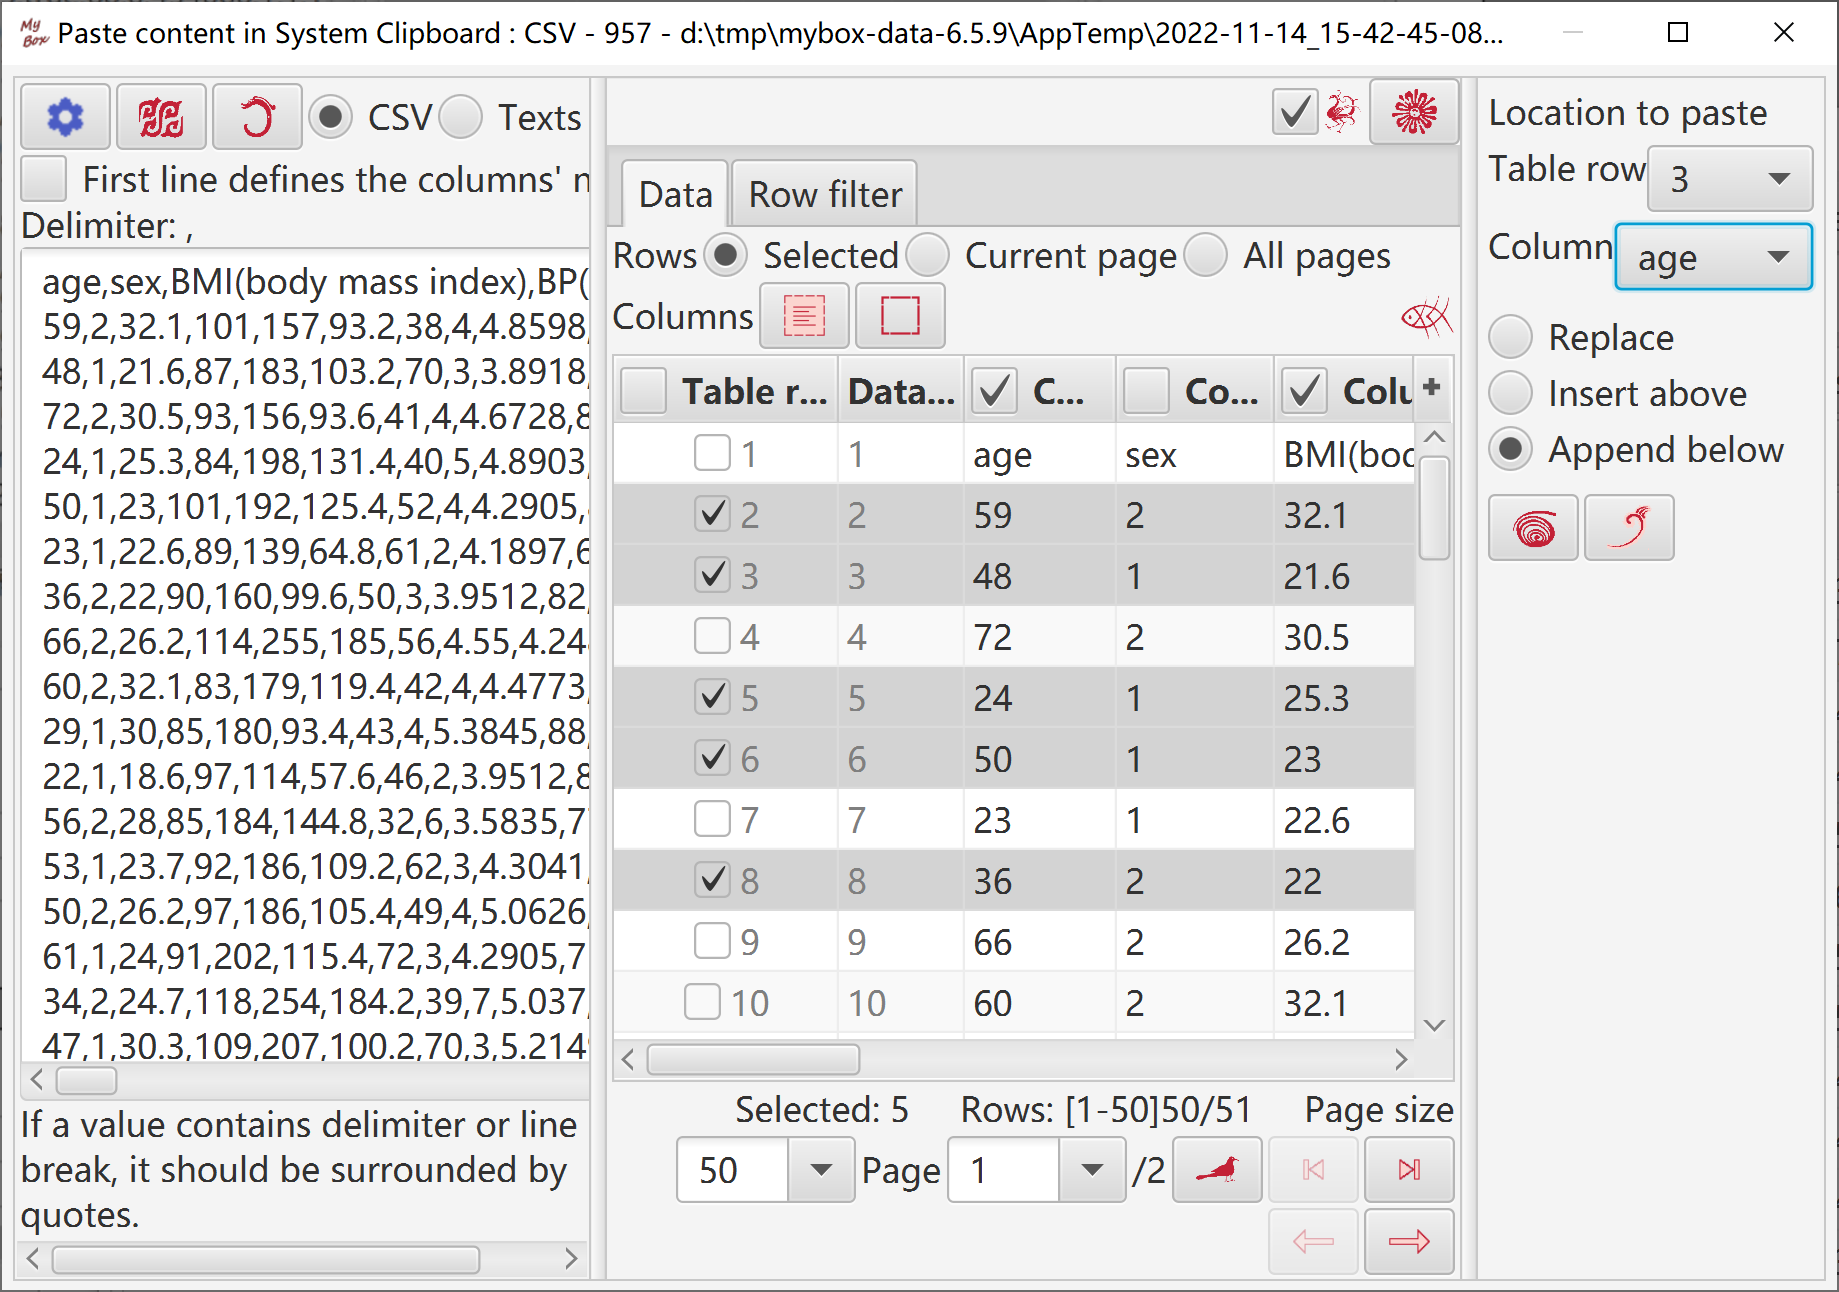
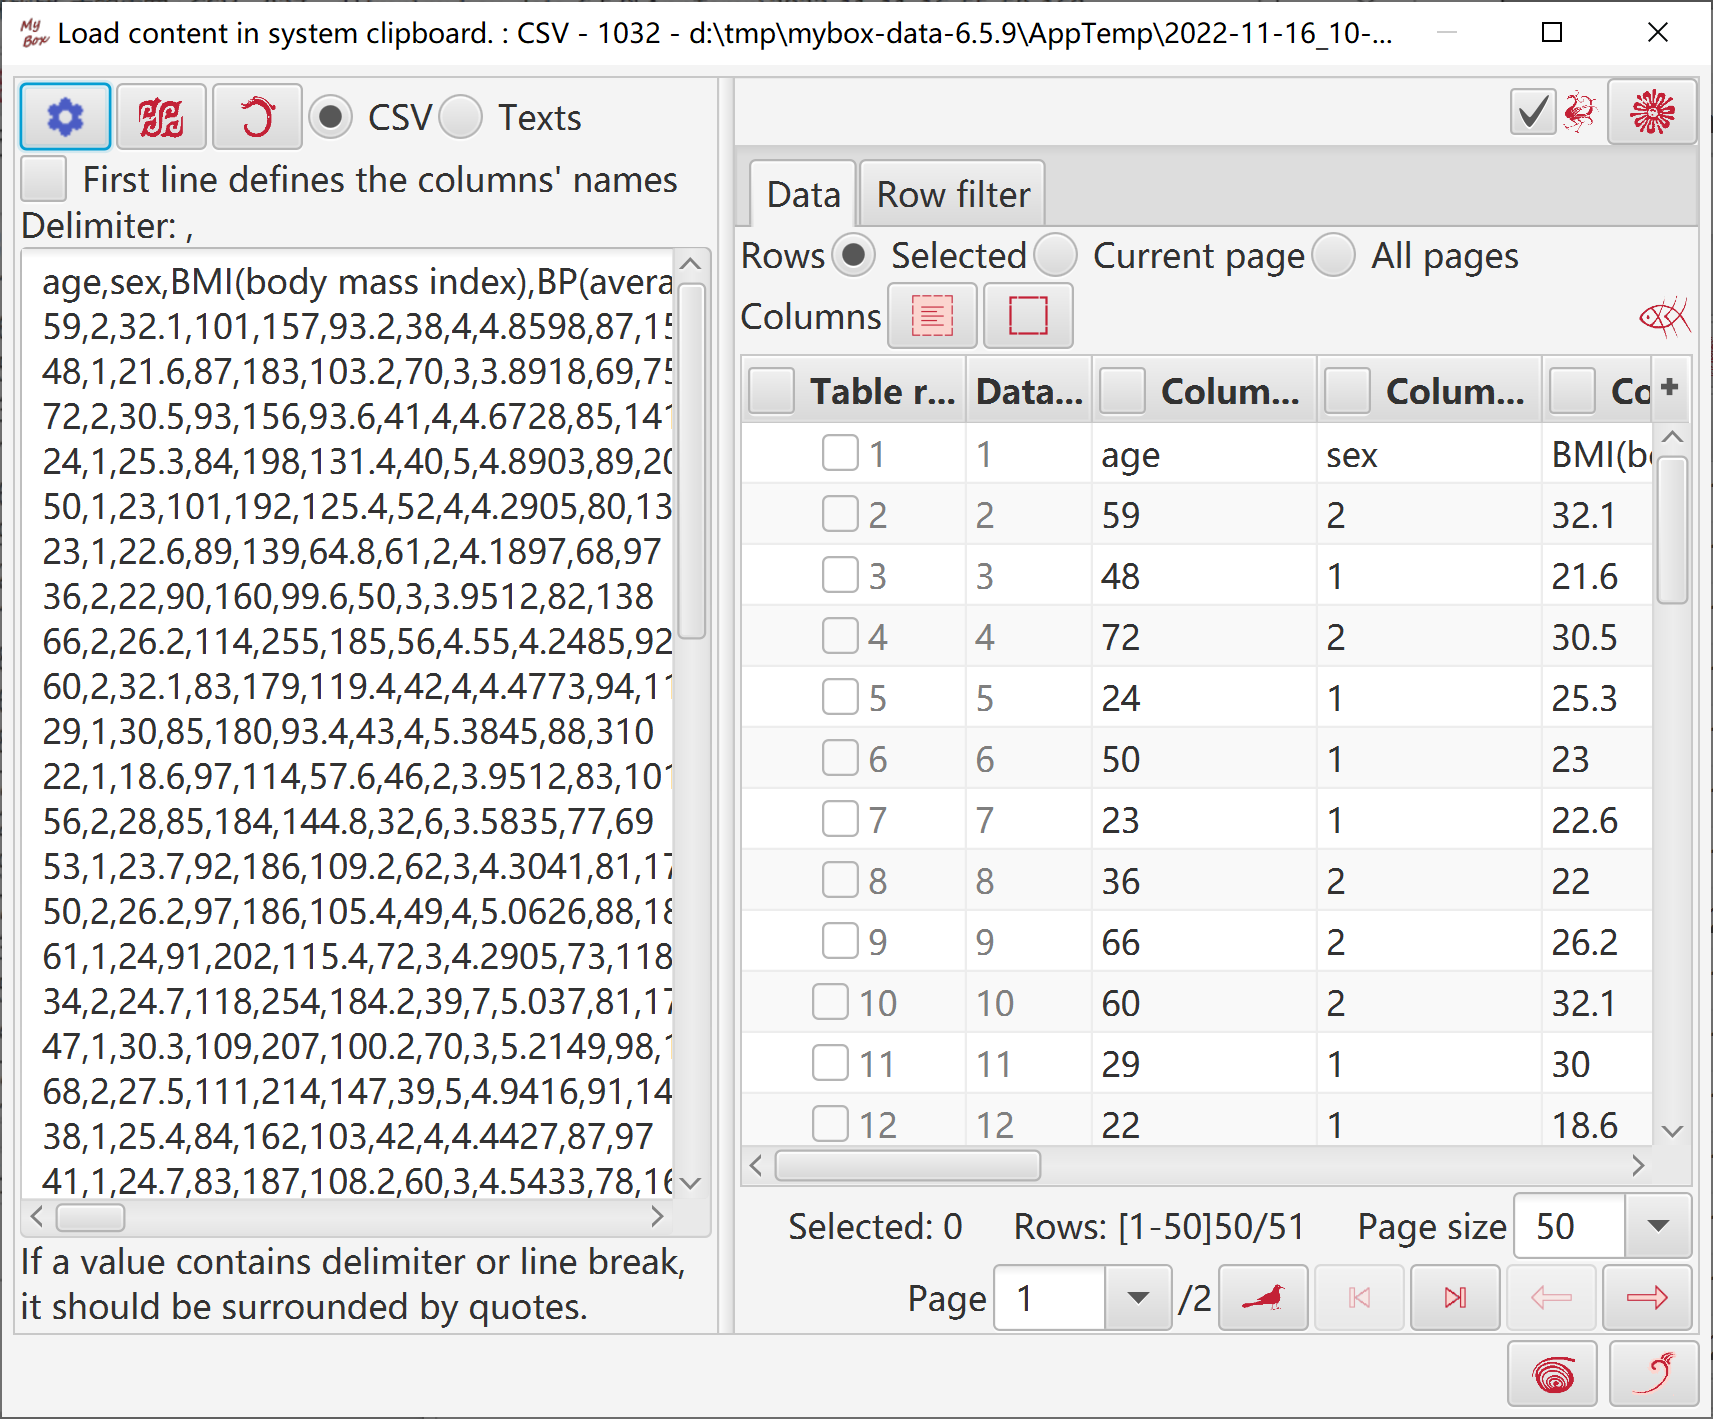
Read contents in System Clipboard.
Guess delimeter and parse data.
User can select a delimeter to parse data.
Select how to parse:
CSV parser: Values can contain delimeter and line break. But not support parsing “Blanks” and “Regular Expression”.
Text parser: Values can not contain delimeter and line break. Support parsing “Blanks” and “Regular Expression”.
Select whether first line defines column names.
Based on parsed data, select rows and columns to be pasted.
Select location to paste data: row and column in target data.
Select the way to paste data: Replace, Insert Above, or Append Below.
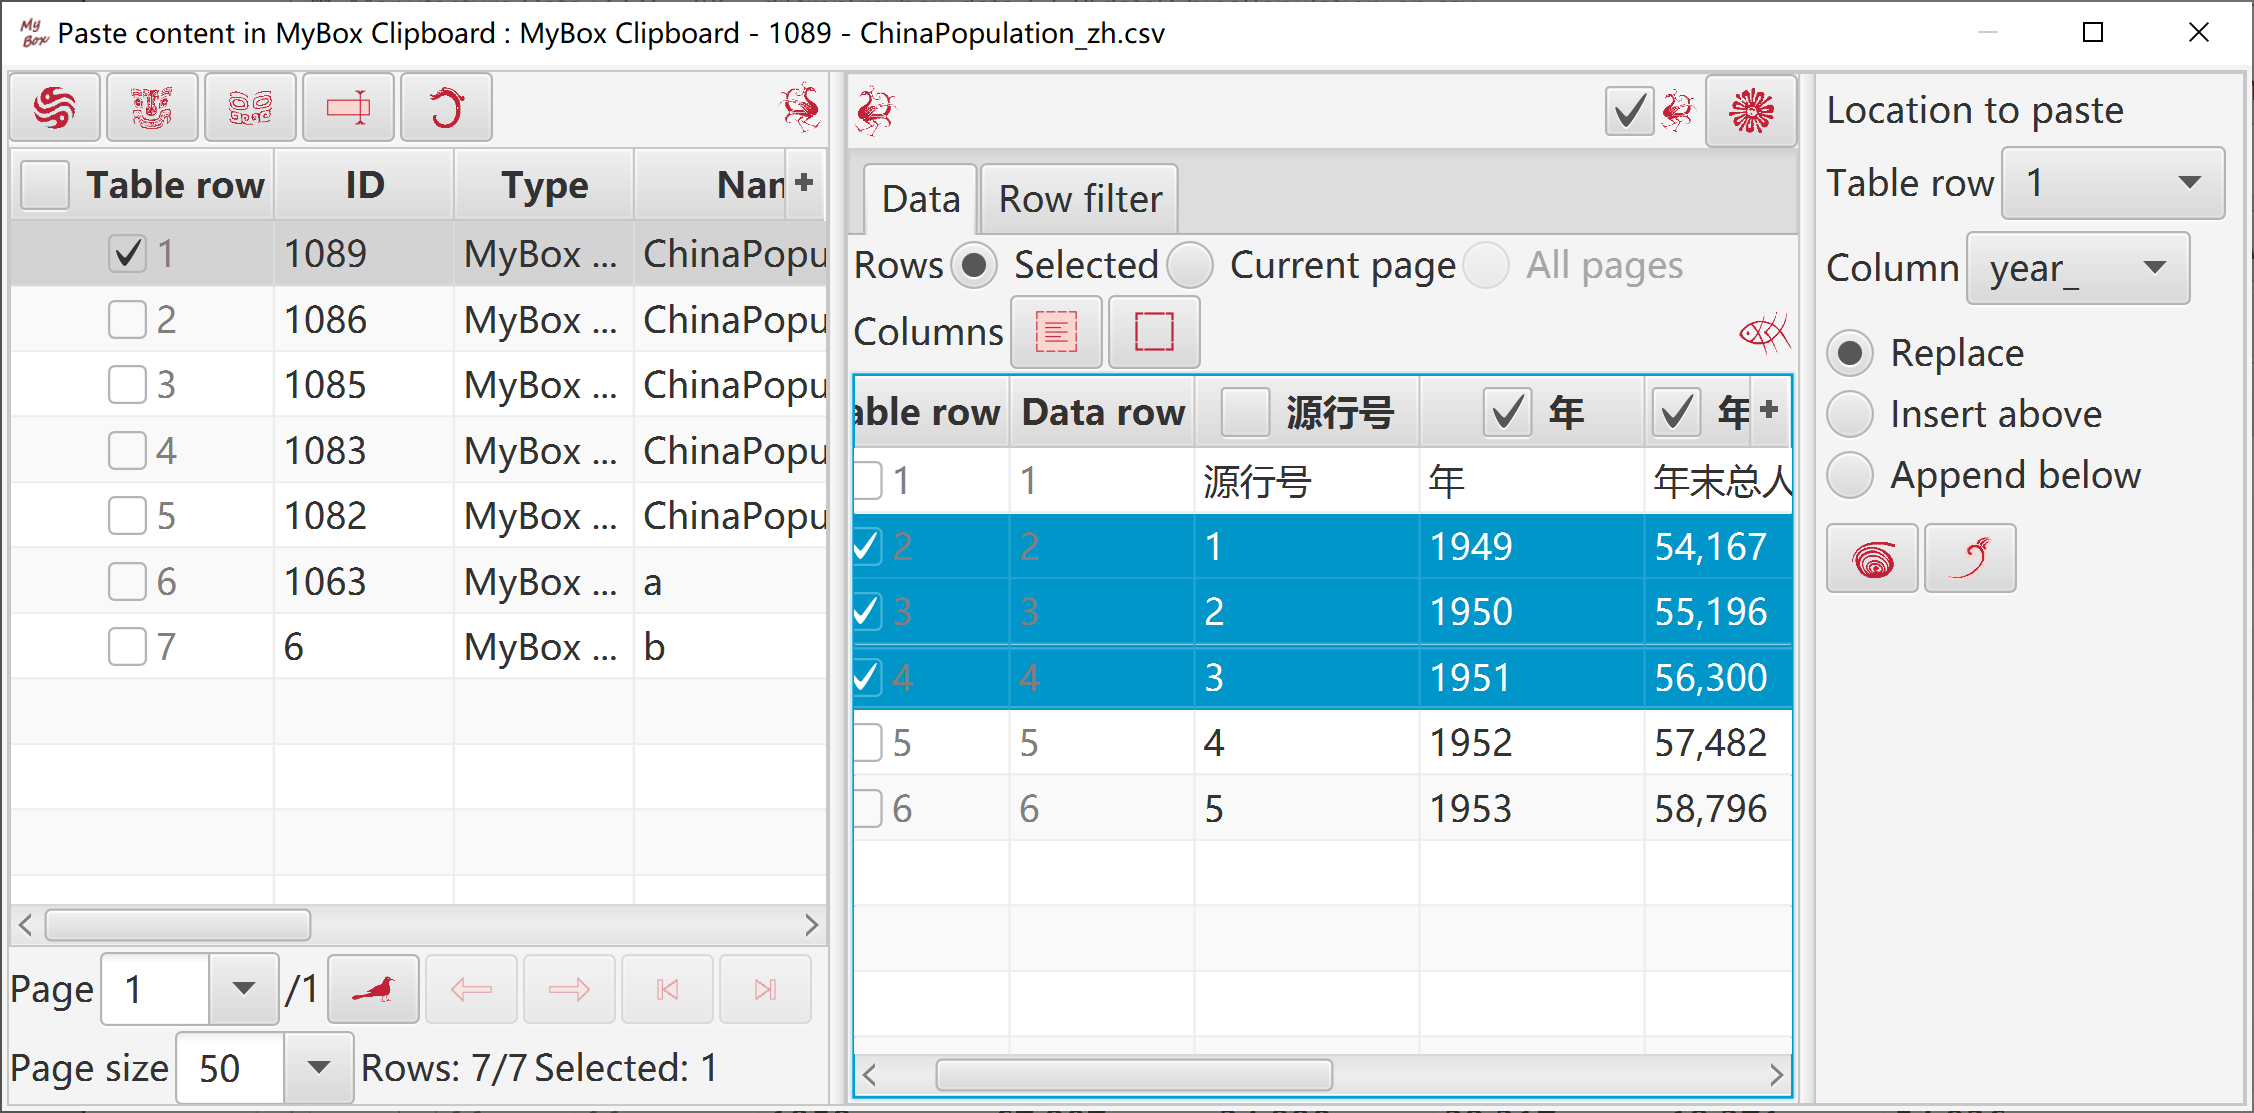
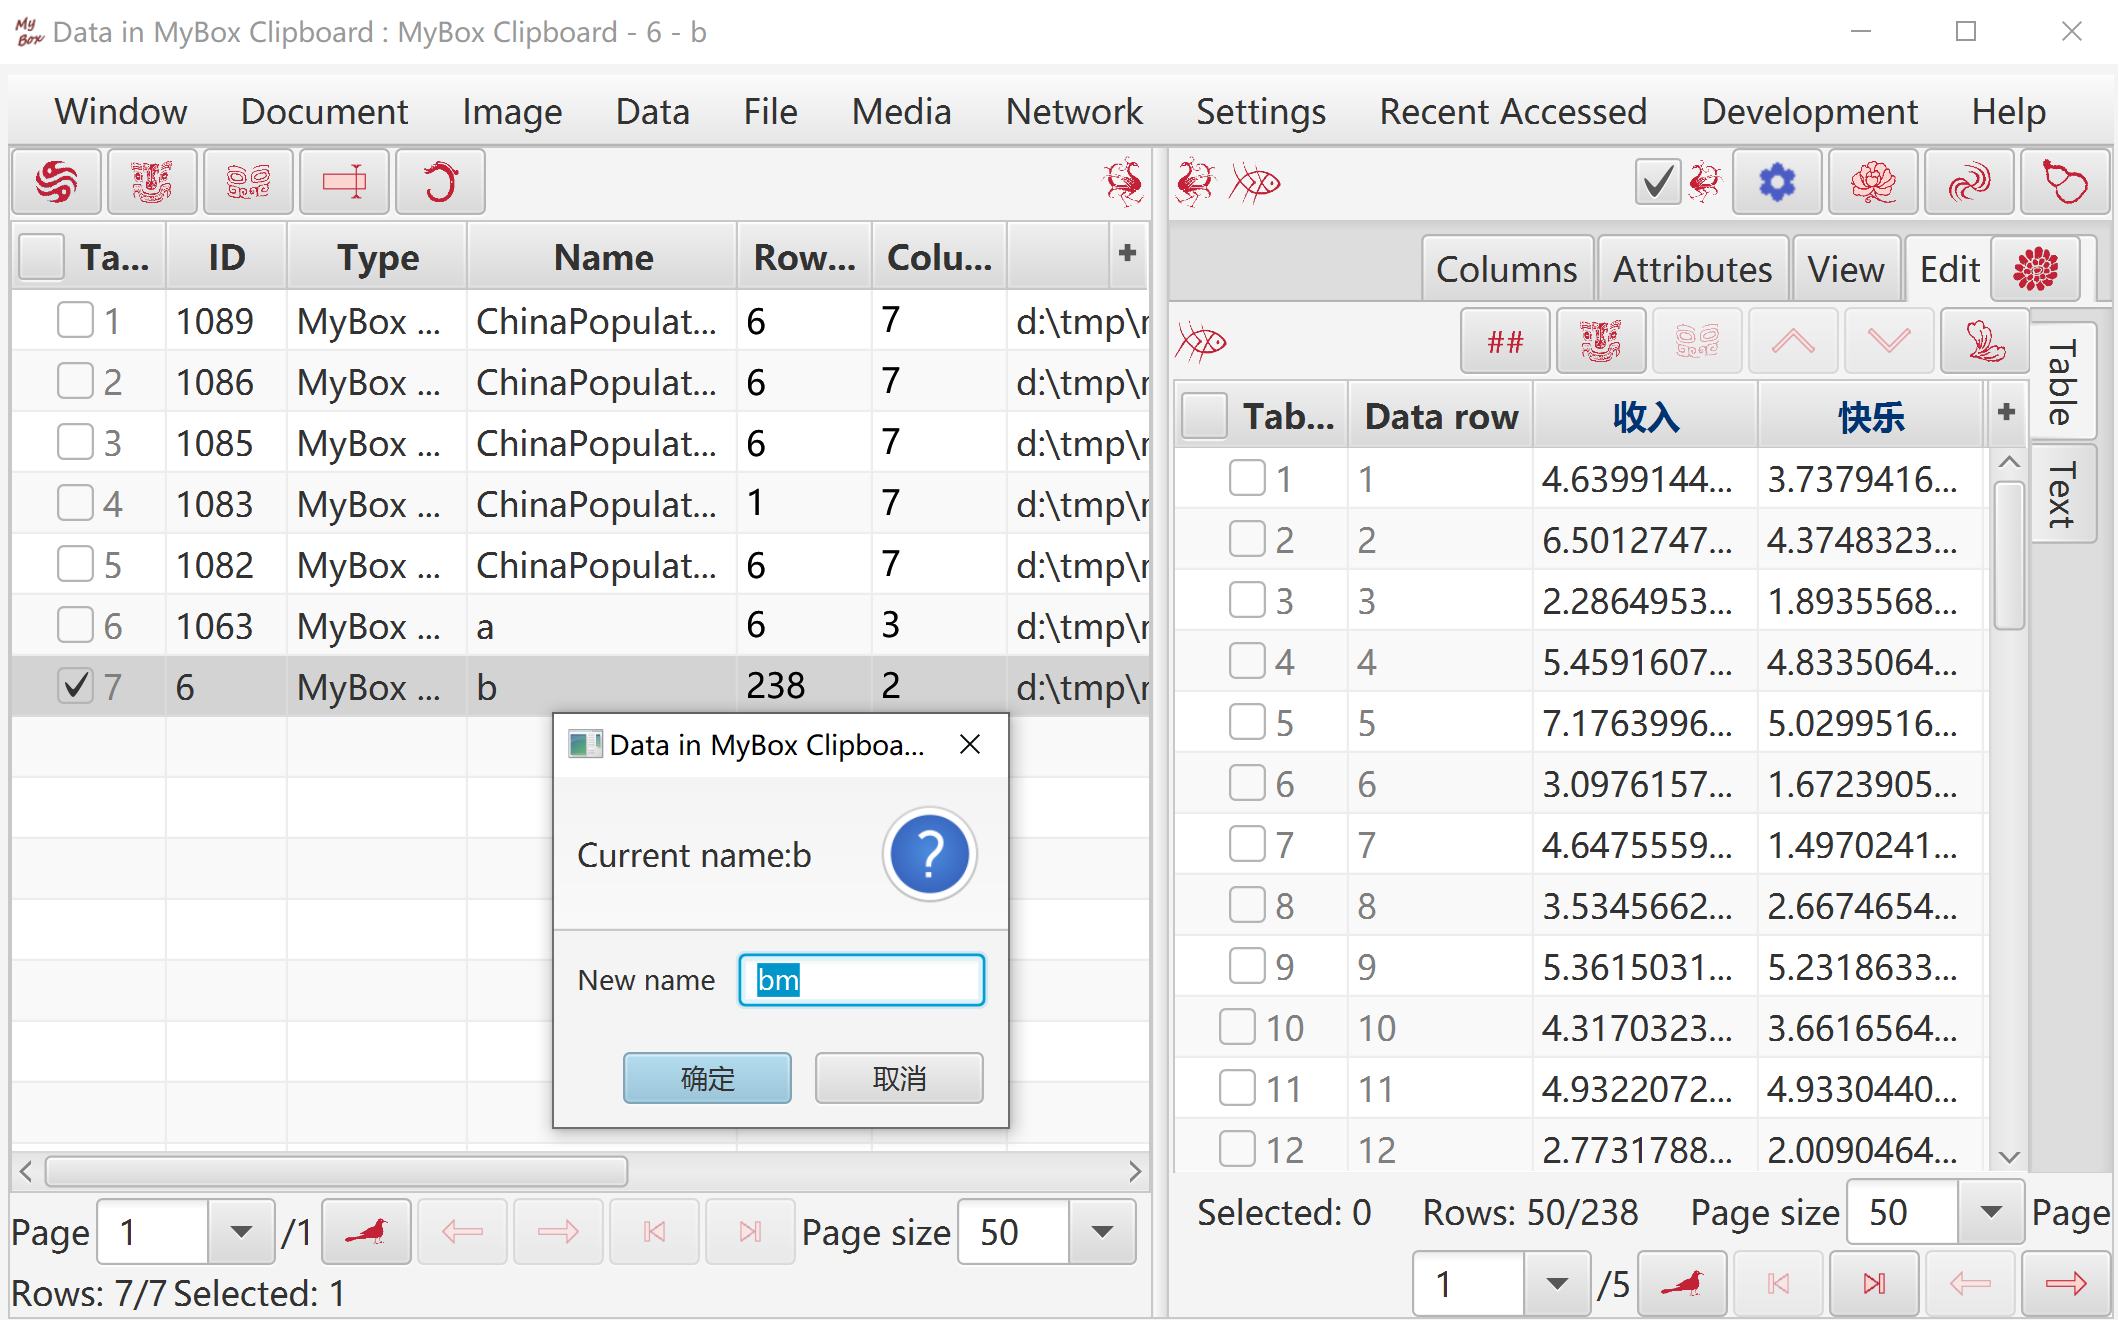
Select data item in MyBox Clipboard.
Select rows and columns to be pasted.
Select location to paste data: row and column in target data.
Select the way to paste data: Replace, Insert Above, or Append Below.
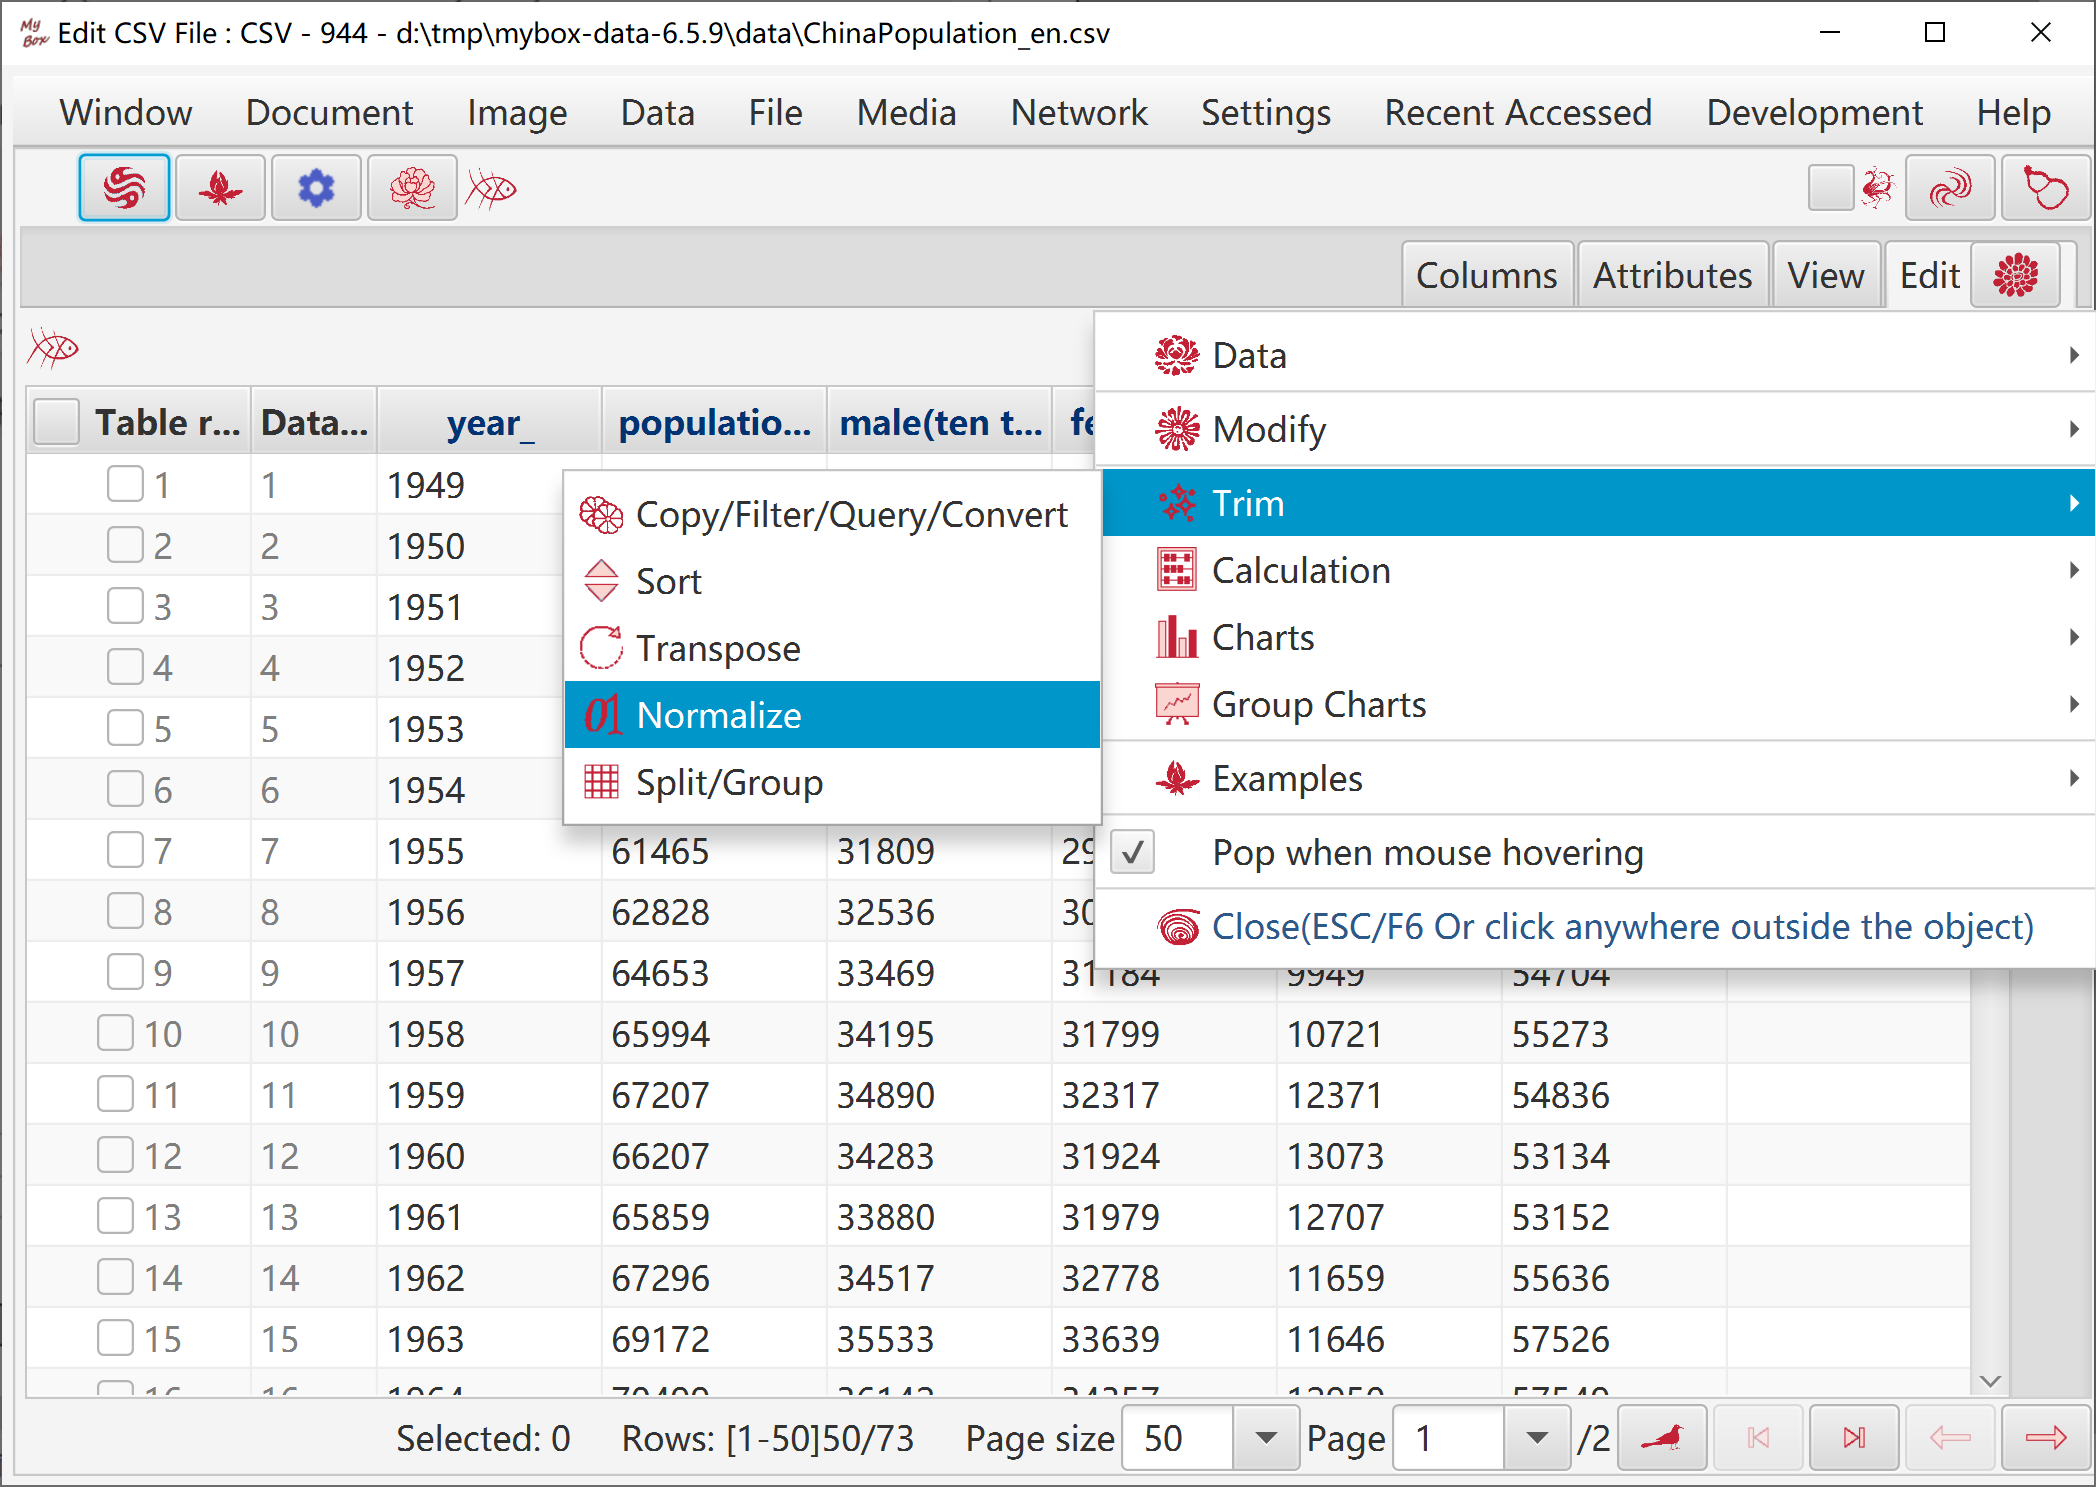
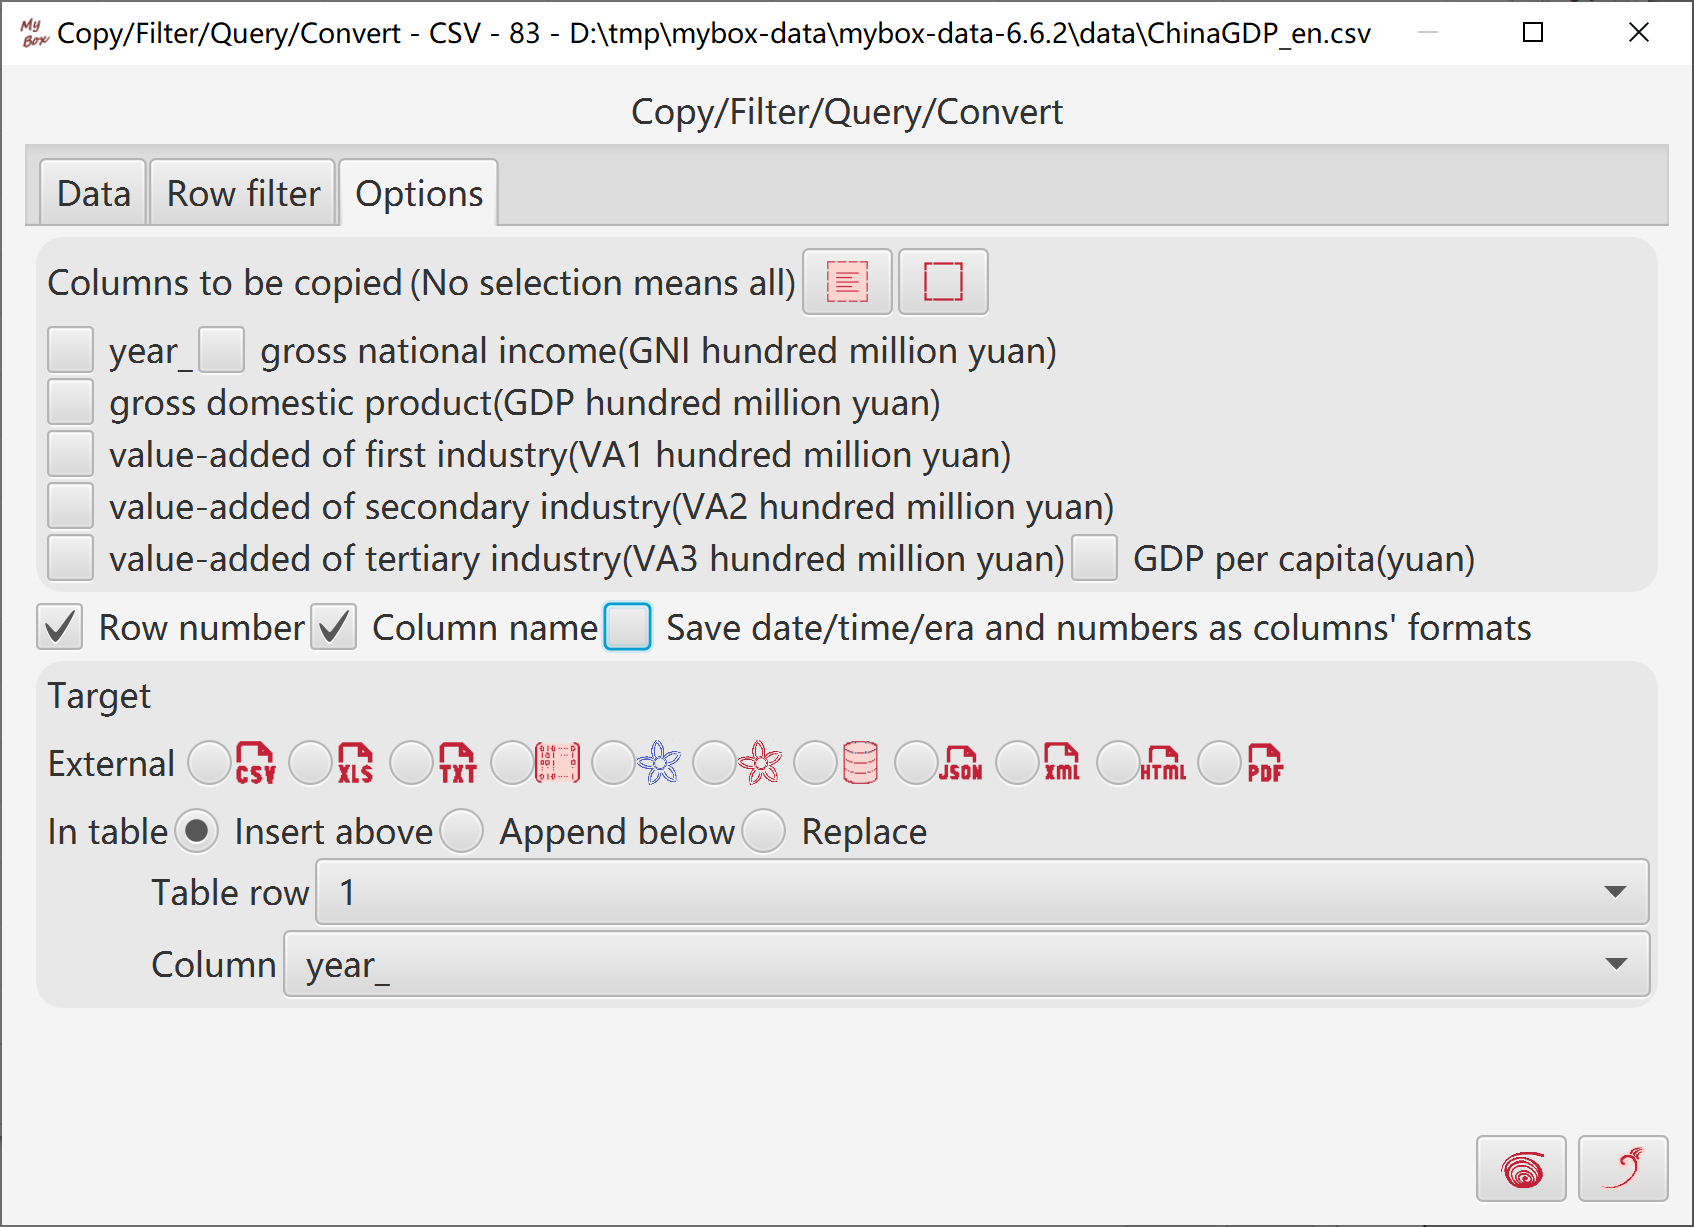
Hoever or click button “Function” and select functions under menu item “Trim”.
Select data rows. Row filter can be set.
Select columns to be copied.
Select wthether:
Copy row numbers
Copy column names
Save date/time/era and numbers as columns' formats
Results can be written as external data, including: new csv/excel/text file, matrix, system clipboard, MyBox clipboard, database table, json, xml, html, or pdf.
When handle rows for current page or selected ones, results can be written in current page: insert, append, or replace data in defined location of the table.
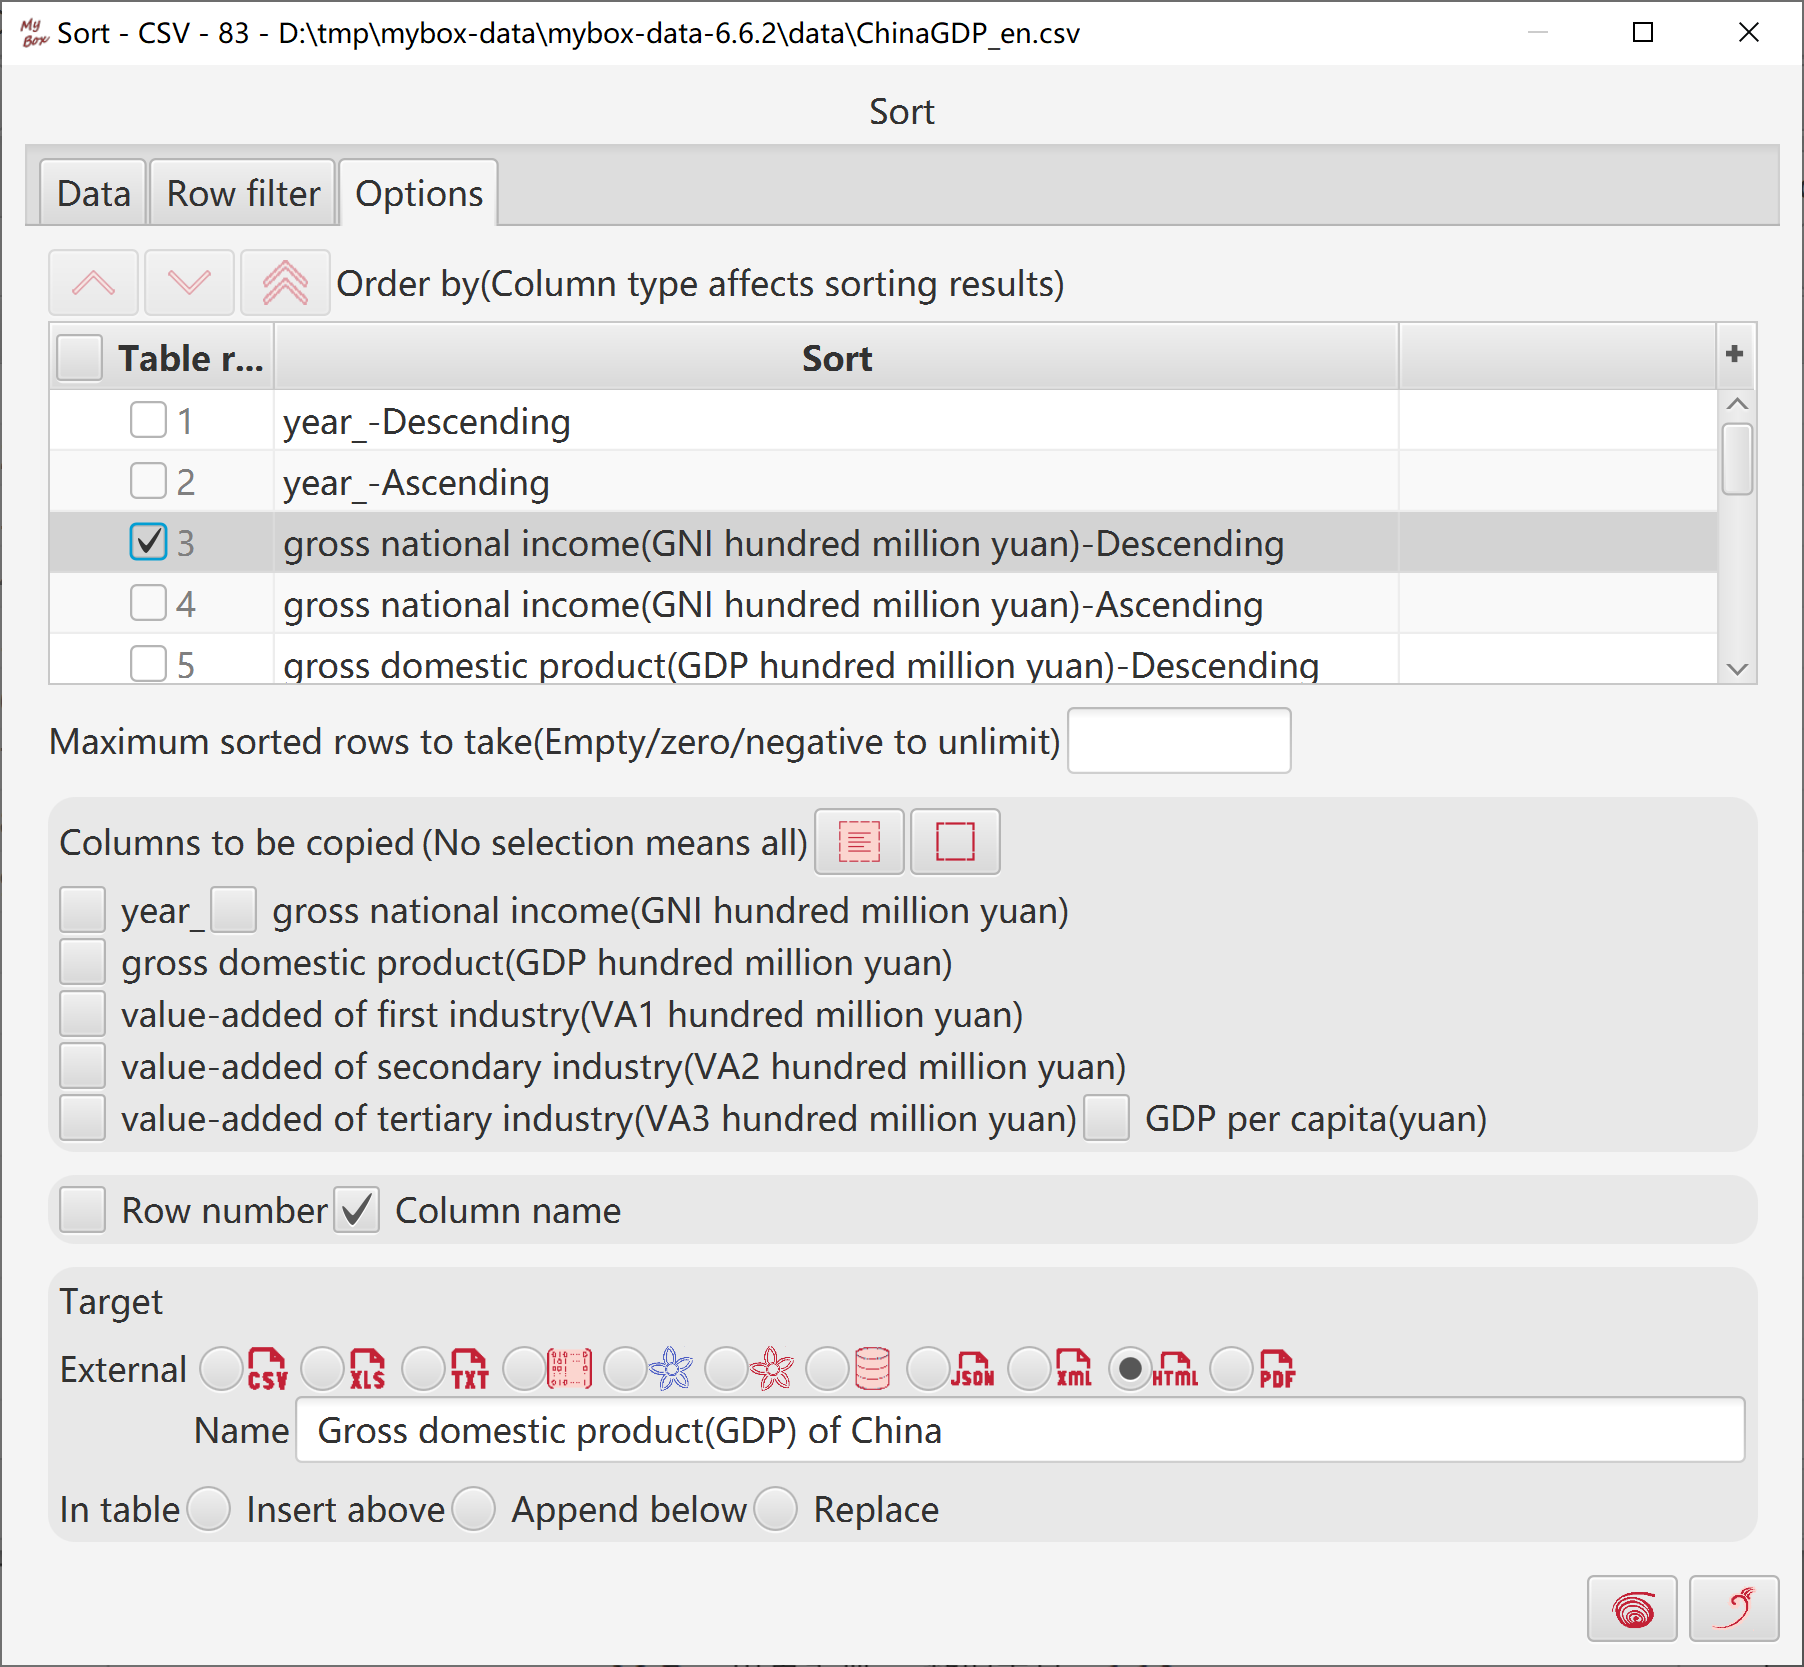
Select data rows. Row filter can be set.
Select columns to sort and whether descending.
Data type of column affects sorting results.
Maximum rows number of results can be set.
Select columns to be copied.
Select whether copy row number or column name.
Results can be written as external data, including: new csv/excel/text file, matrix, system clipboard, MyBox clipboard, database table, json, xml, html, or pdf.
When handle rows for current page or selected ones, results can be written in current page: insert, append, or replace data in defined location of the table.
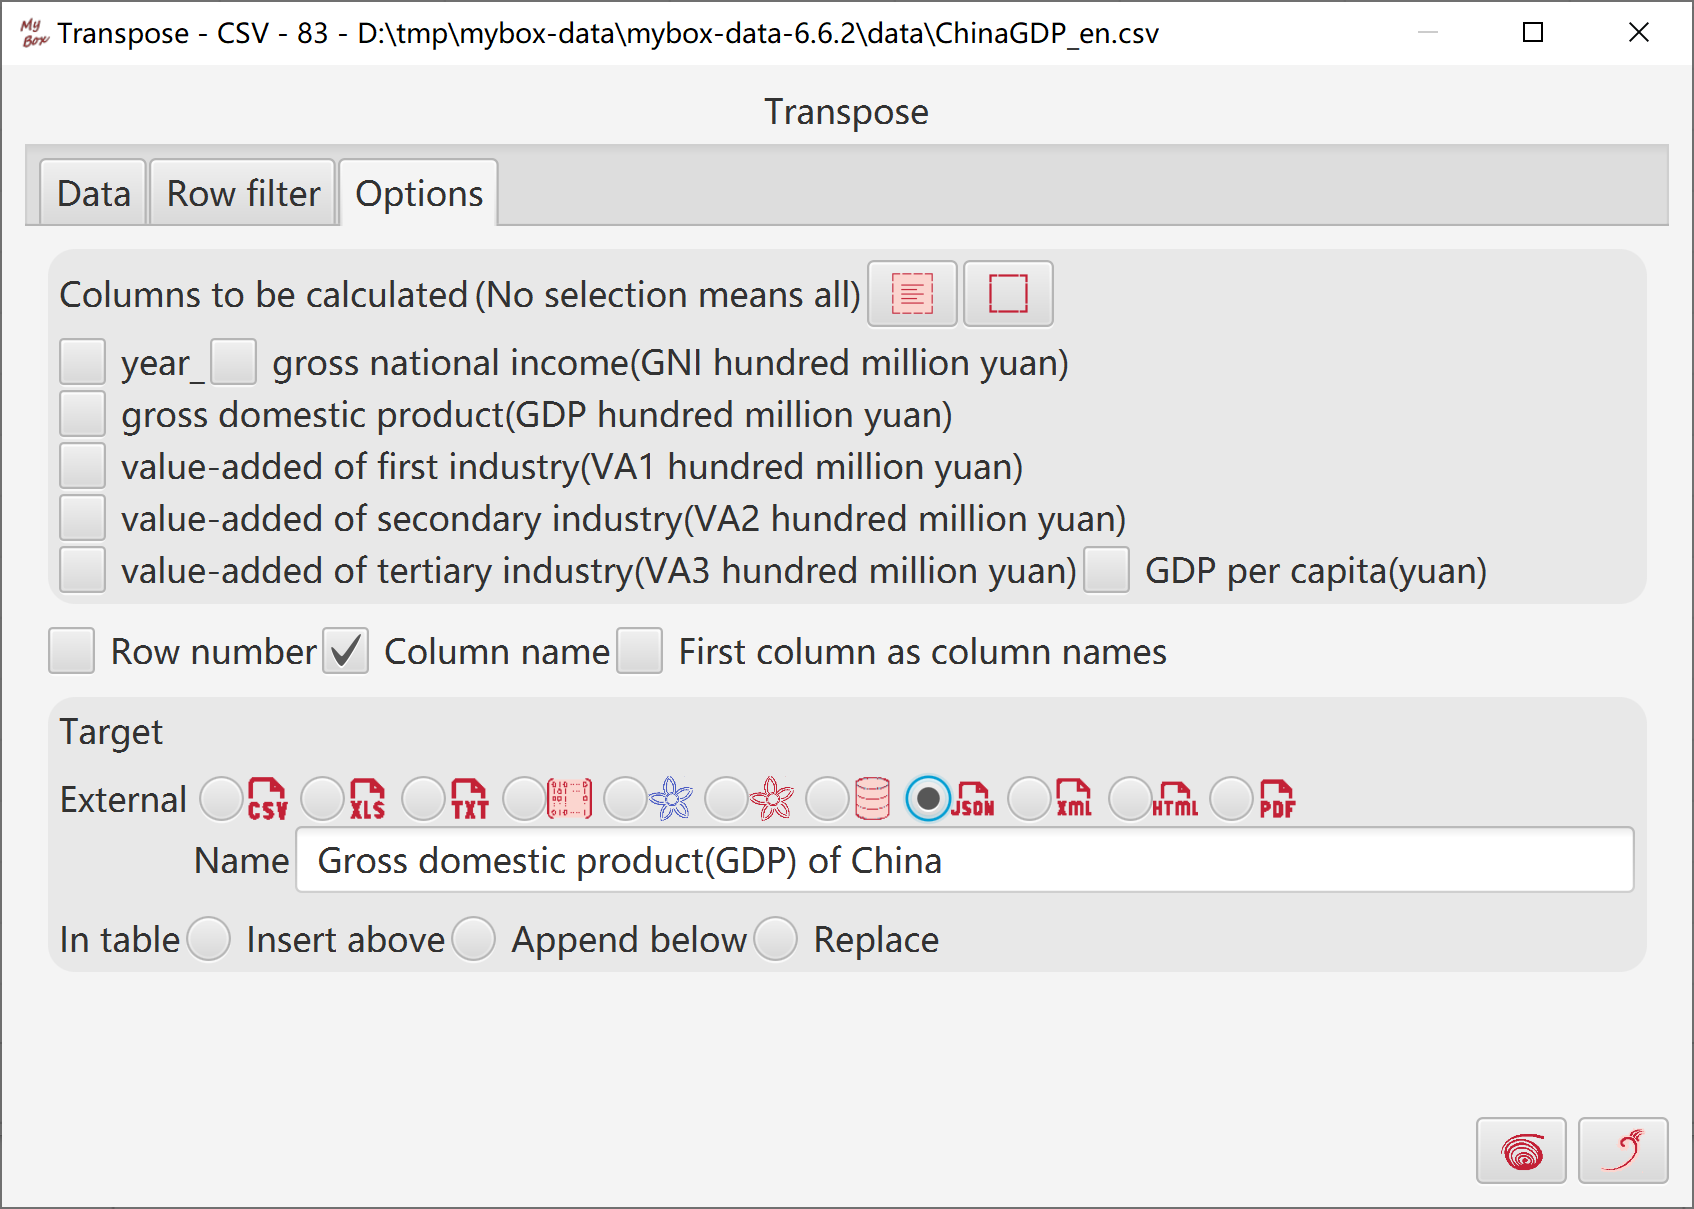
Select data rows. Row filter can be set.
Select columns to be calculated.
Select whether:
Copy row number
Copy column name
Set first column as column names.
Results can be written as external data, including: new csv/excel/text file, matrix, system clipboard, MyBox clipboard, database table, json, xml, html, or pdf.
When handle rows for current page or selected ones, results can be written in current page: insert, append, or replace data in defined location of the table.
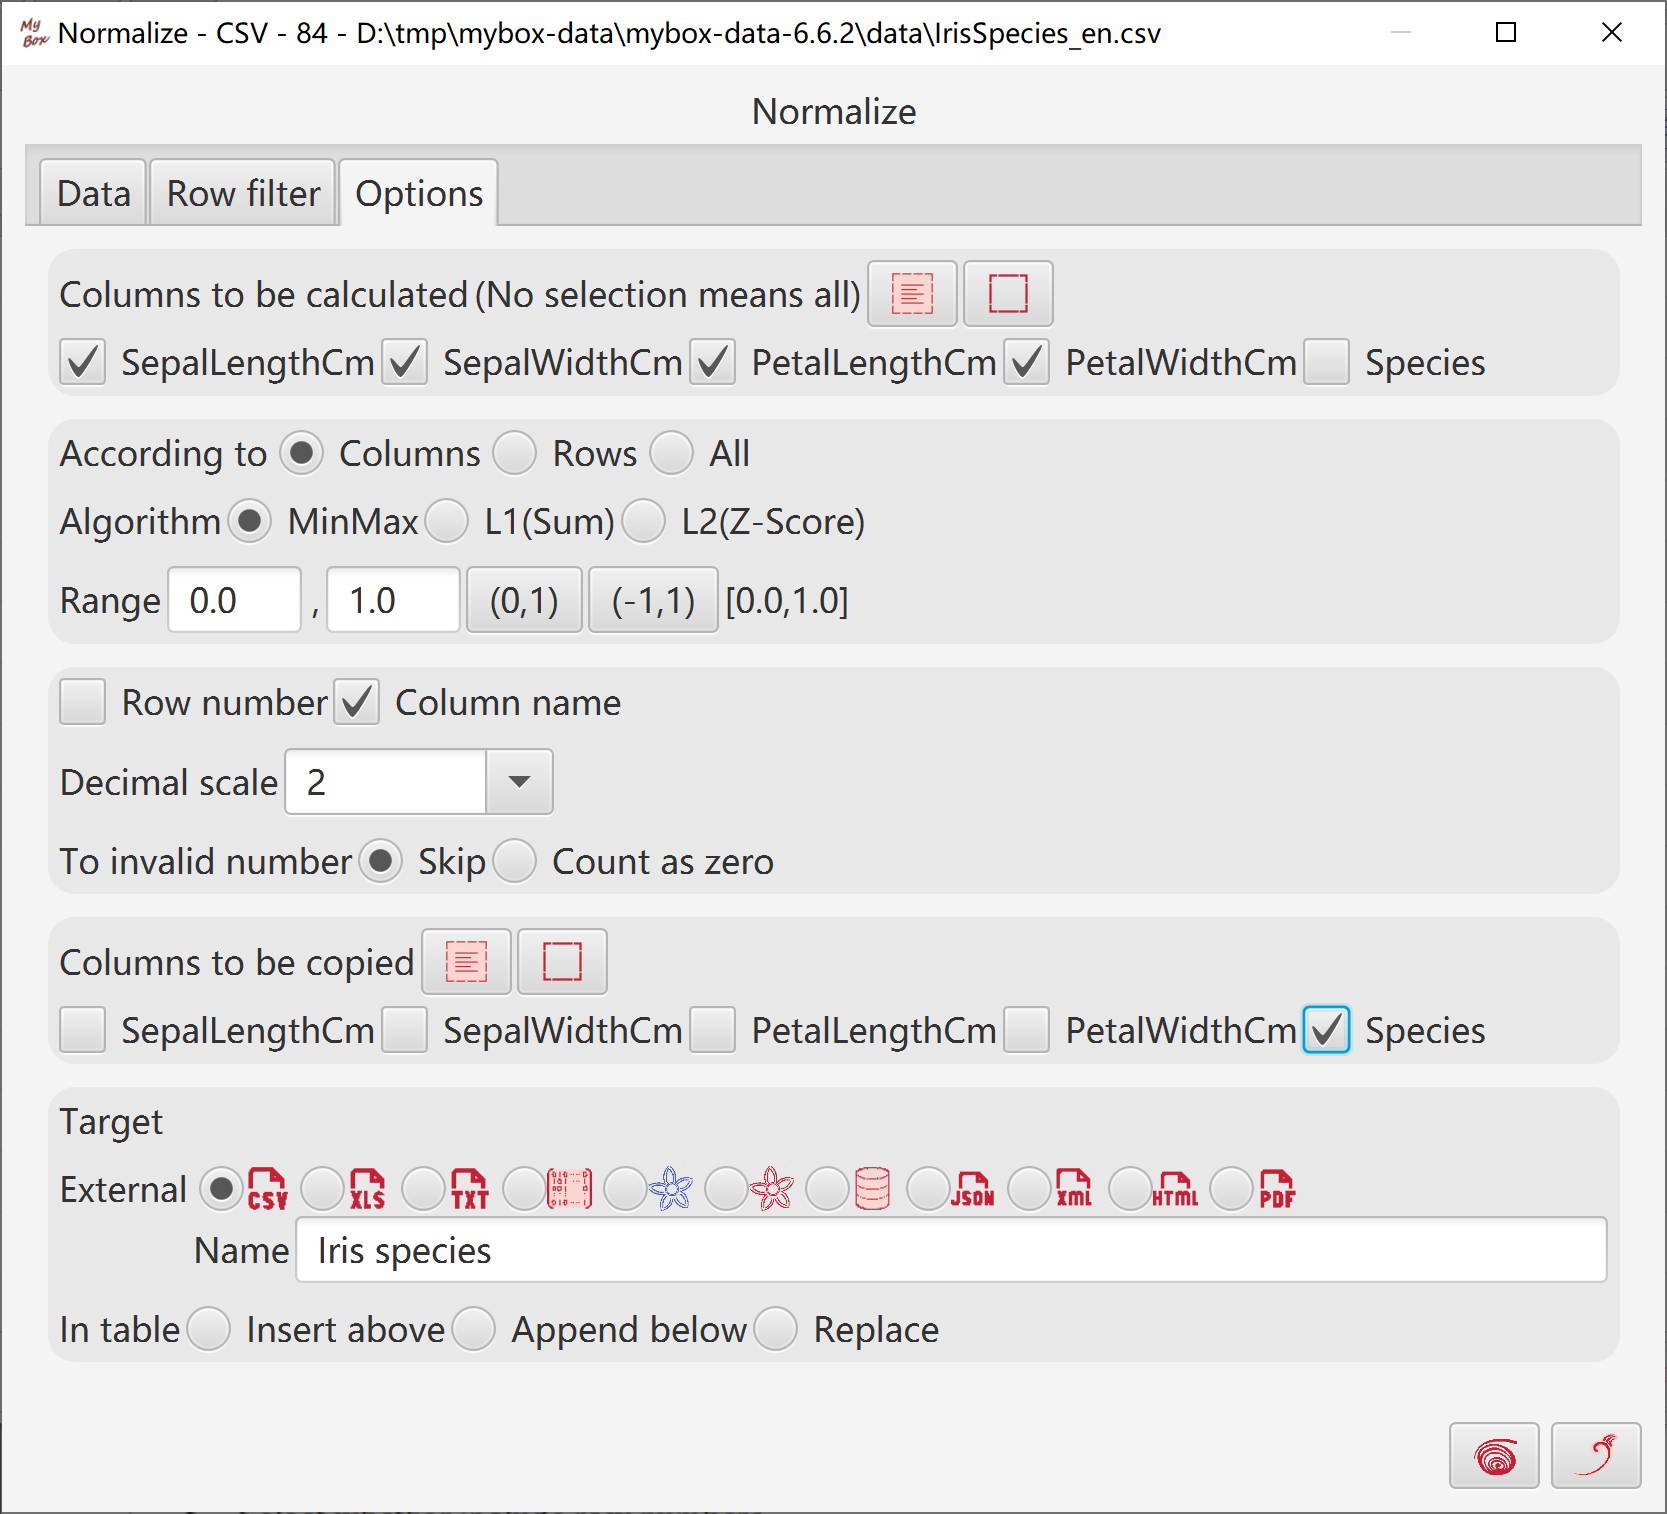
Select data rows. Row filter can be set.
Select columns to be calculated.
Select objects: Accroding to Columns/rows/all.
Select algorithms: MinMax(Range can be set), sum(L1), Zscore(L2).
To non-numeric, skip or count as zero.
Select columns to be copied.
Results can be written as external data, including: new csv/excel/text file, matrix, system clipboard, MyBox clipboard, database table, json, xml, html, or pdf.
When handle rows for current page or selected ones, results can be written in current page: insert, append, or replace data in defined location of the table.
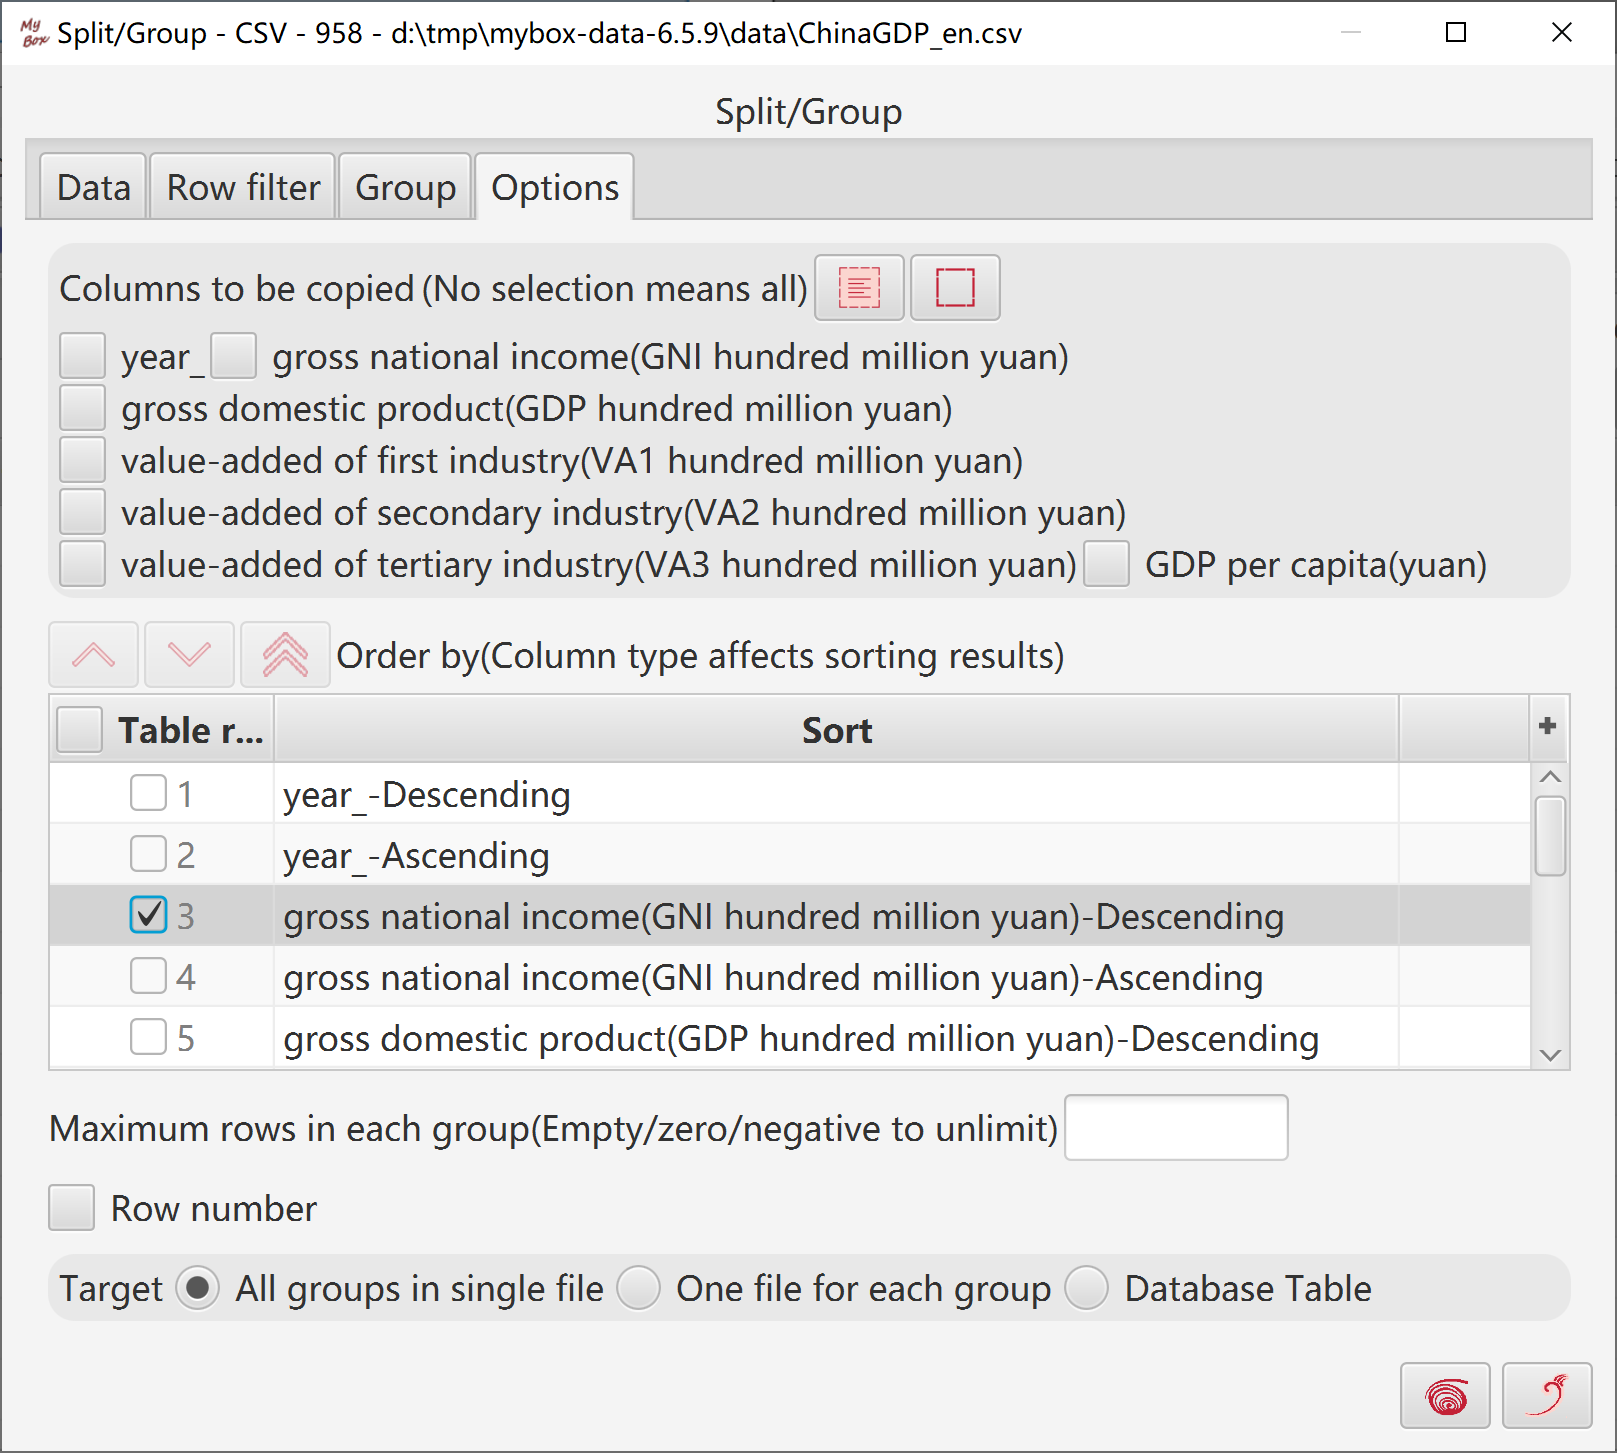
Select data rows. Row filter can be set.
Set parameters of grouping.
Select columns to be copied.
Set sort conditions and maximum data rows in each group.
Select whether include row numbers.
Select target:
All groups in single file
One file for each group
Database table
Hover or click button “Function” to select functions under menu item “Calculation”.
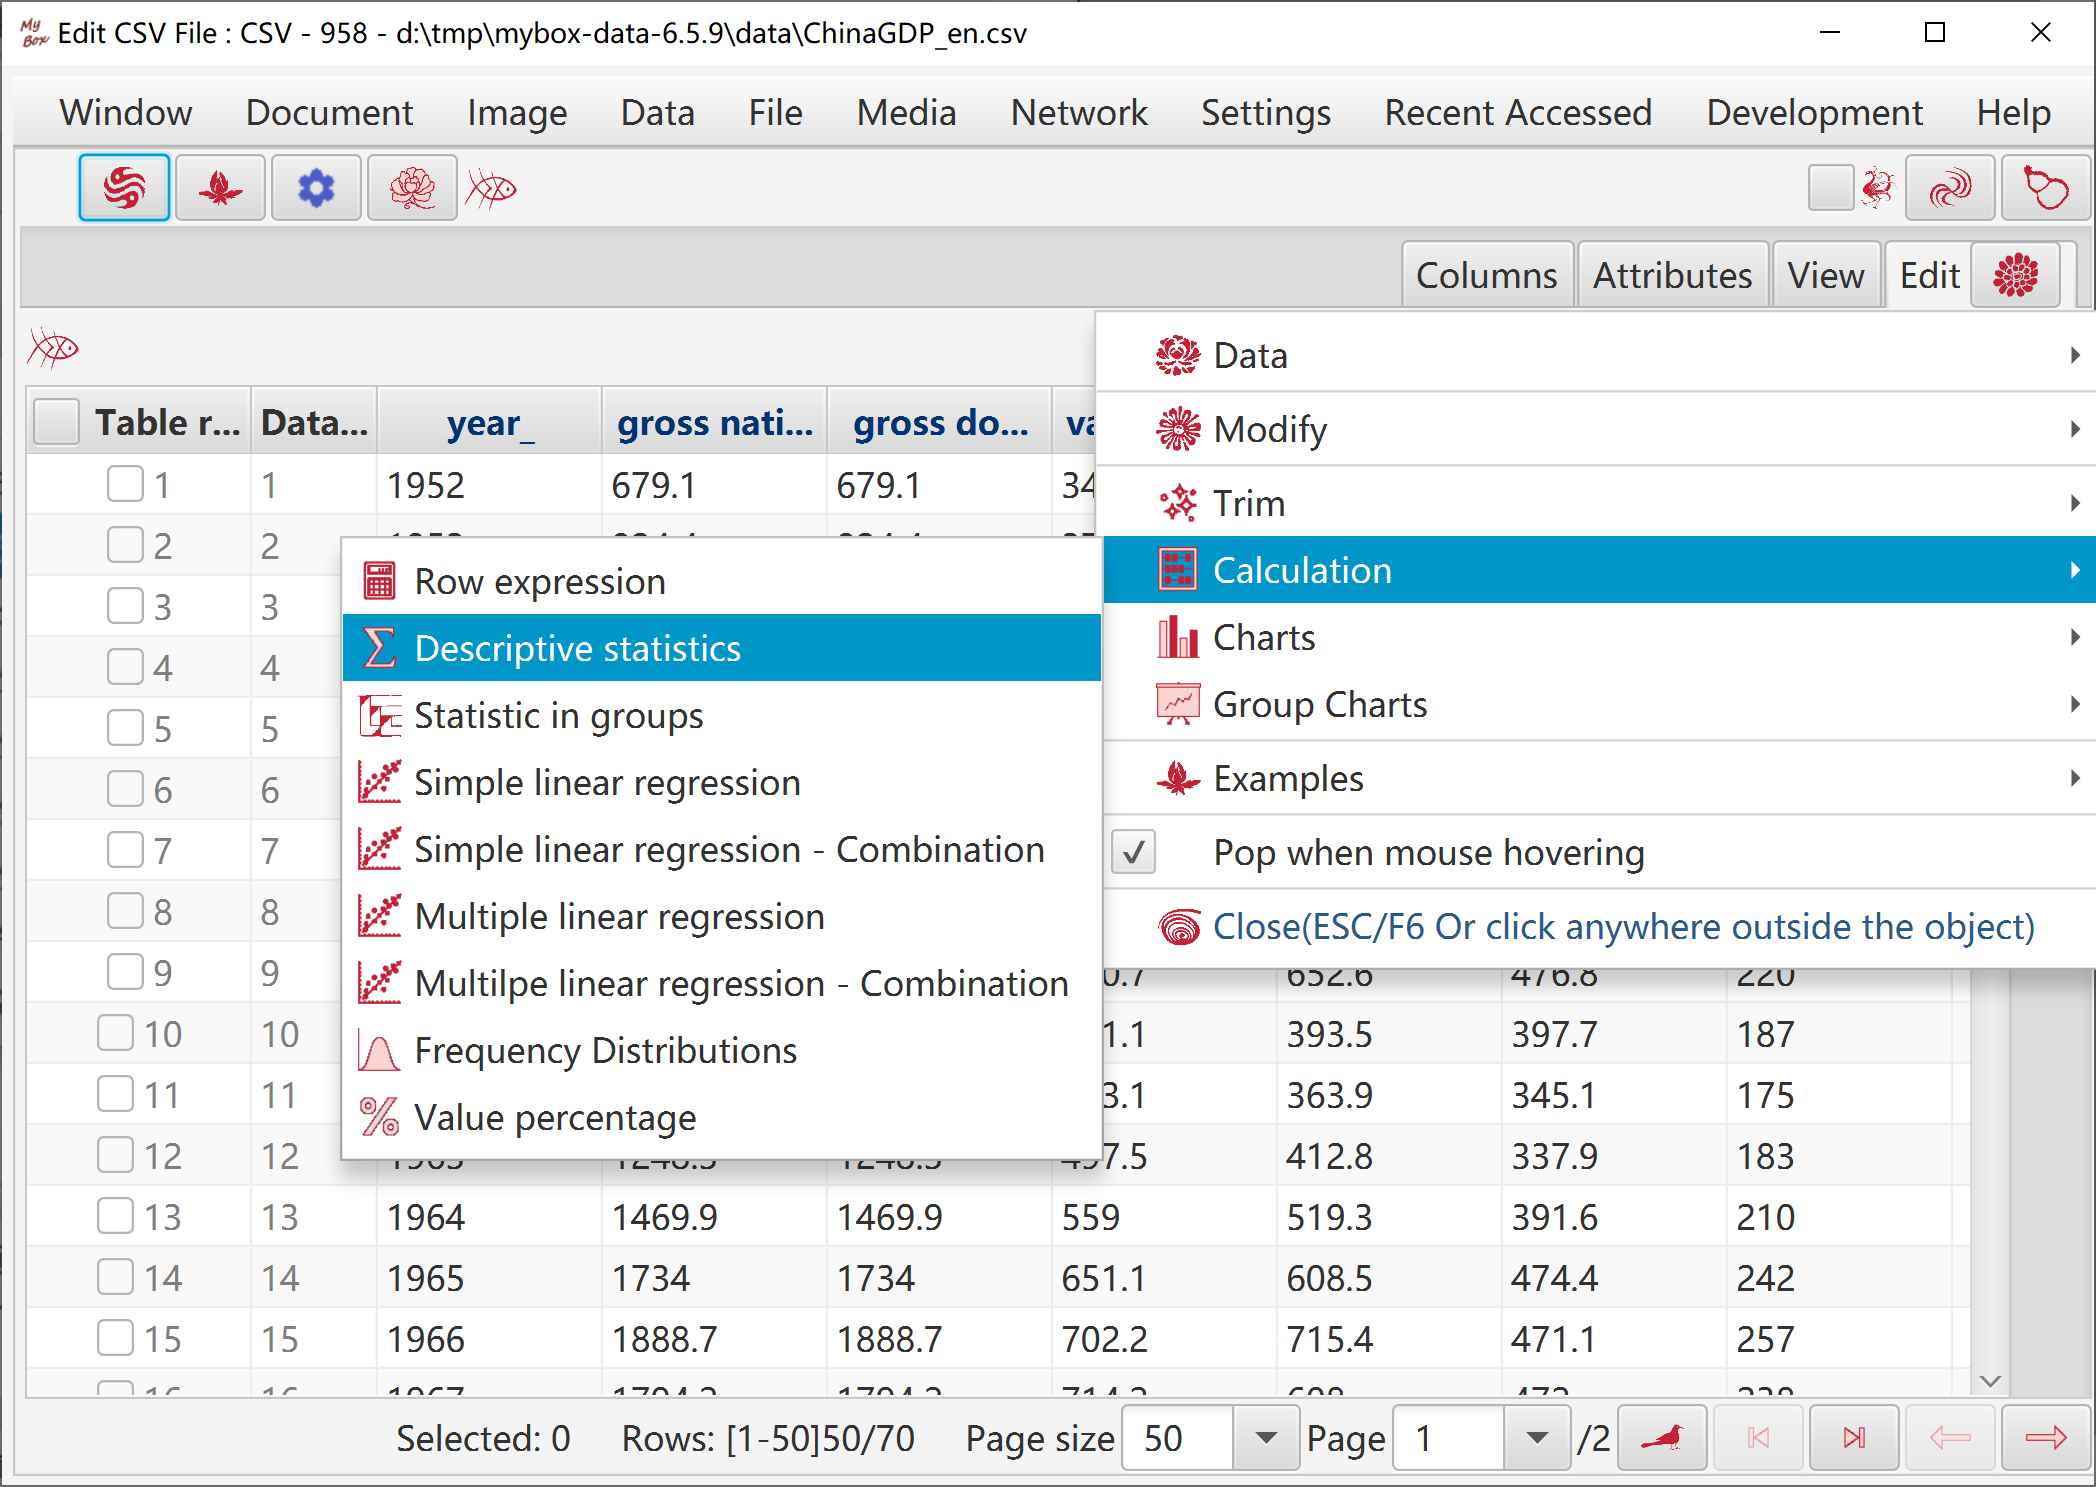
Select data row. Data filter can be set.
Select columns to be copied.
Input row expression and its name.
Results can be written as external data, including: new csv/excel/text file, matrix, system clipboard, MyBox clipboard, database table, json, xml, html, or pdf.
When handle rows for current page or selected ones, results can be written in current page: insert, append, or replace data in defined location of the table.
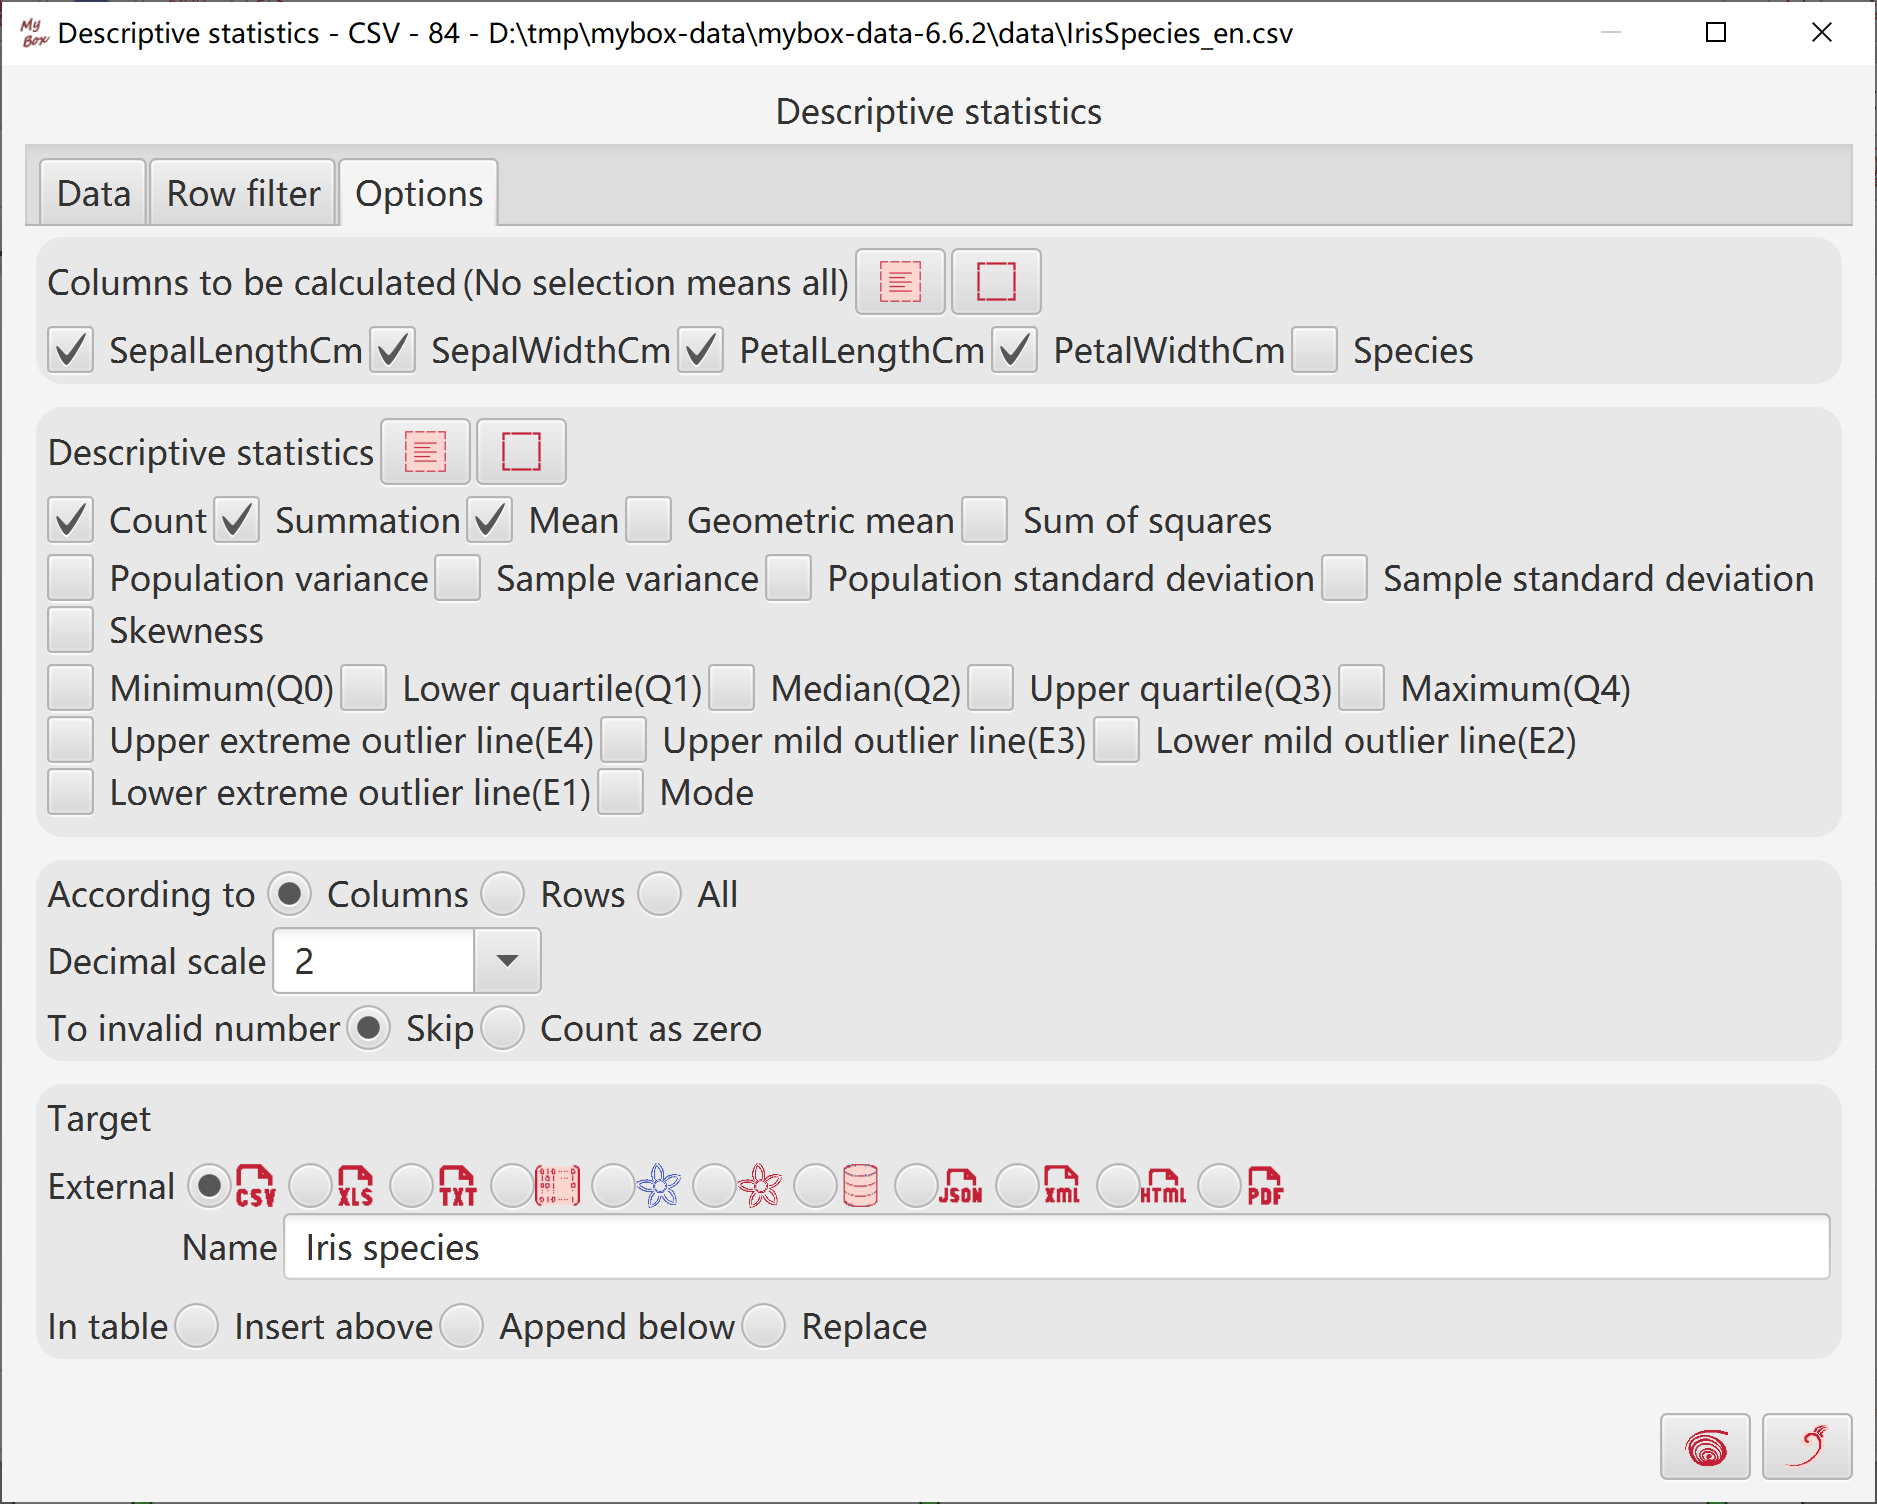
Select data rows. Data filter can be set.
Select columns to be calculated.
Select statistic items:
count, sum, mean, geometric mean, sum of squares, mode, skewness,
population variance, sample variance, population standard deviation, sample standard deviation,
minimum(Q0), lower quartile(Q1), median(Q2), upper quartile(Q3), maximum(Q4),
upper extreme outlier line(E4), upper mild outlier line(E3), lower mild outlier line(E2), lower extreme outlier line(E1)
Select objects: Accroding to columns/rows/all.
Set decimal scale.
To non-numeric: skip or count as zero
Results can be written as external data, including: new csv/excel/text file, matrix, system clipboard, MyBox clipboard, database table, json, xml, html, or pdf.
When handle rows for current page or selected ones, results can be written in current page: insert, append, or replace data in defined location of the table.
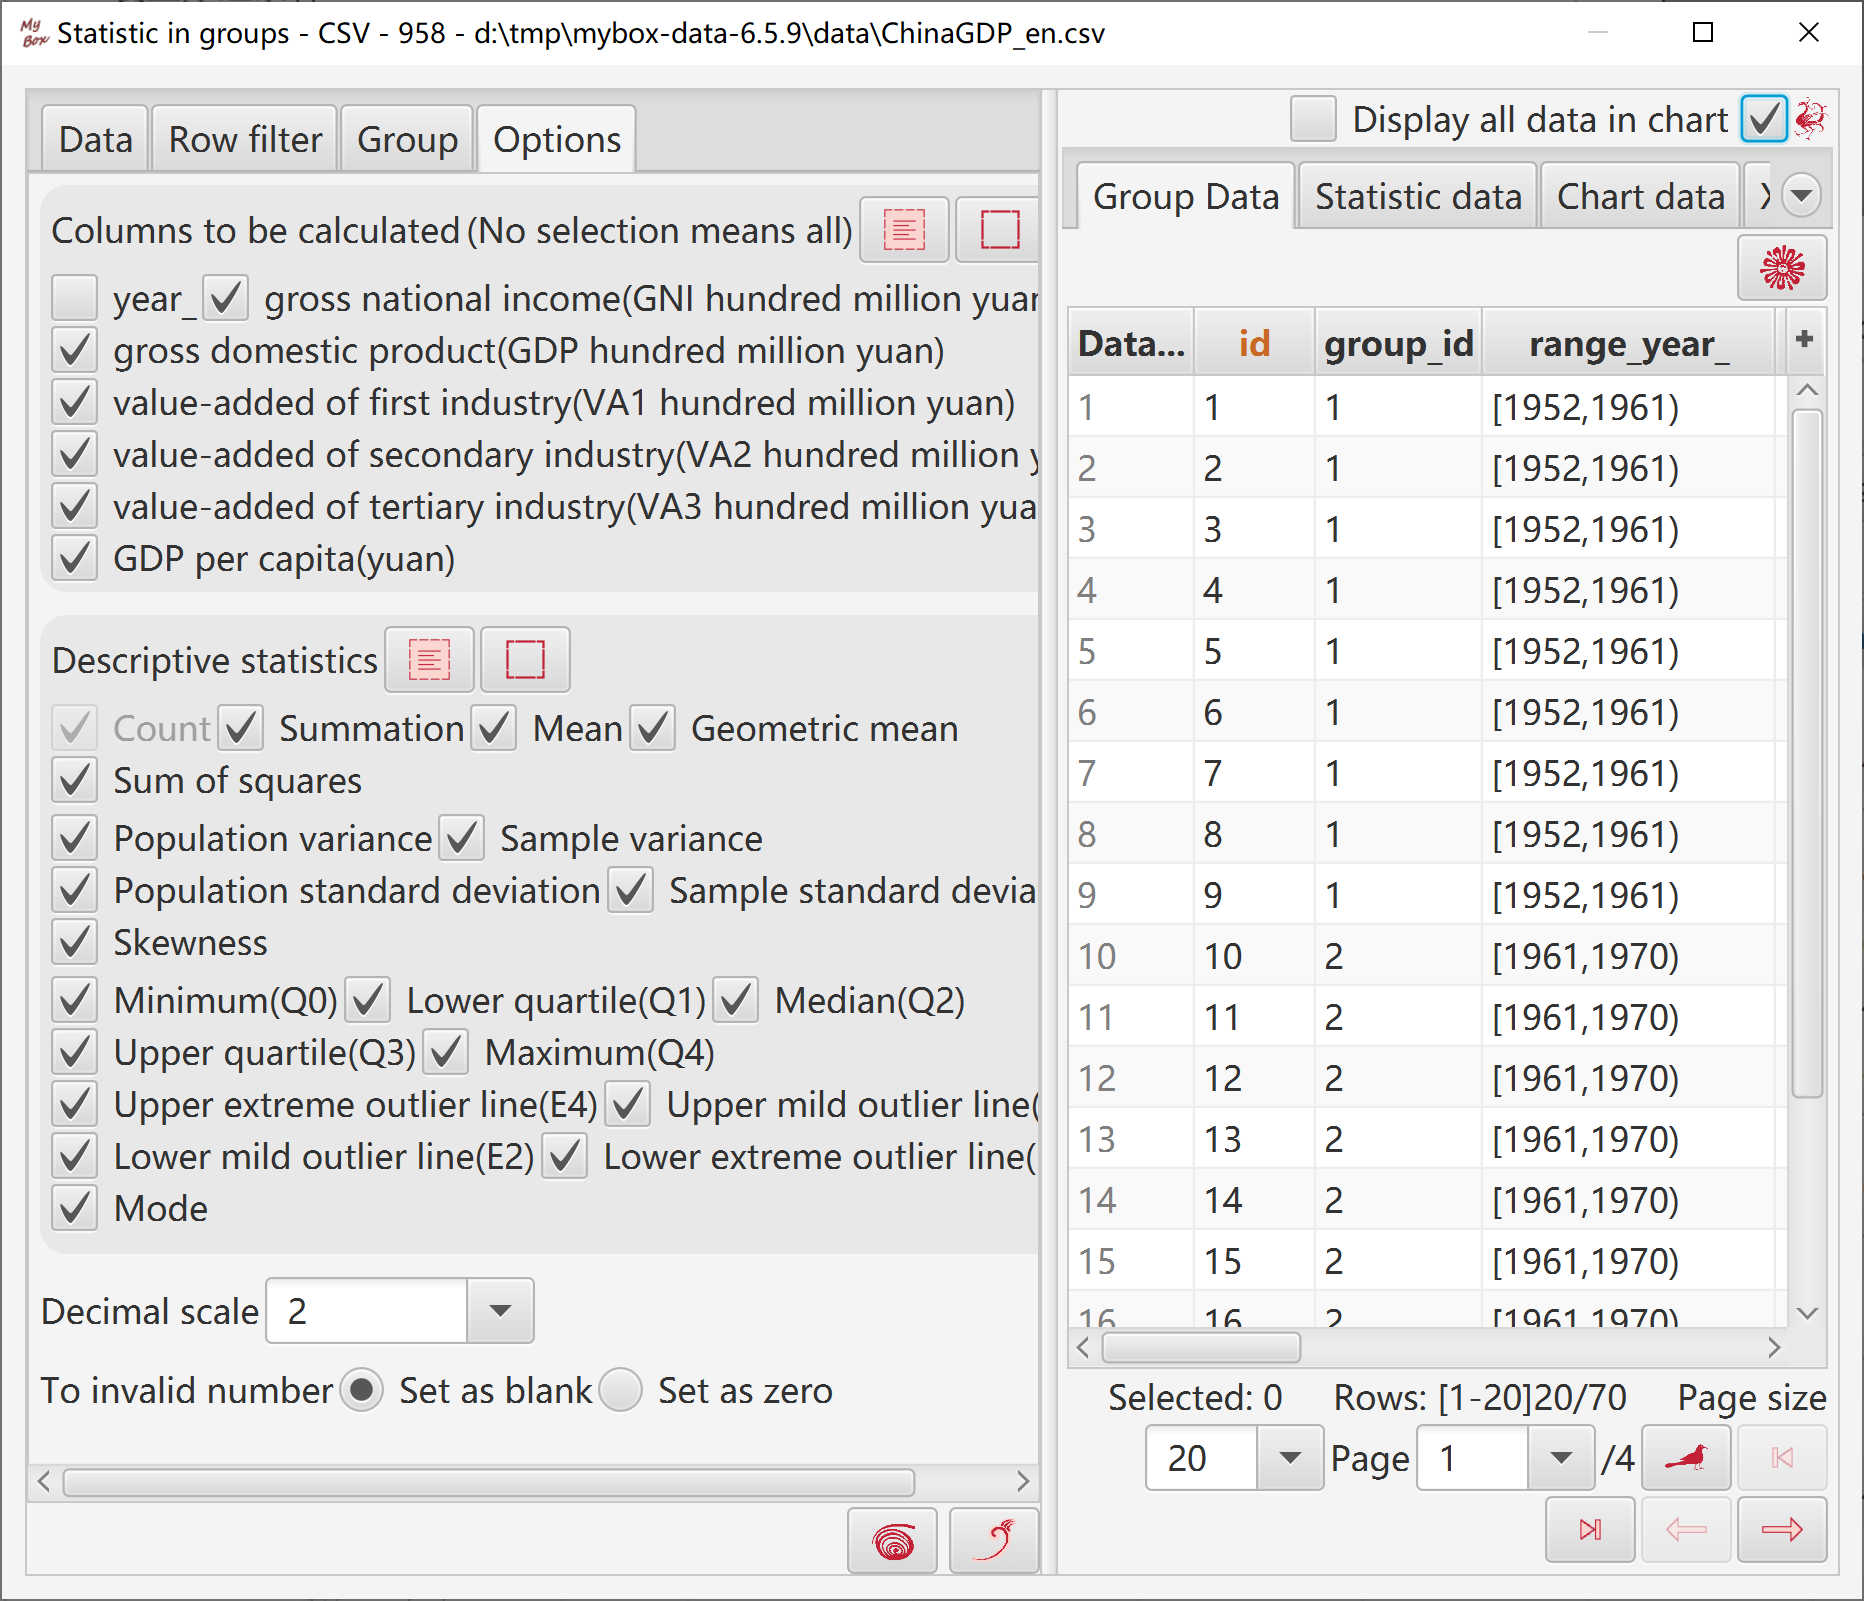
Select data rows. Data filter can be set.
Set parameters of grouping.
Select columns to be calculated.
Select statistic items. “Count” is always selected.
Set decimal scale.
To invalid numbers: set as blank or zero.
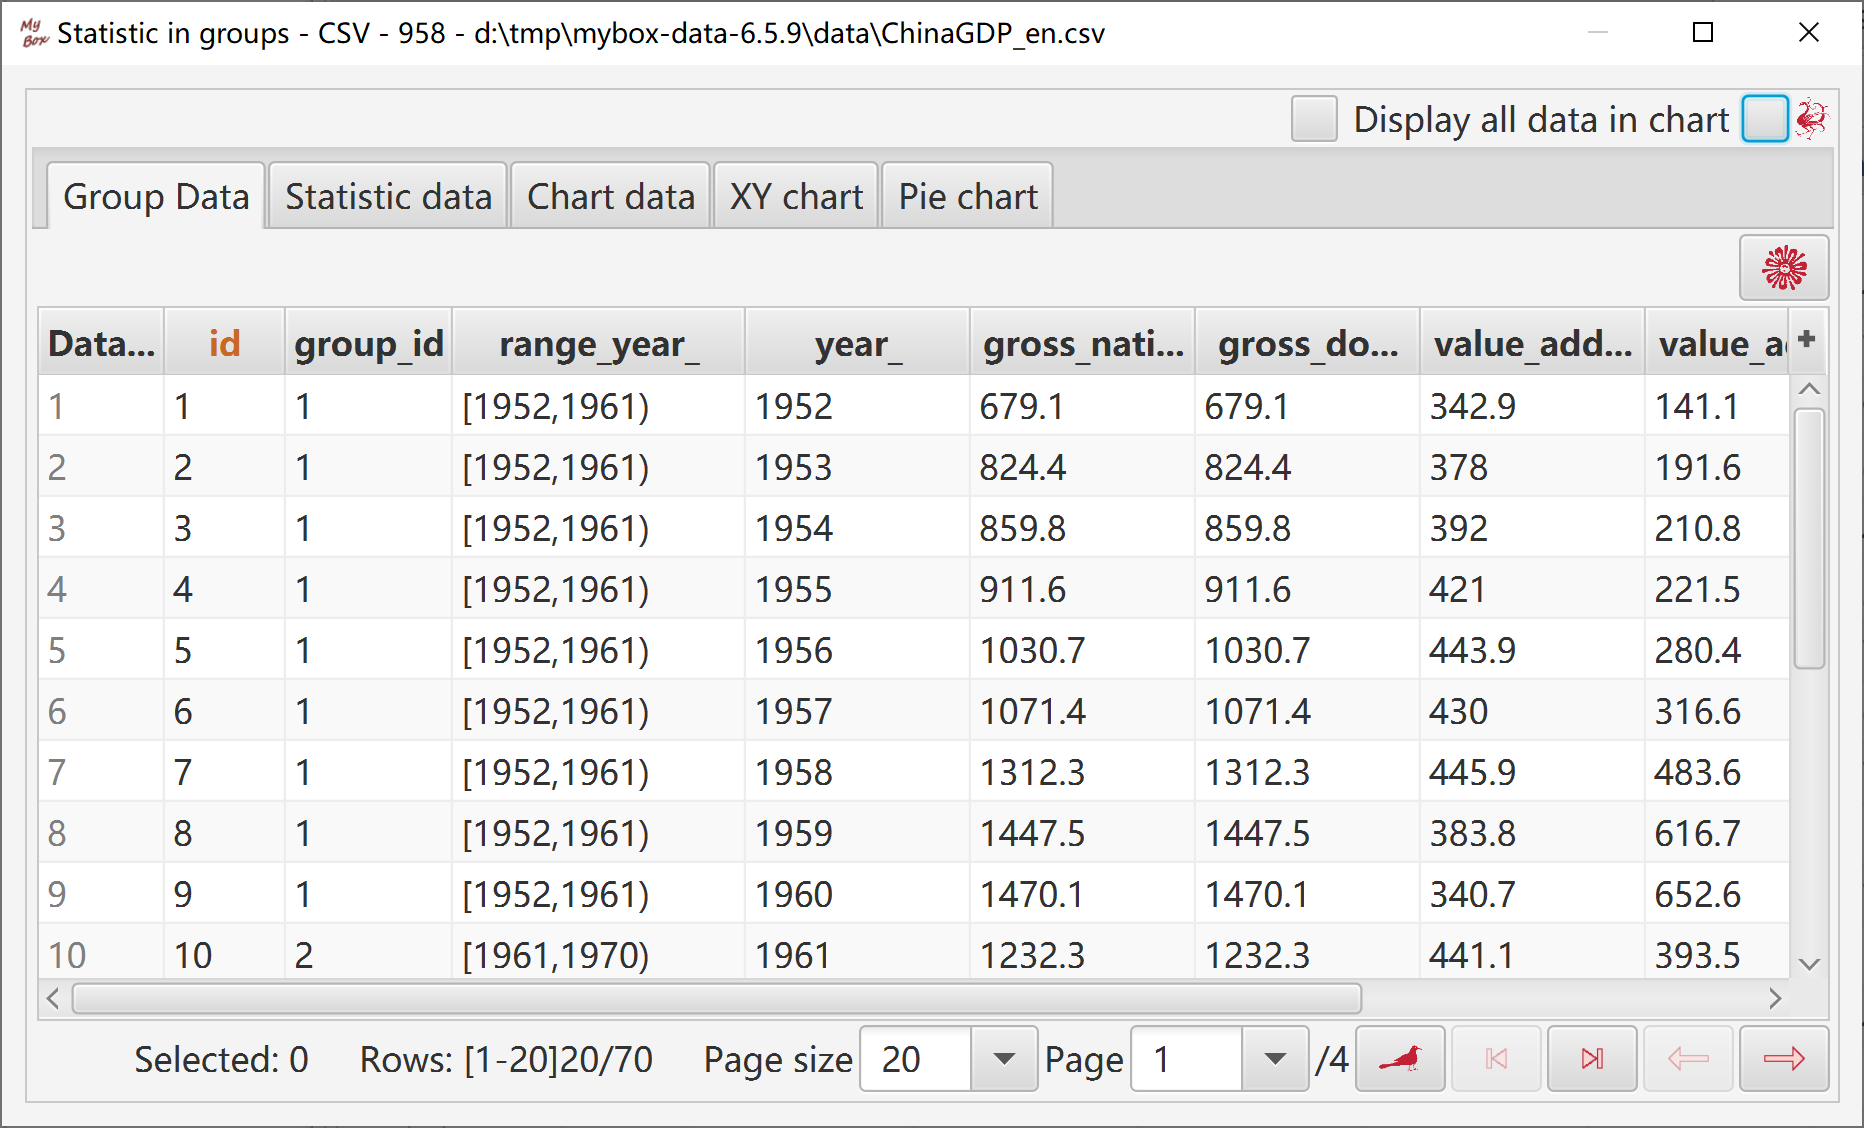
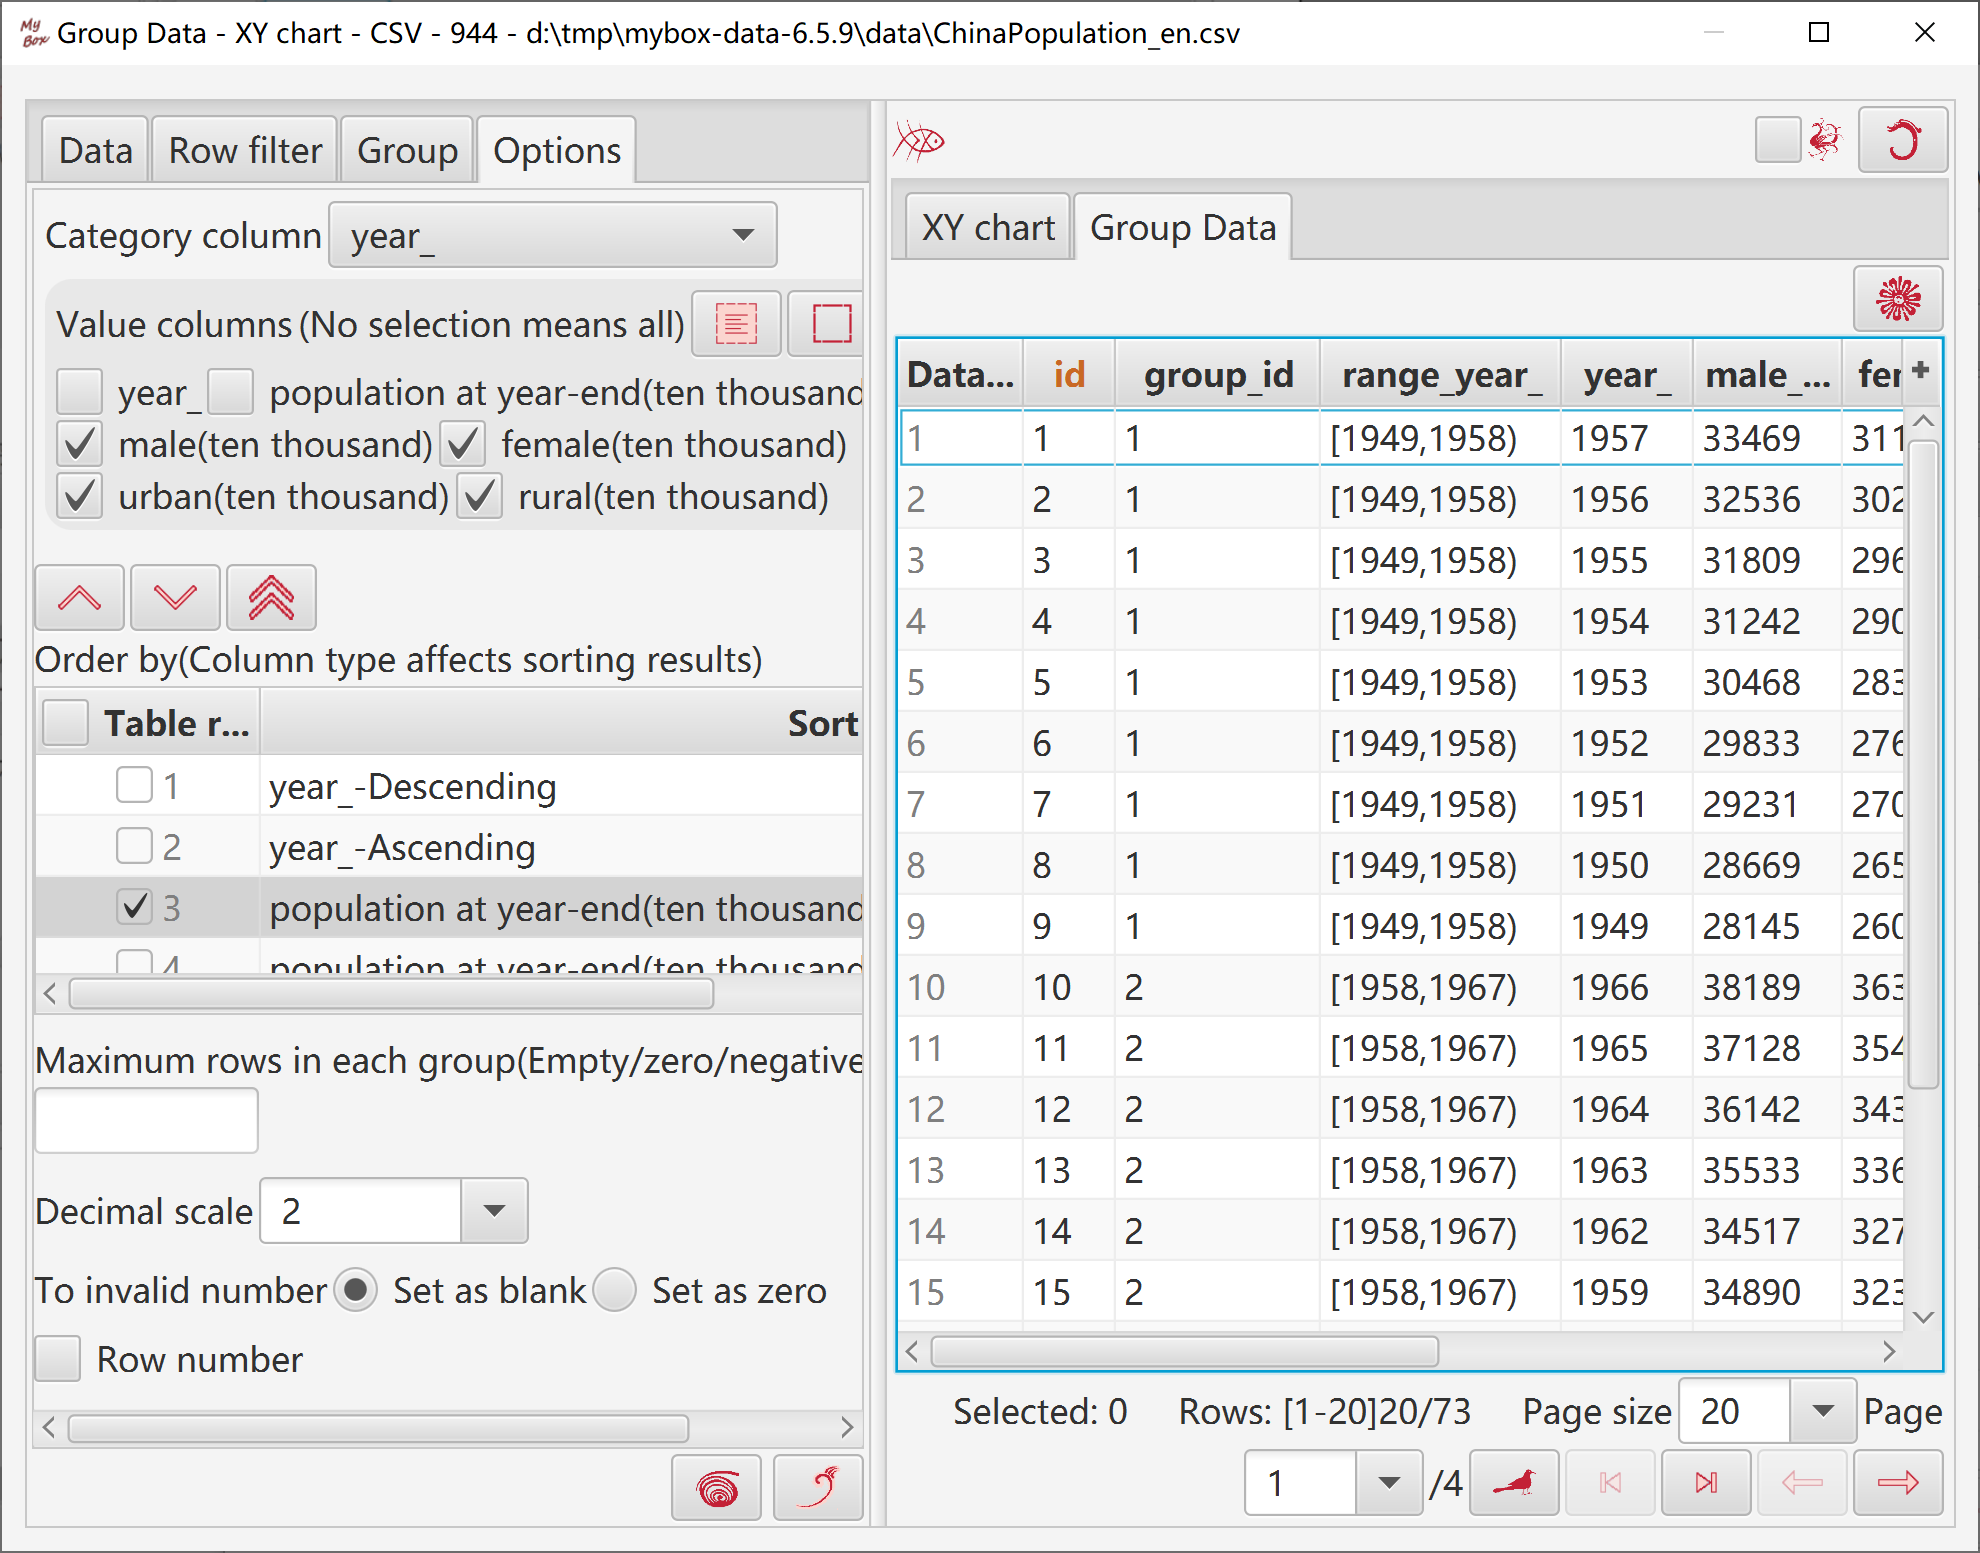
After data are grouped, 2 columns are added: “Group id”, “Group Parameter”.
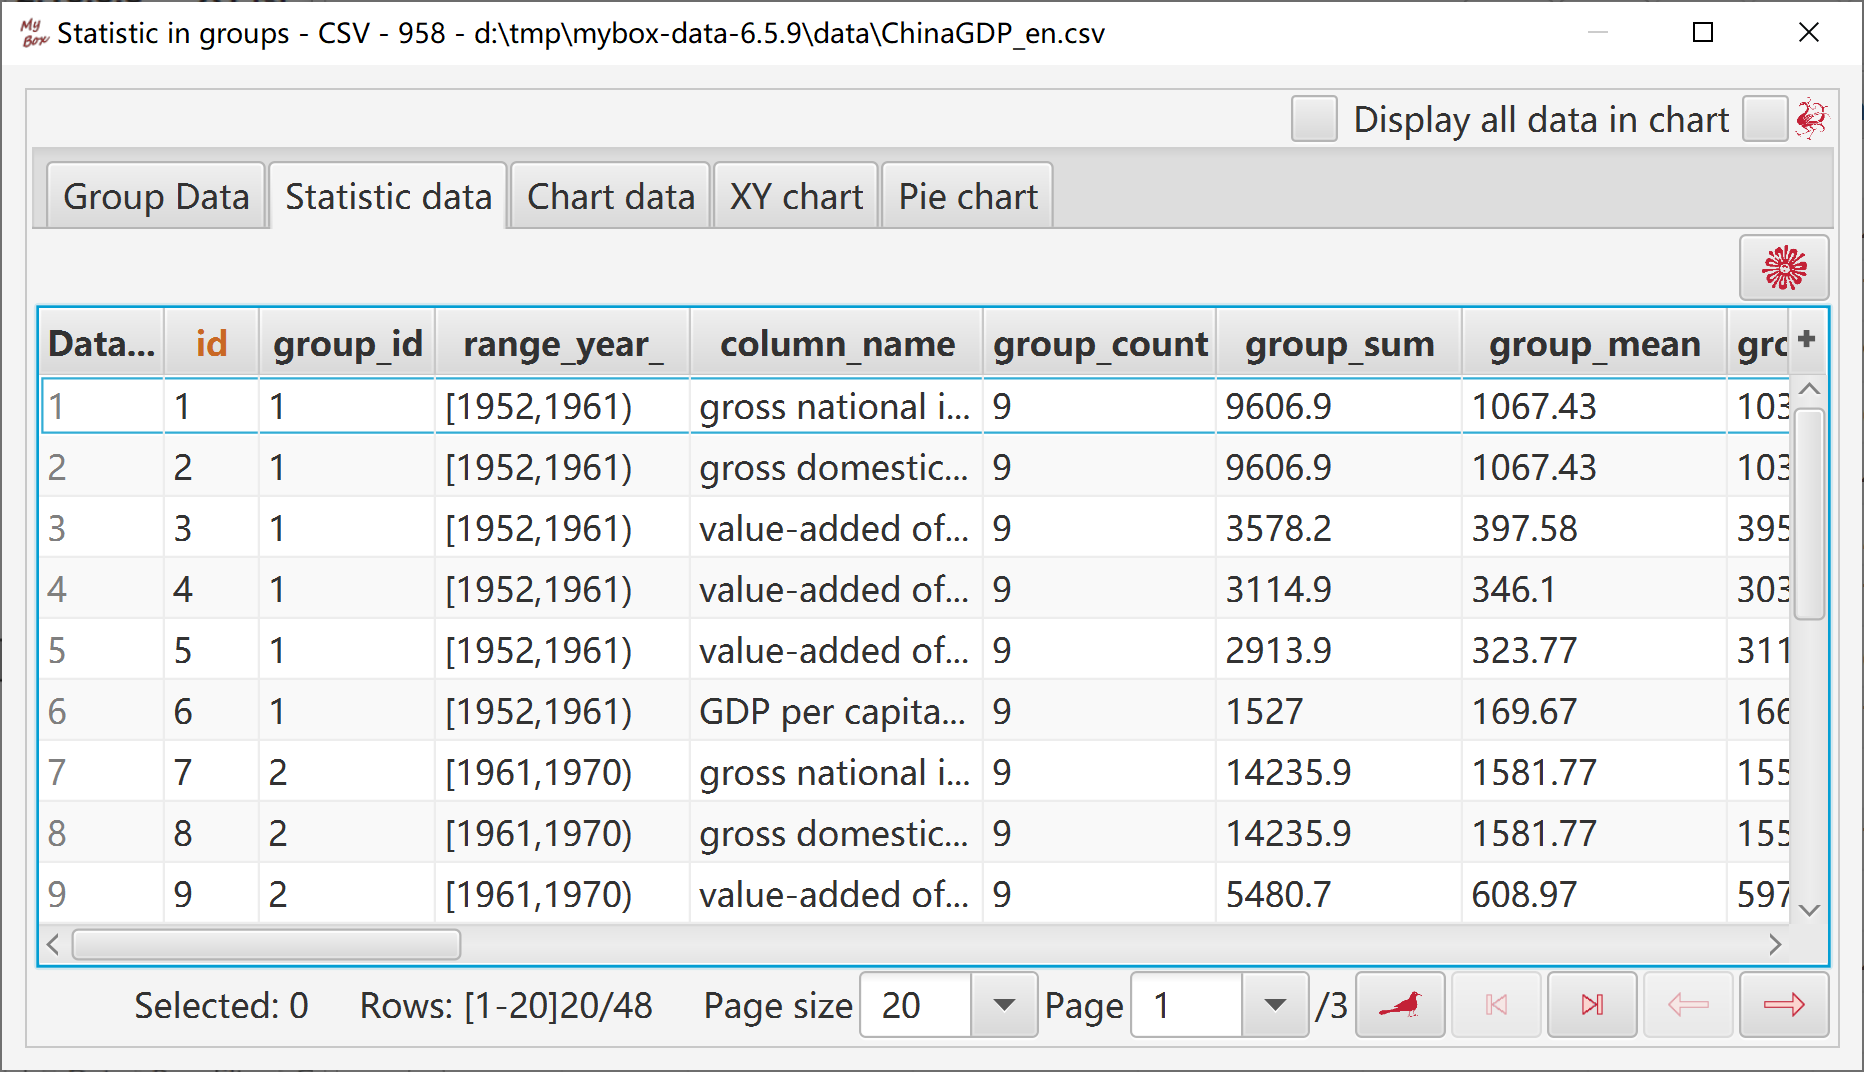
Based on grouped data, calculate statistic values for each group.
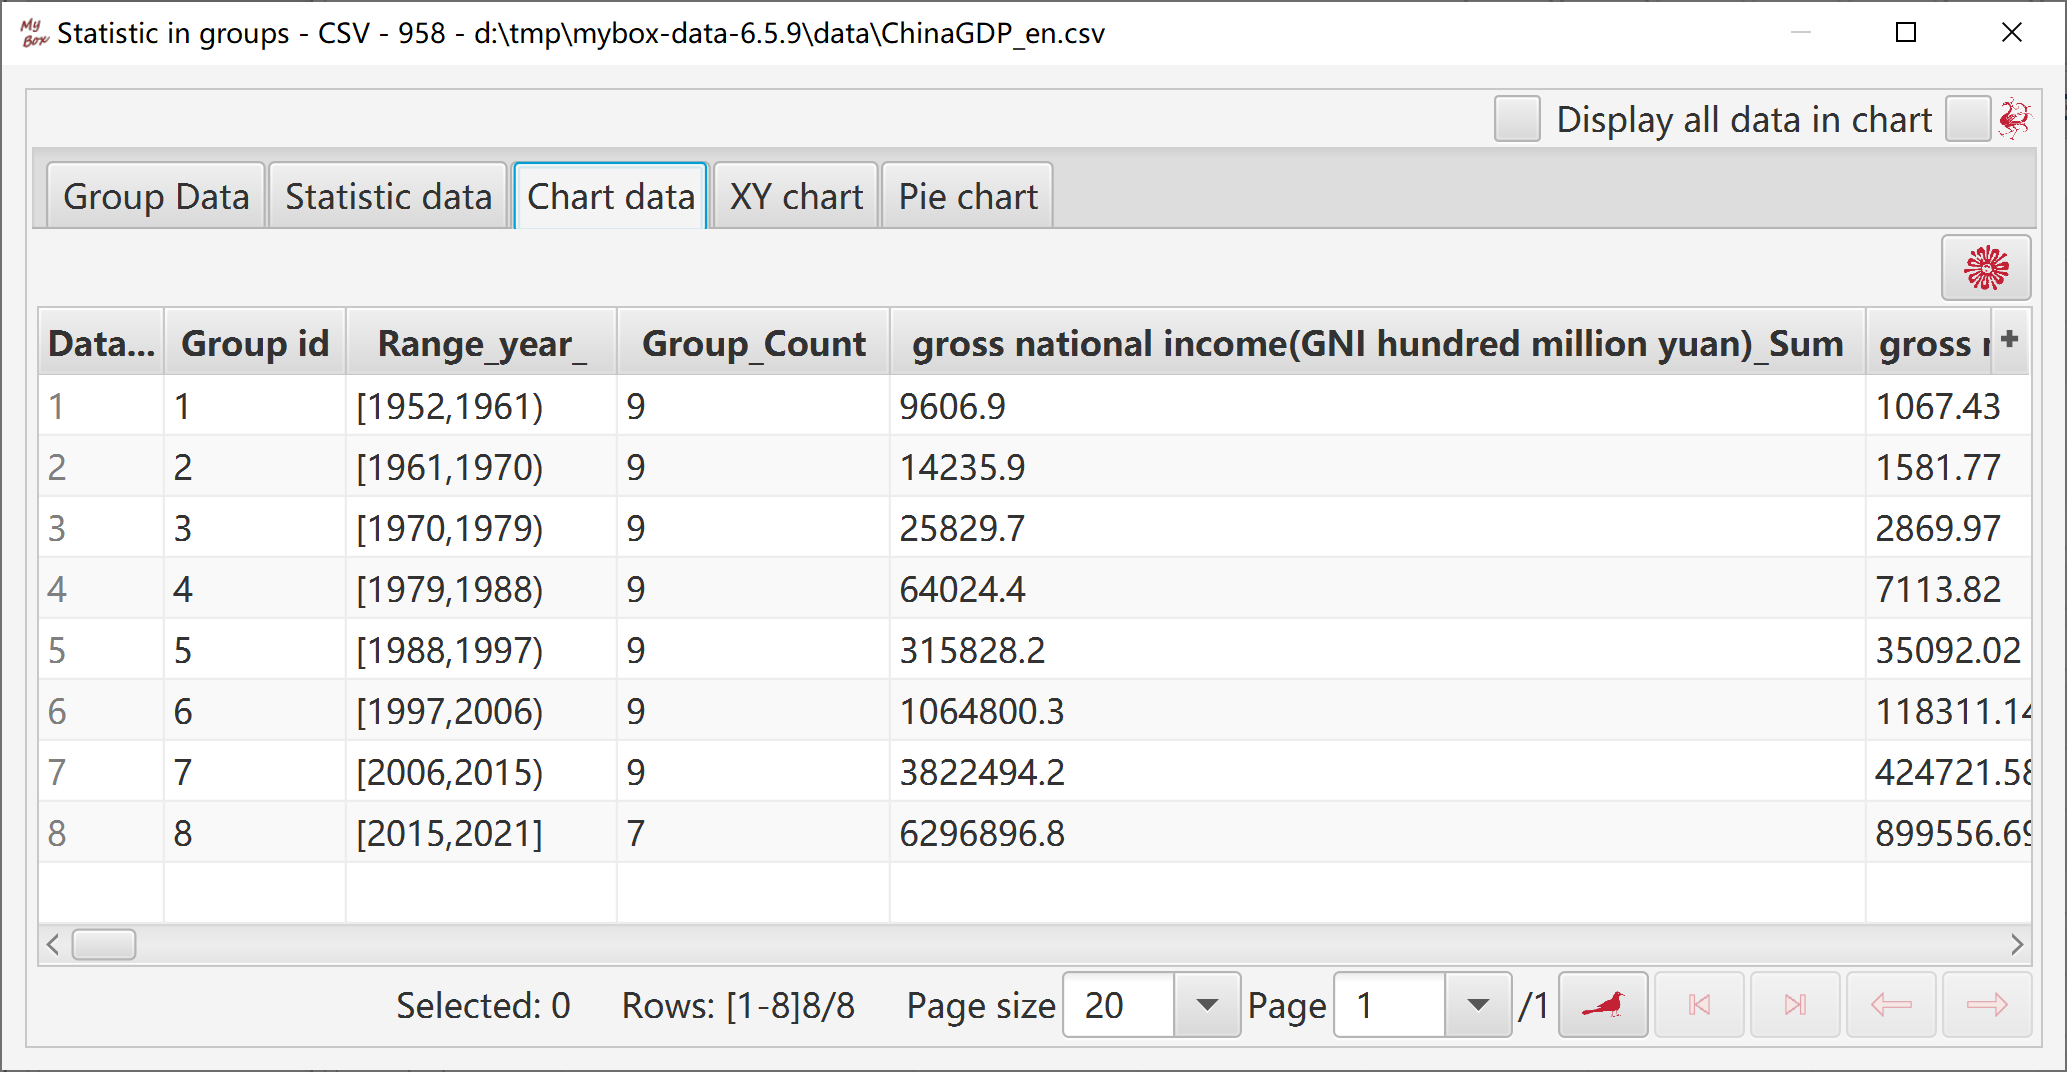
Statistic data are trimmed into columns and rows for chart.
If select “Display all data in chart”, then data of all pages are displayed in chart. Or else only data of current page are disaplyed in the chart.
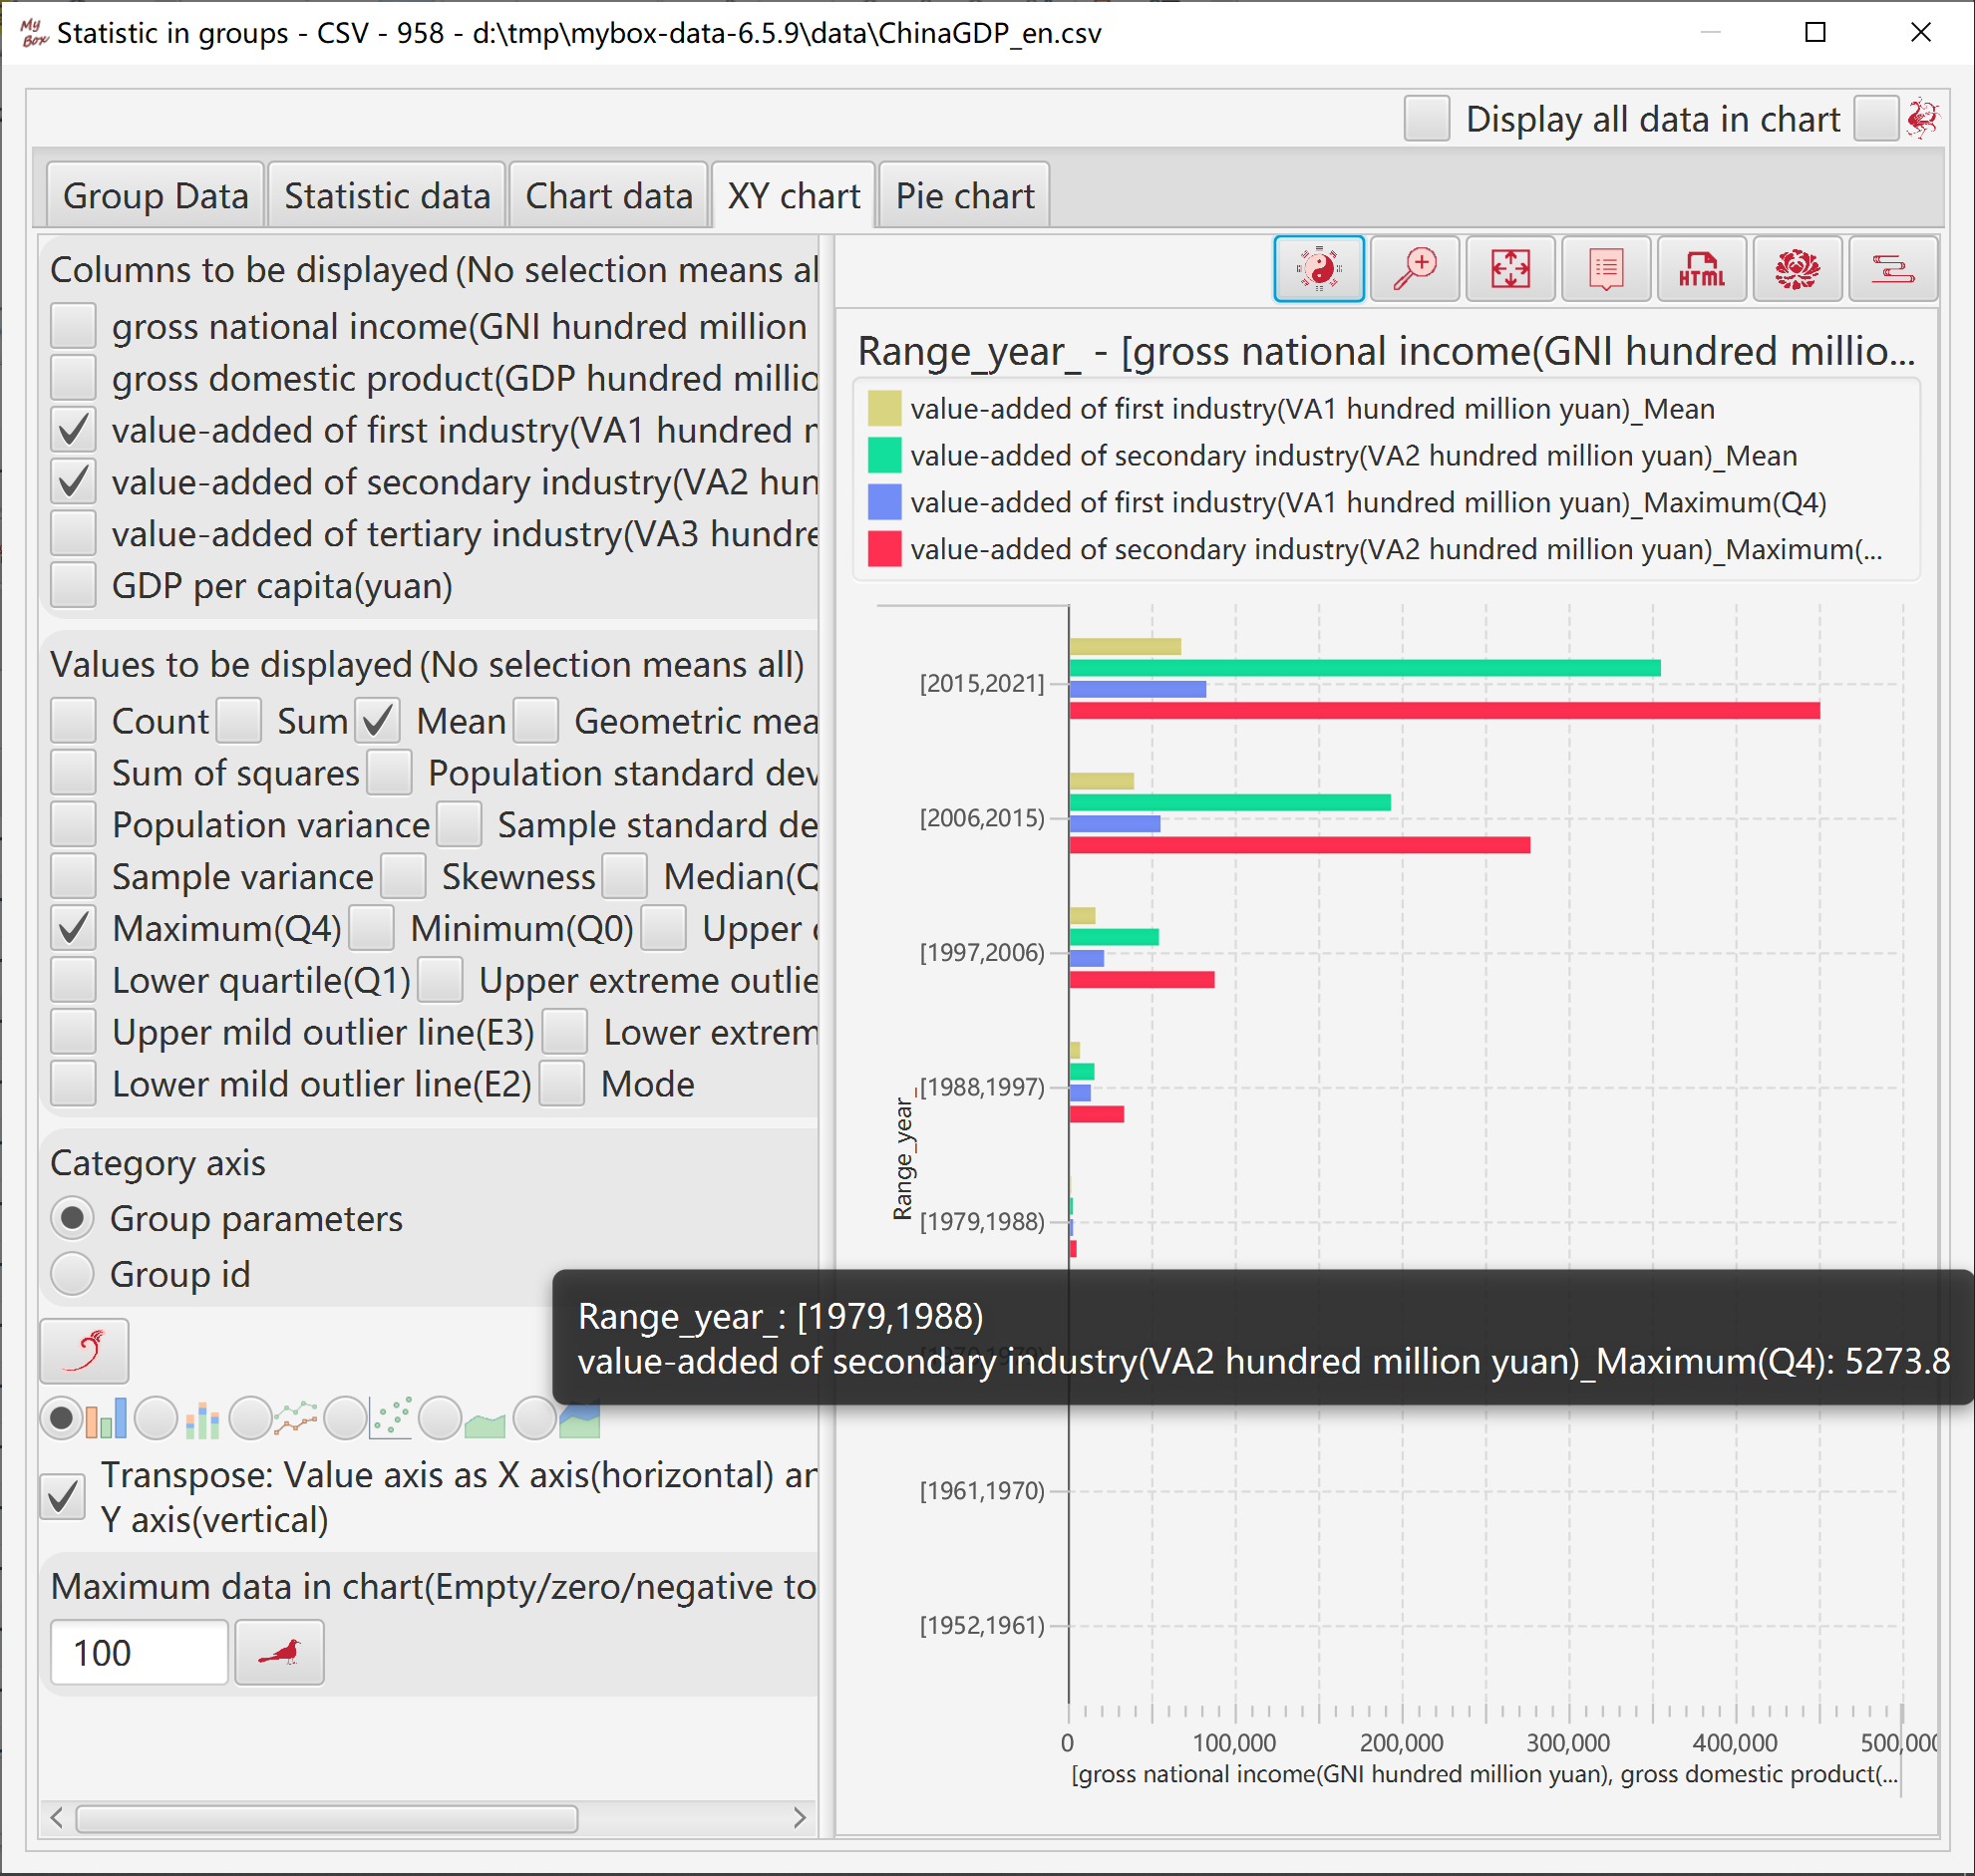
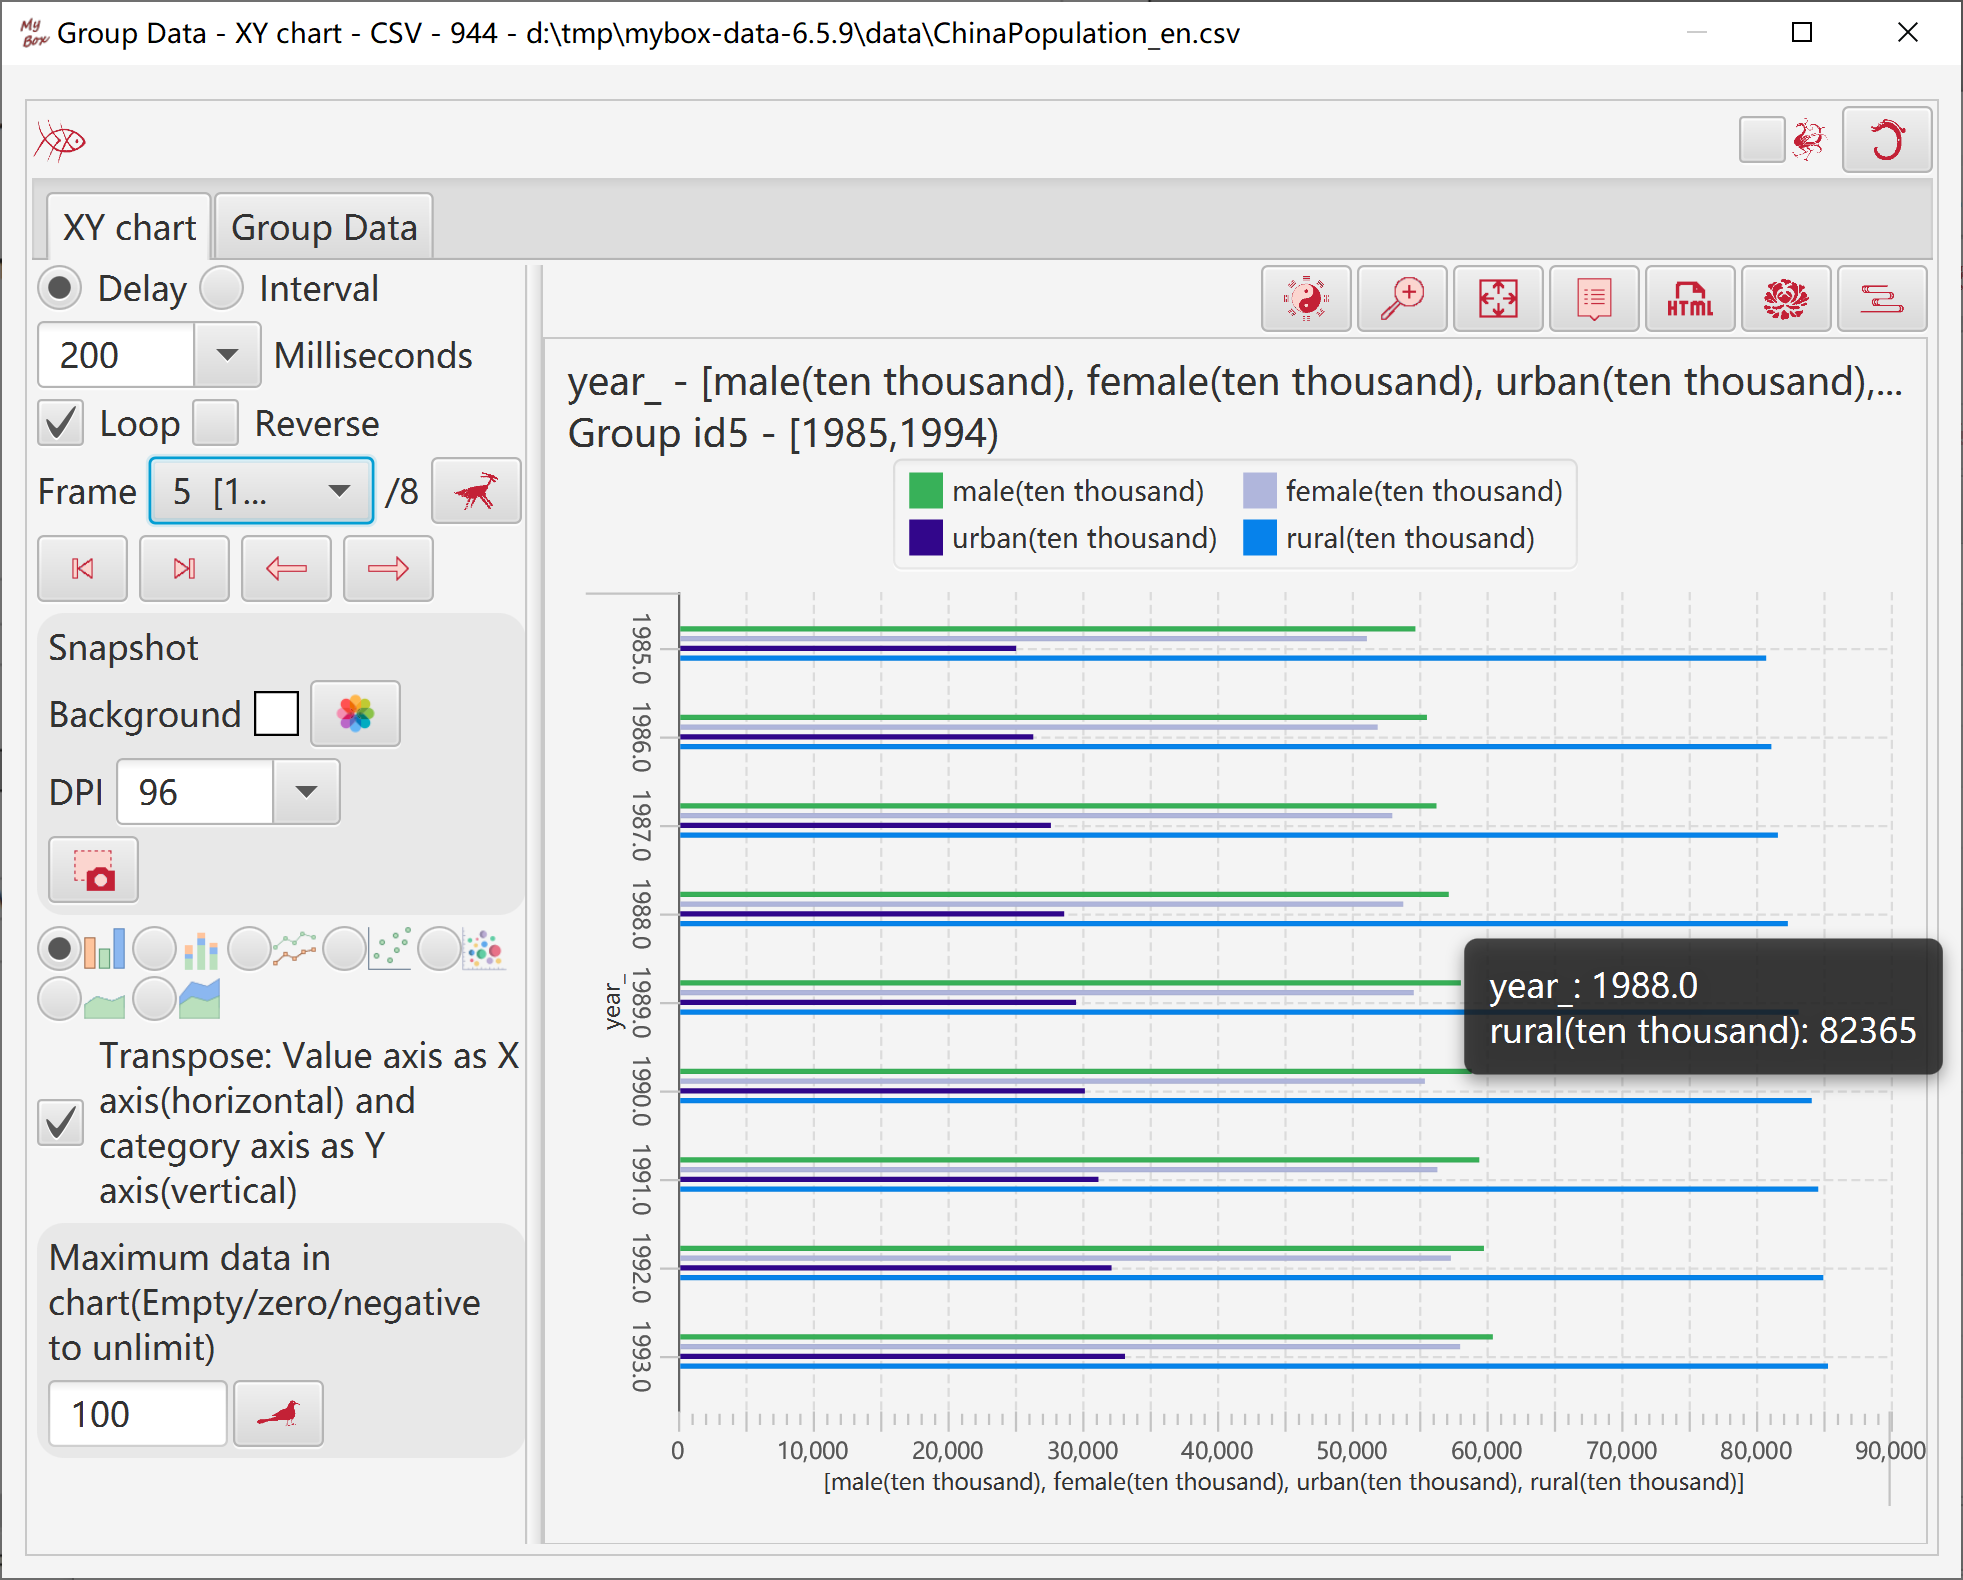
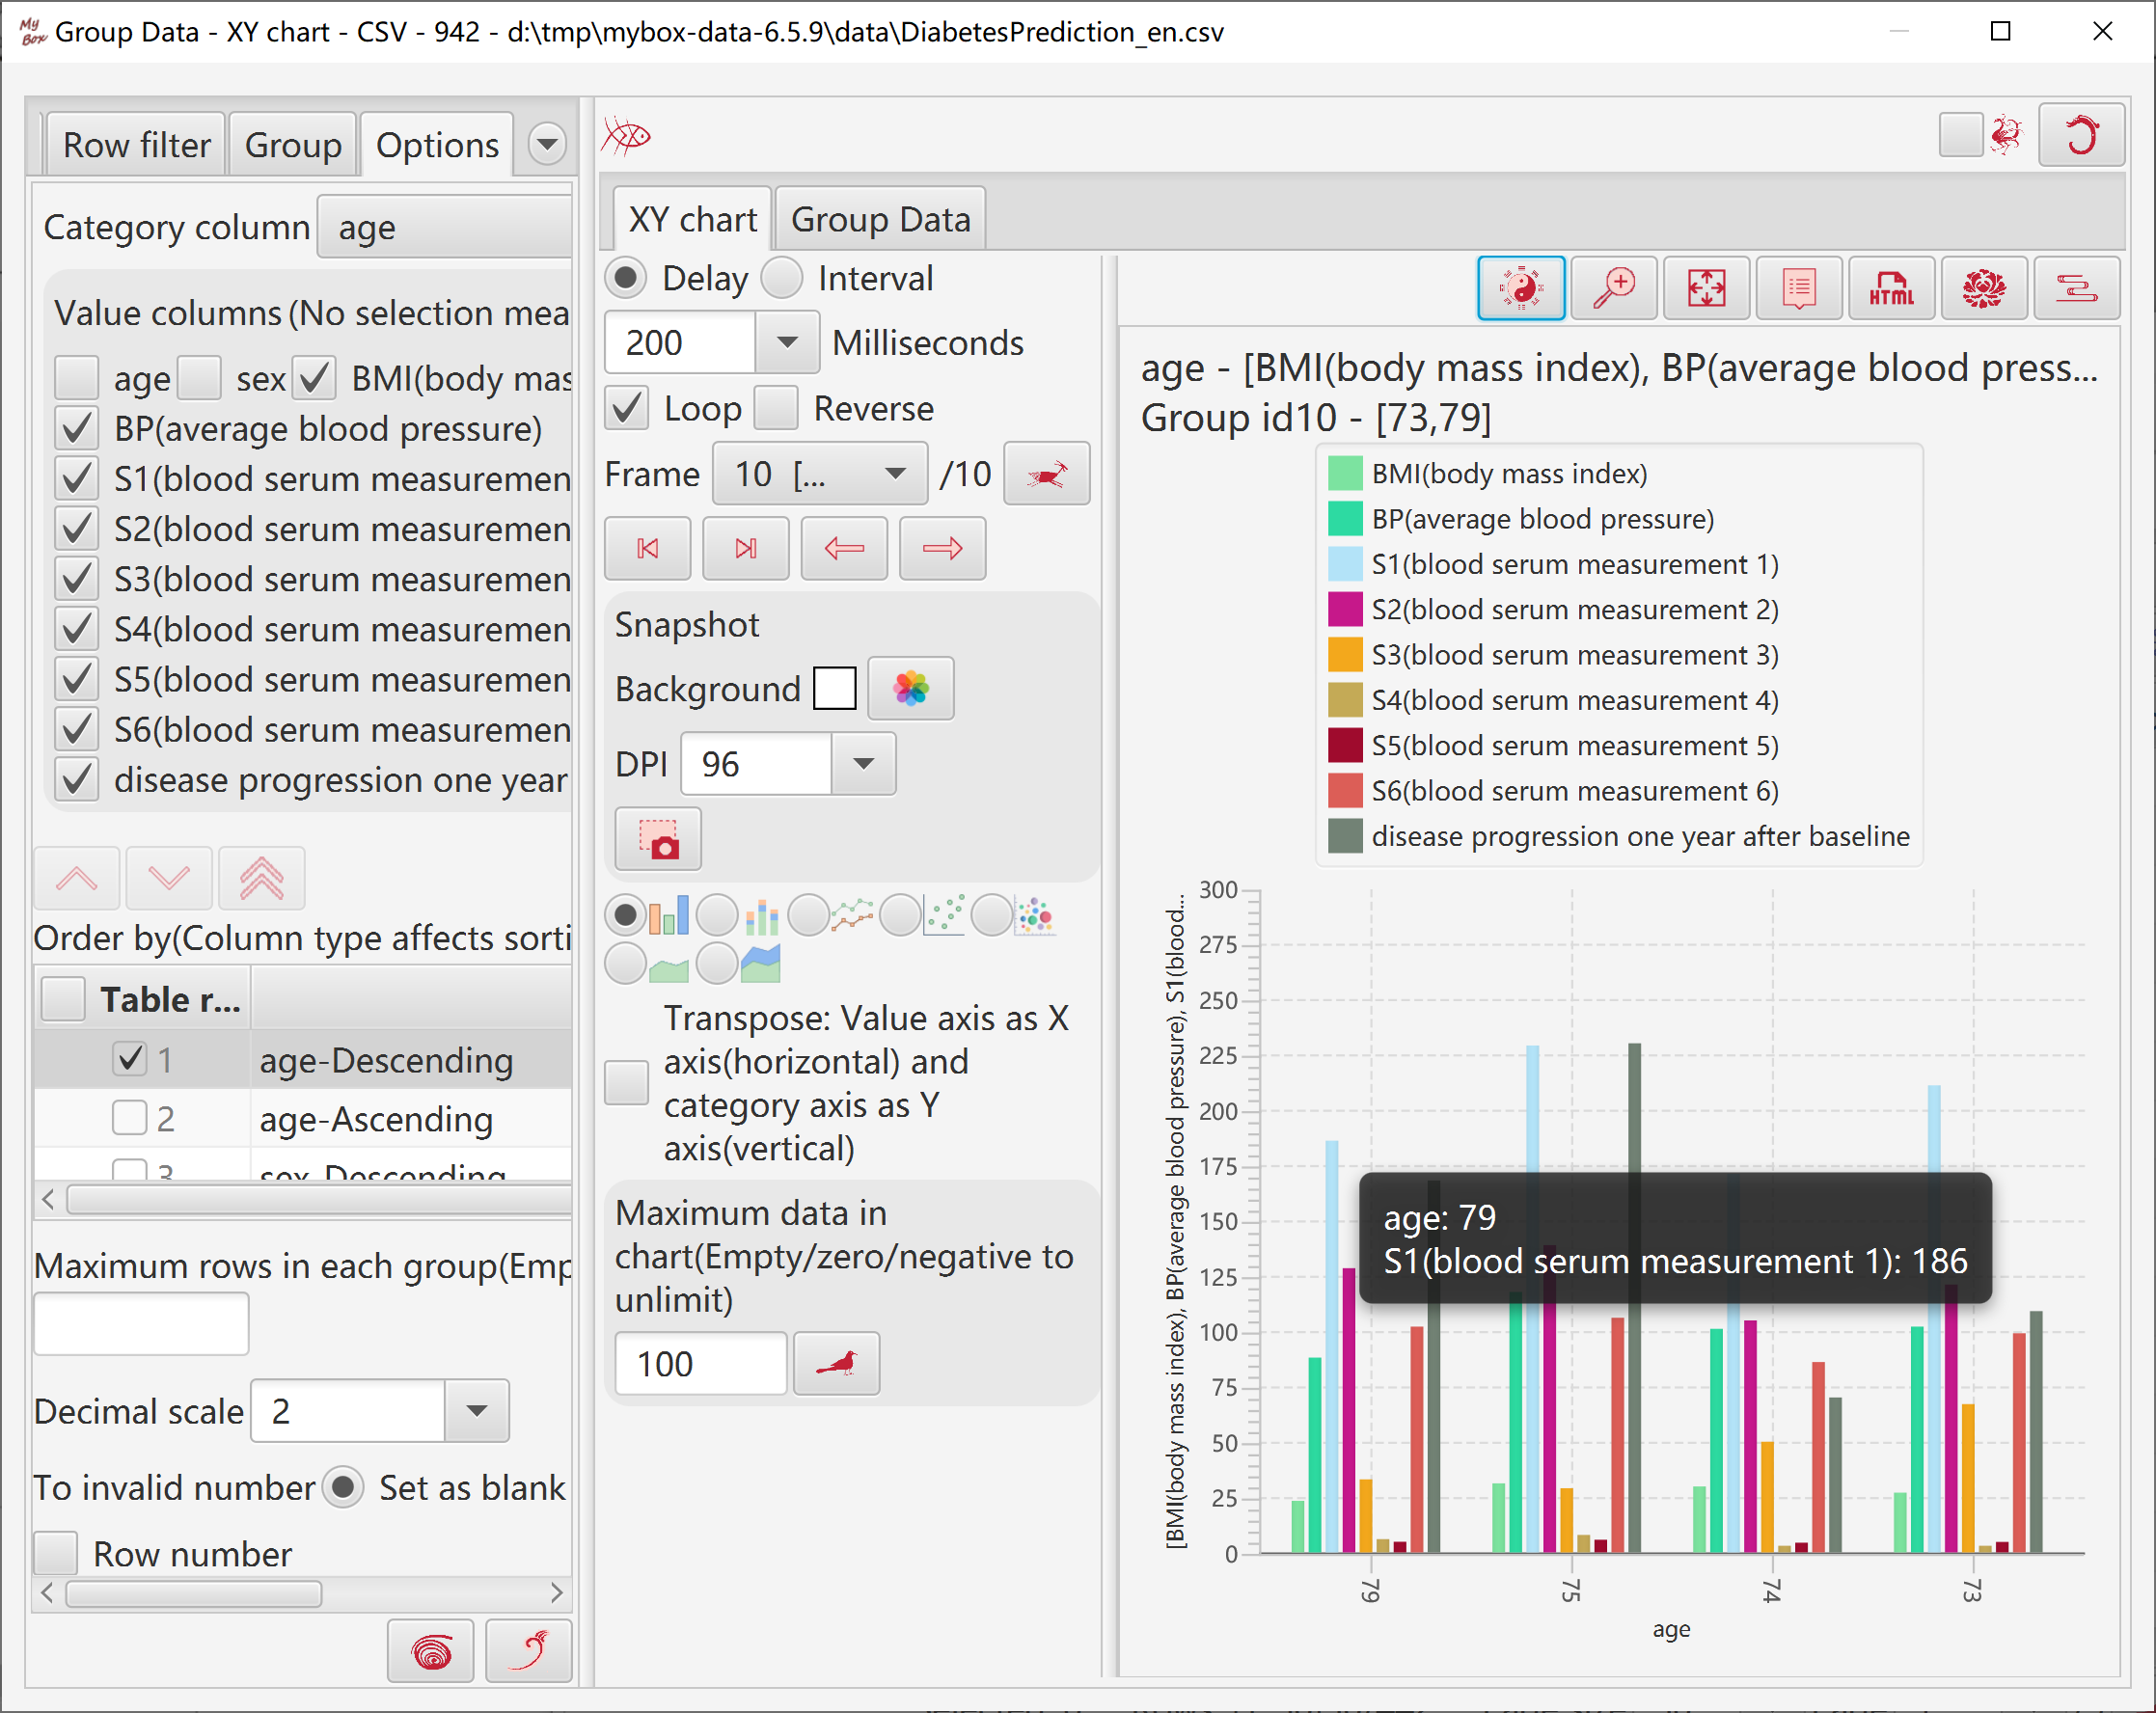
Statistic data of groups can be displayed as XY chart:
Select columns to be displayed
Select statistic values to be displayed.
Select category axis: group parameter, or group id.
Select type of XY chart.
Select whether transpose the chart.
Set maximum data number in the chart.
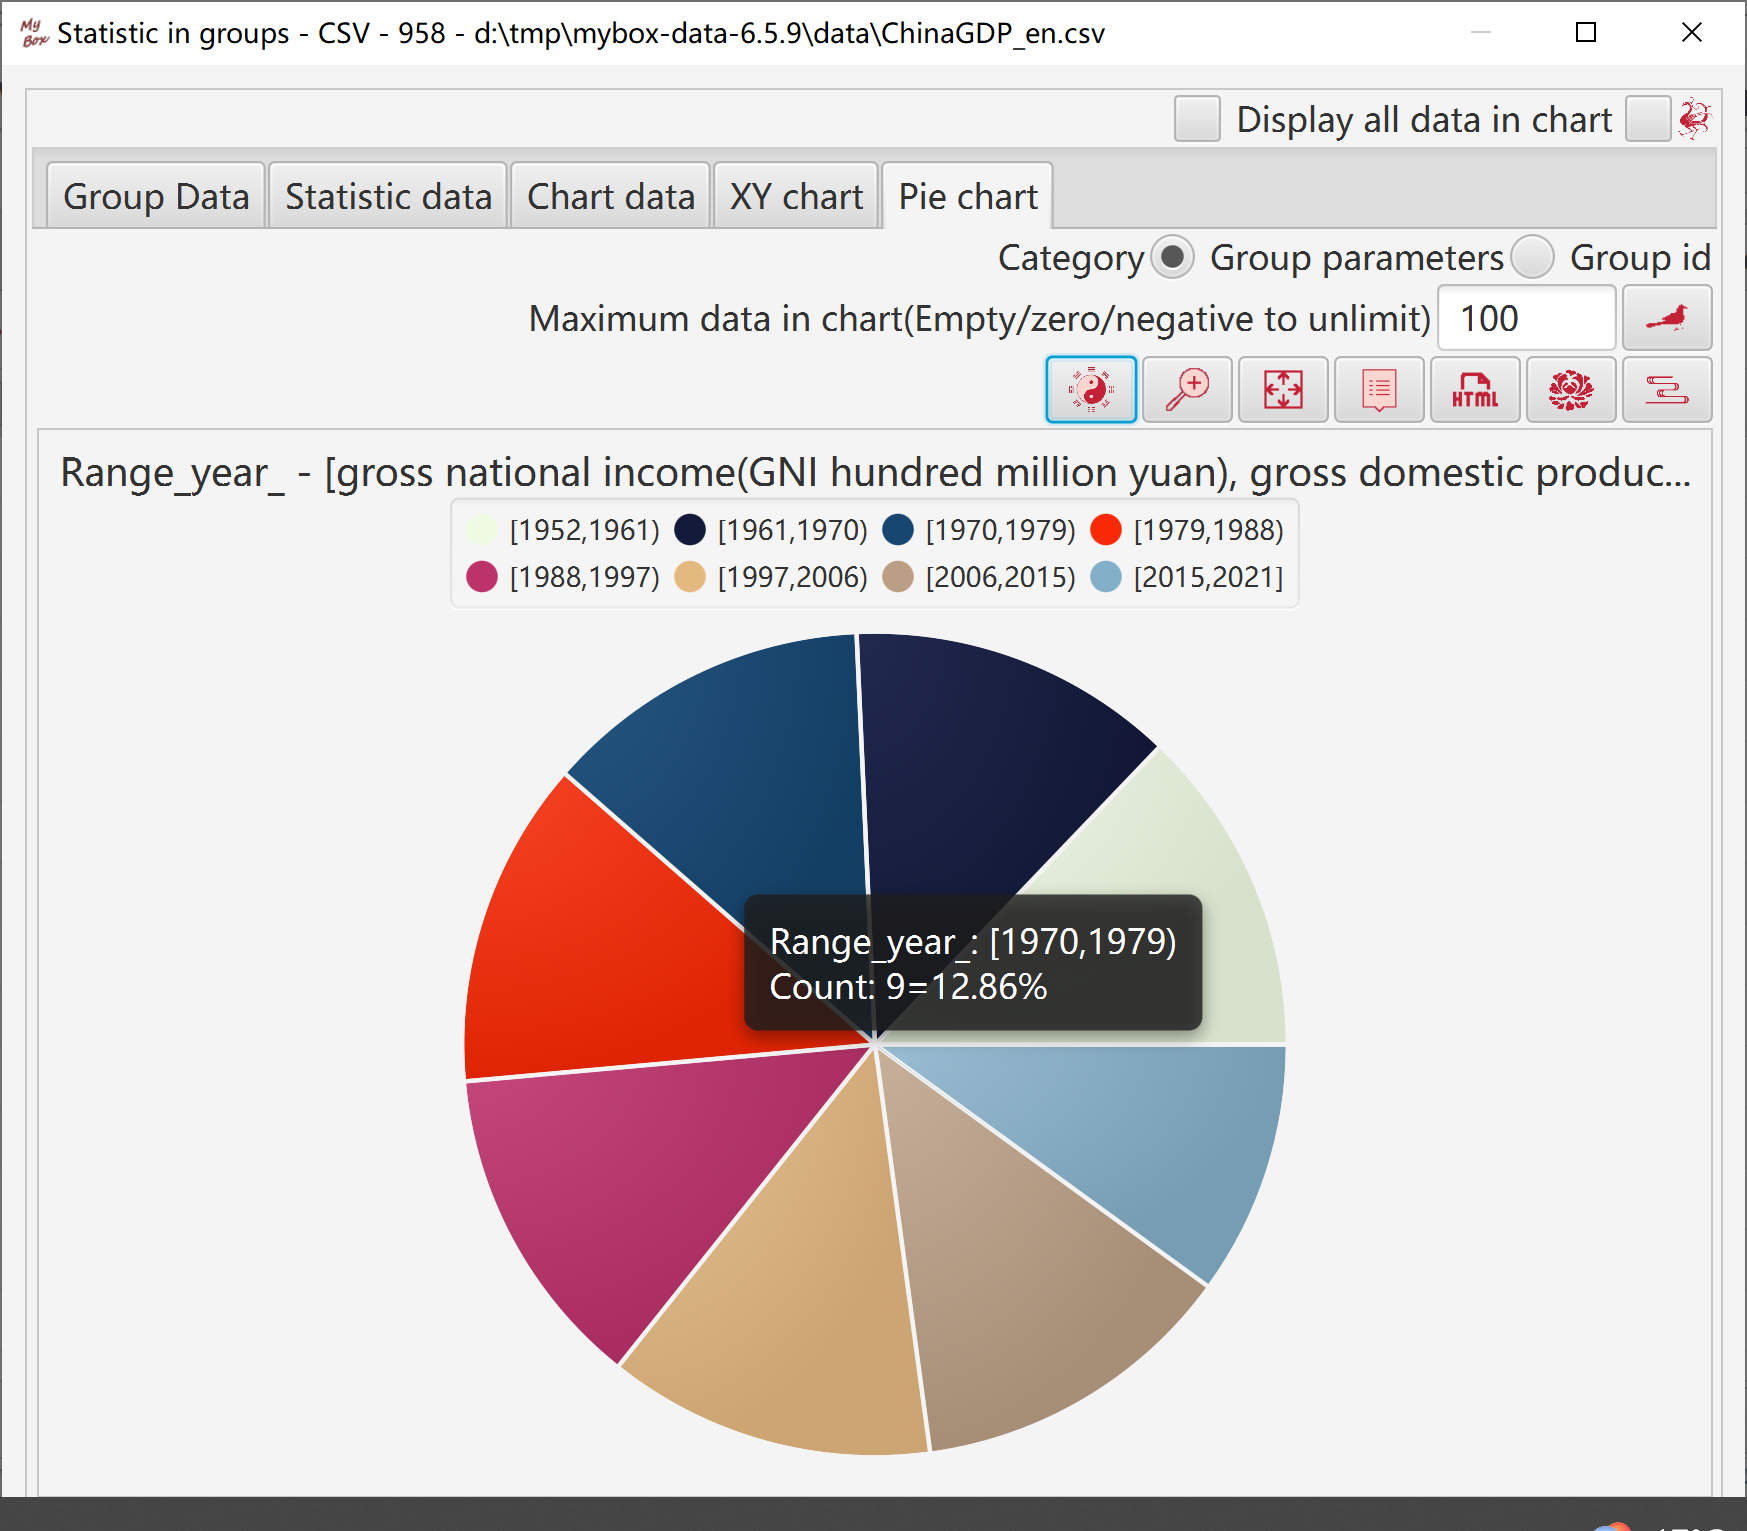
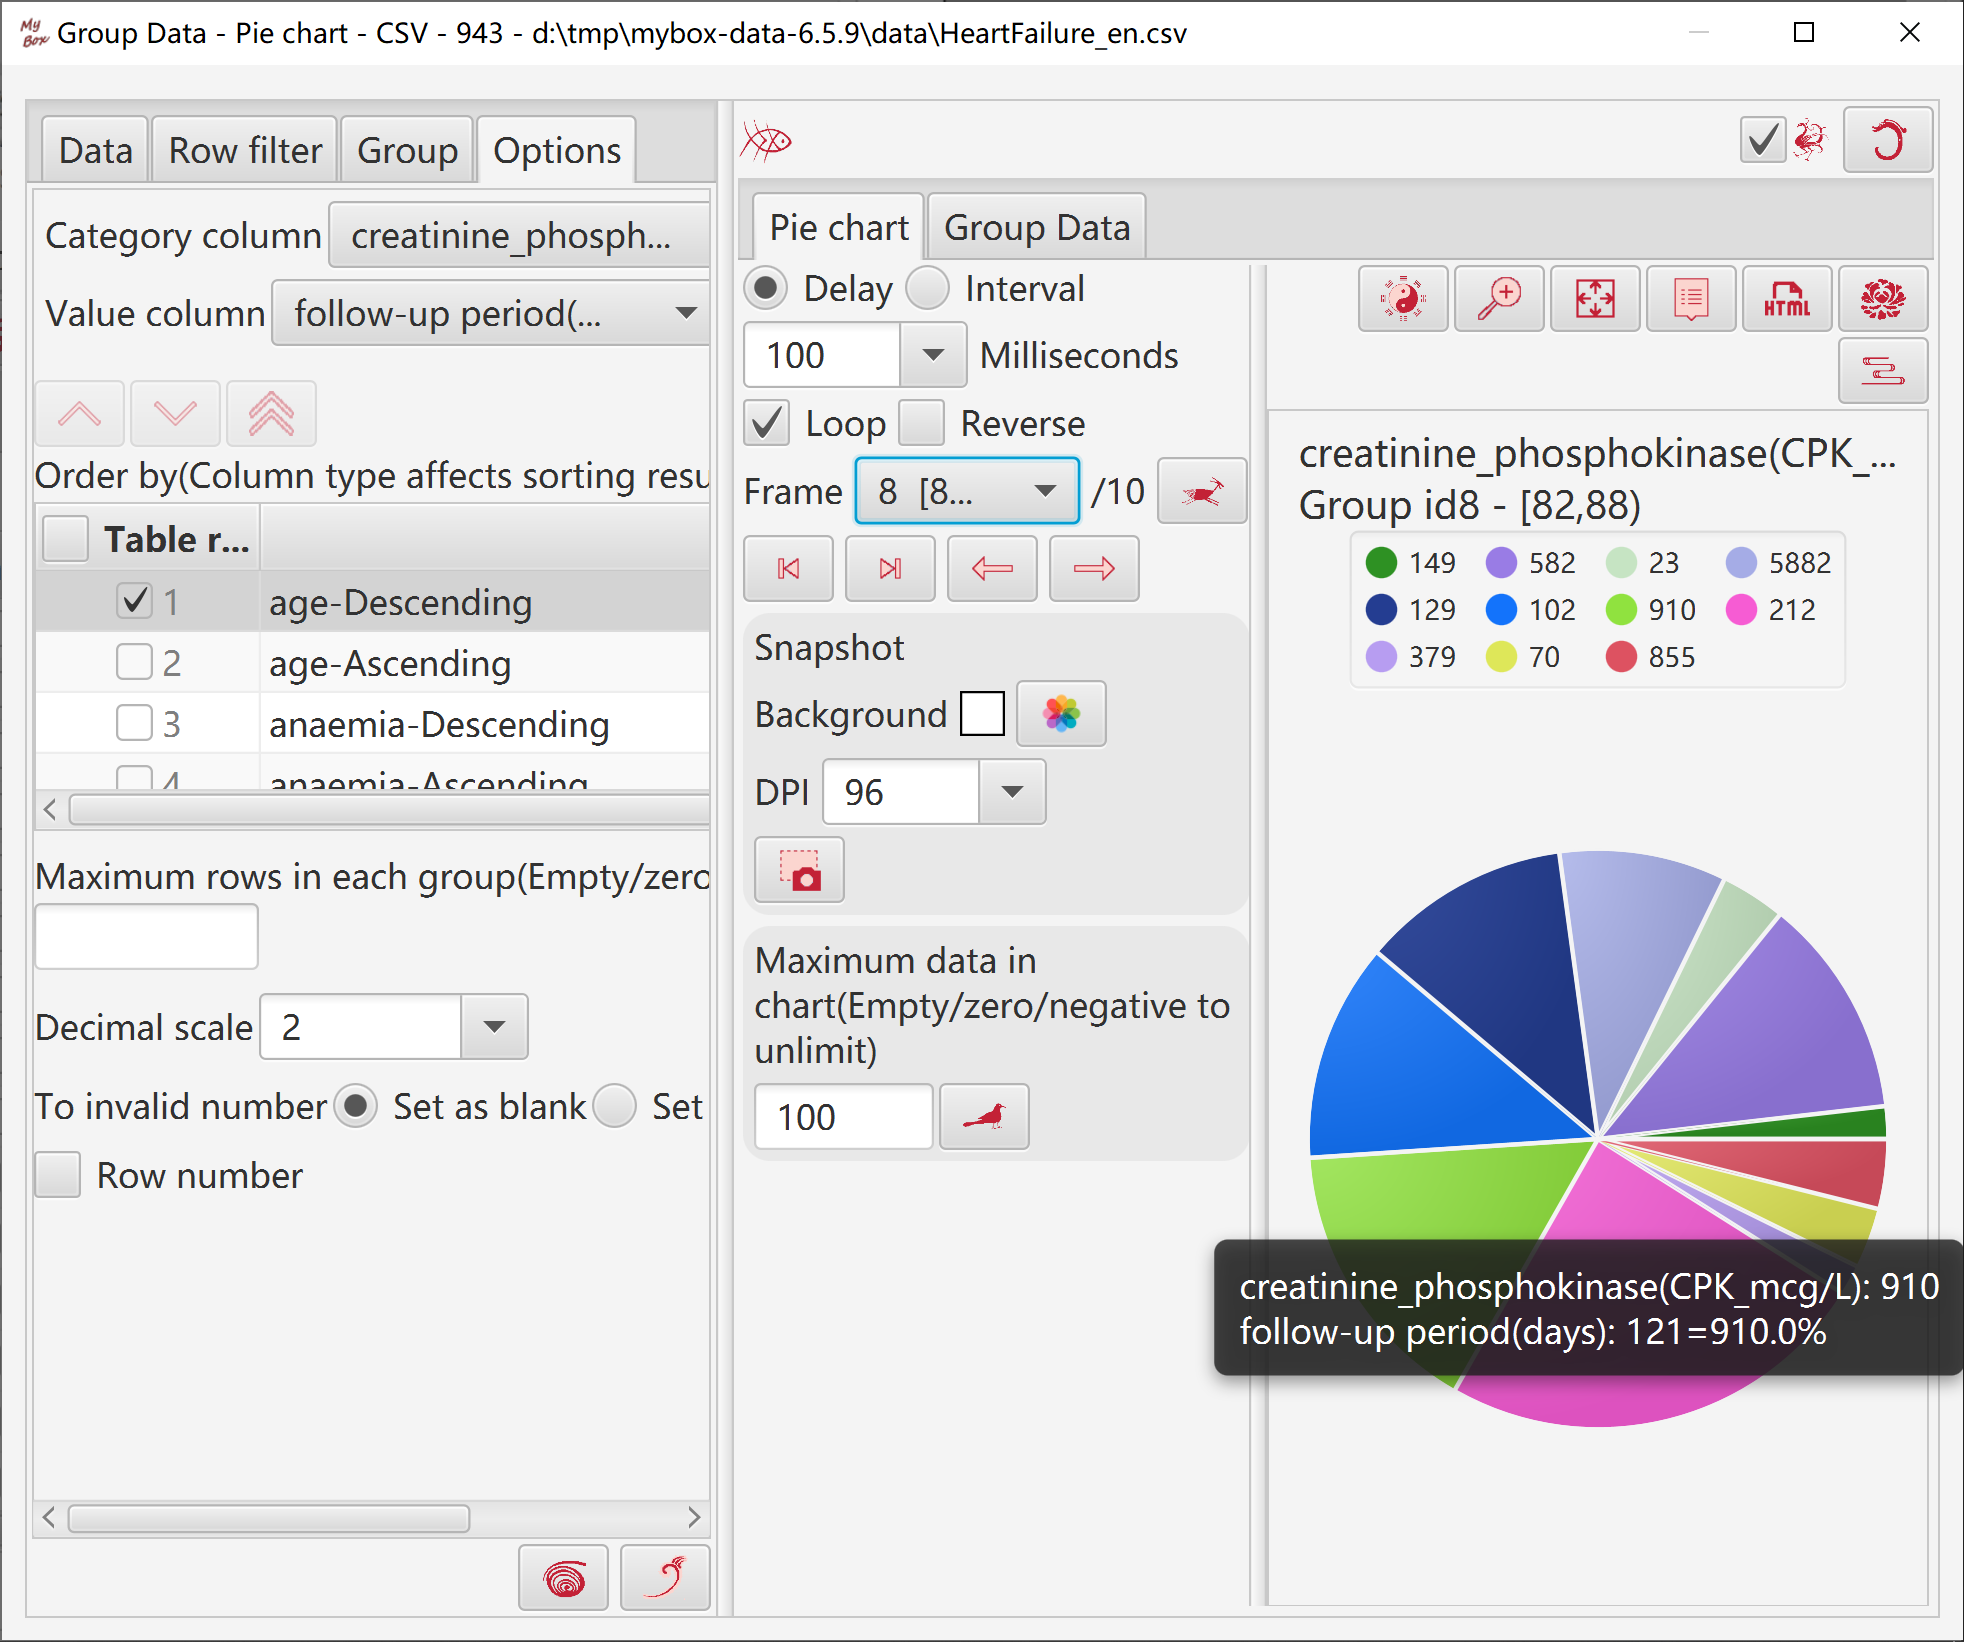
Groups and their “Count” are displayed as Pie chart.
Select category axis: group parameter, or group id.
Set maximum data number in the chart.
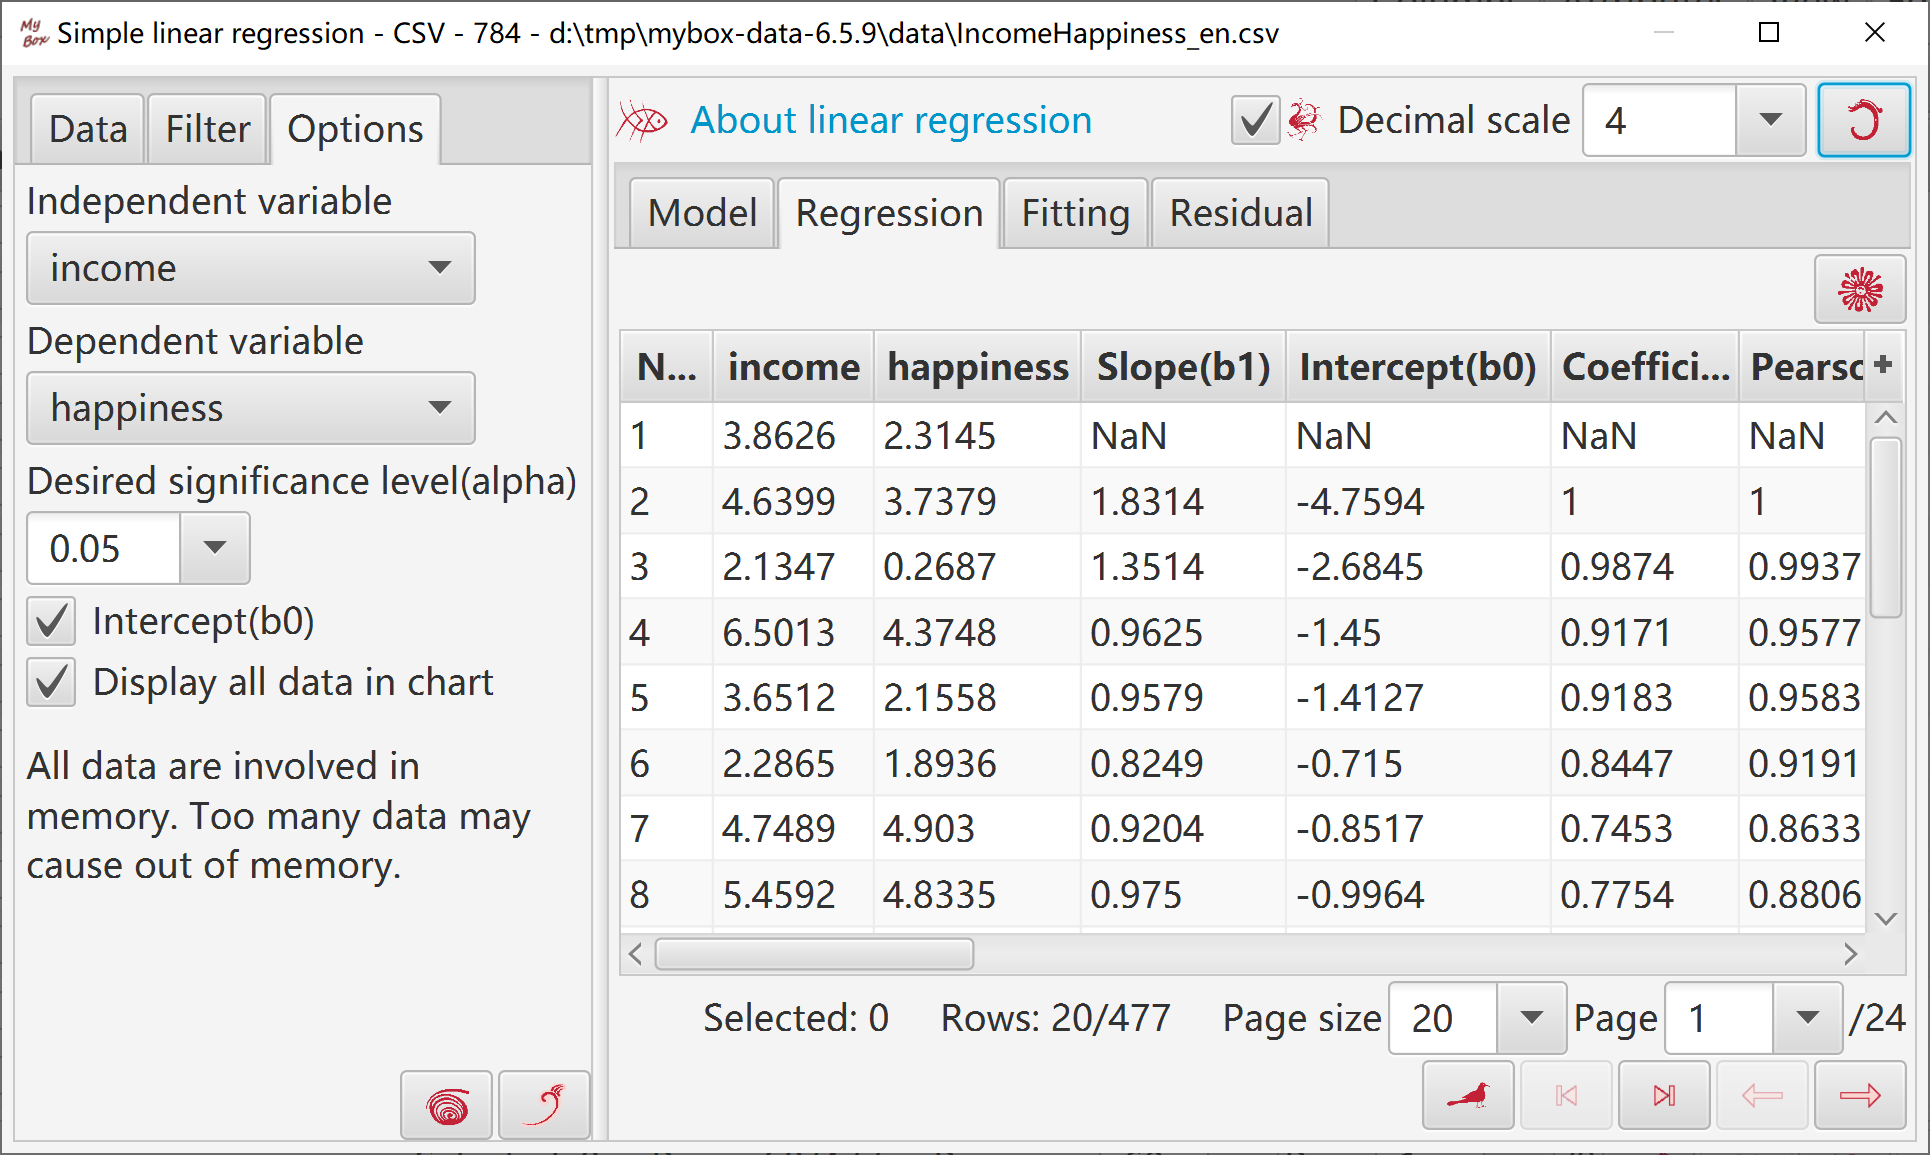
This tool is based on Apache Commons Math.
The regression does not store data, so calculation itself has not memory limitation when handle lots of rows.
Select data rows. Data filter can be set.
Select one column as independent variable.
Select another column as dependent variable. It should not be the same column of independent variable.
Set desired significance level(alpha).
Select whether includes intercept.
Select whether display all data in chart.
Set decimal scale.
Display values status of regression steps in table, including number of observations, slope, intercept, coefficient of determination(R-Square), correlation coefficient(R), mean of squared error(MSE) , sum of squared errors(SSE), total sum of squares(SSTO), sum of squares about regression(SSM/SSR), etc.
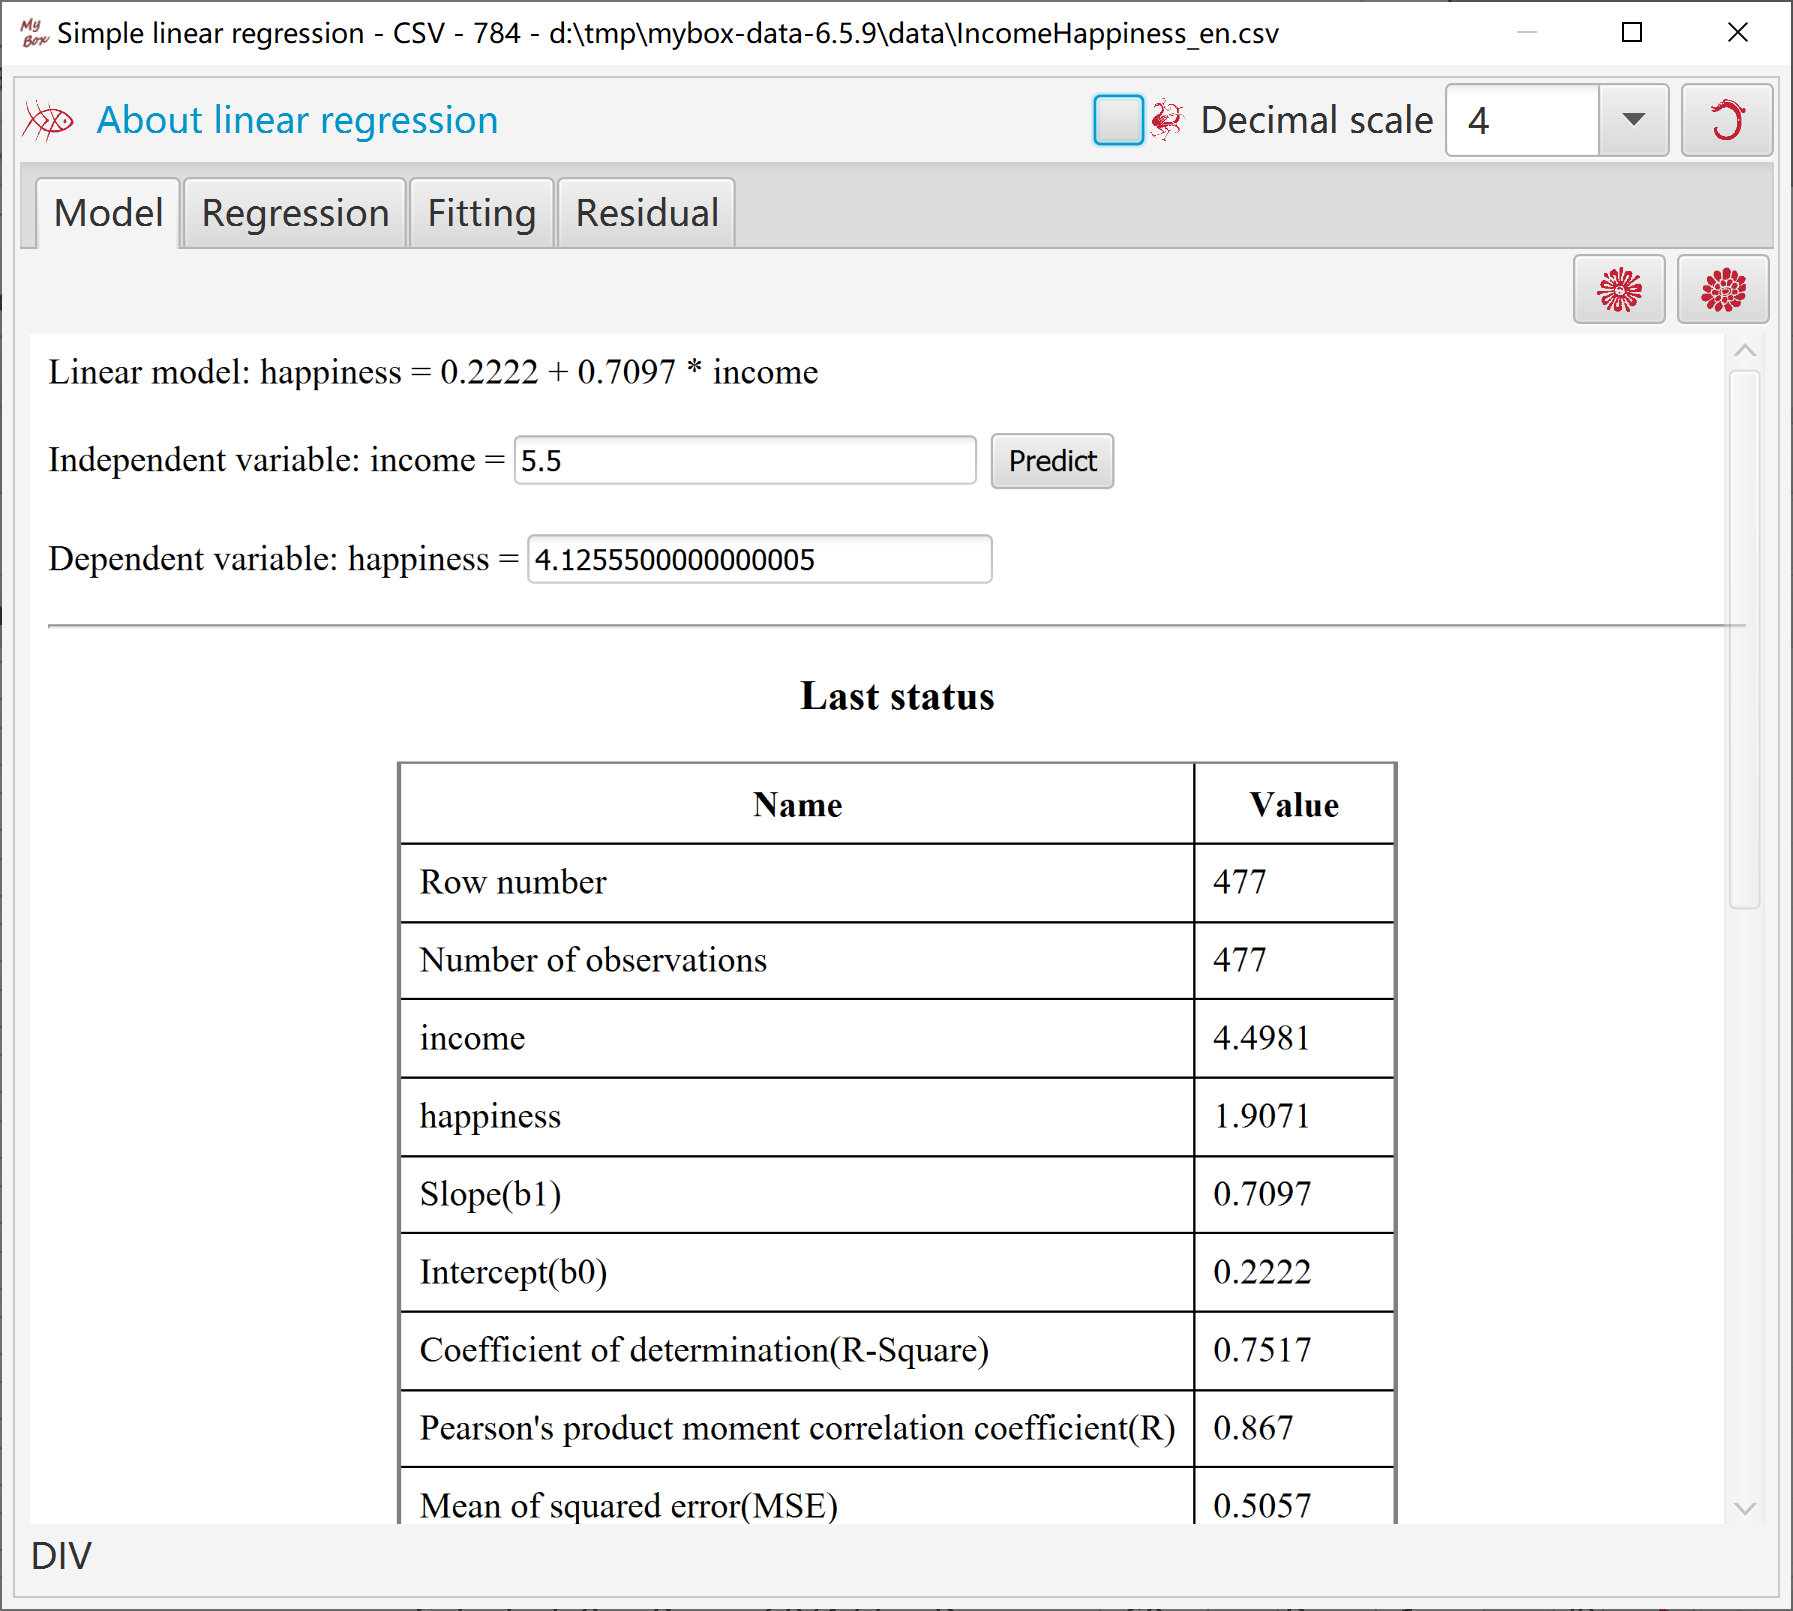
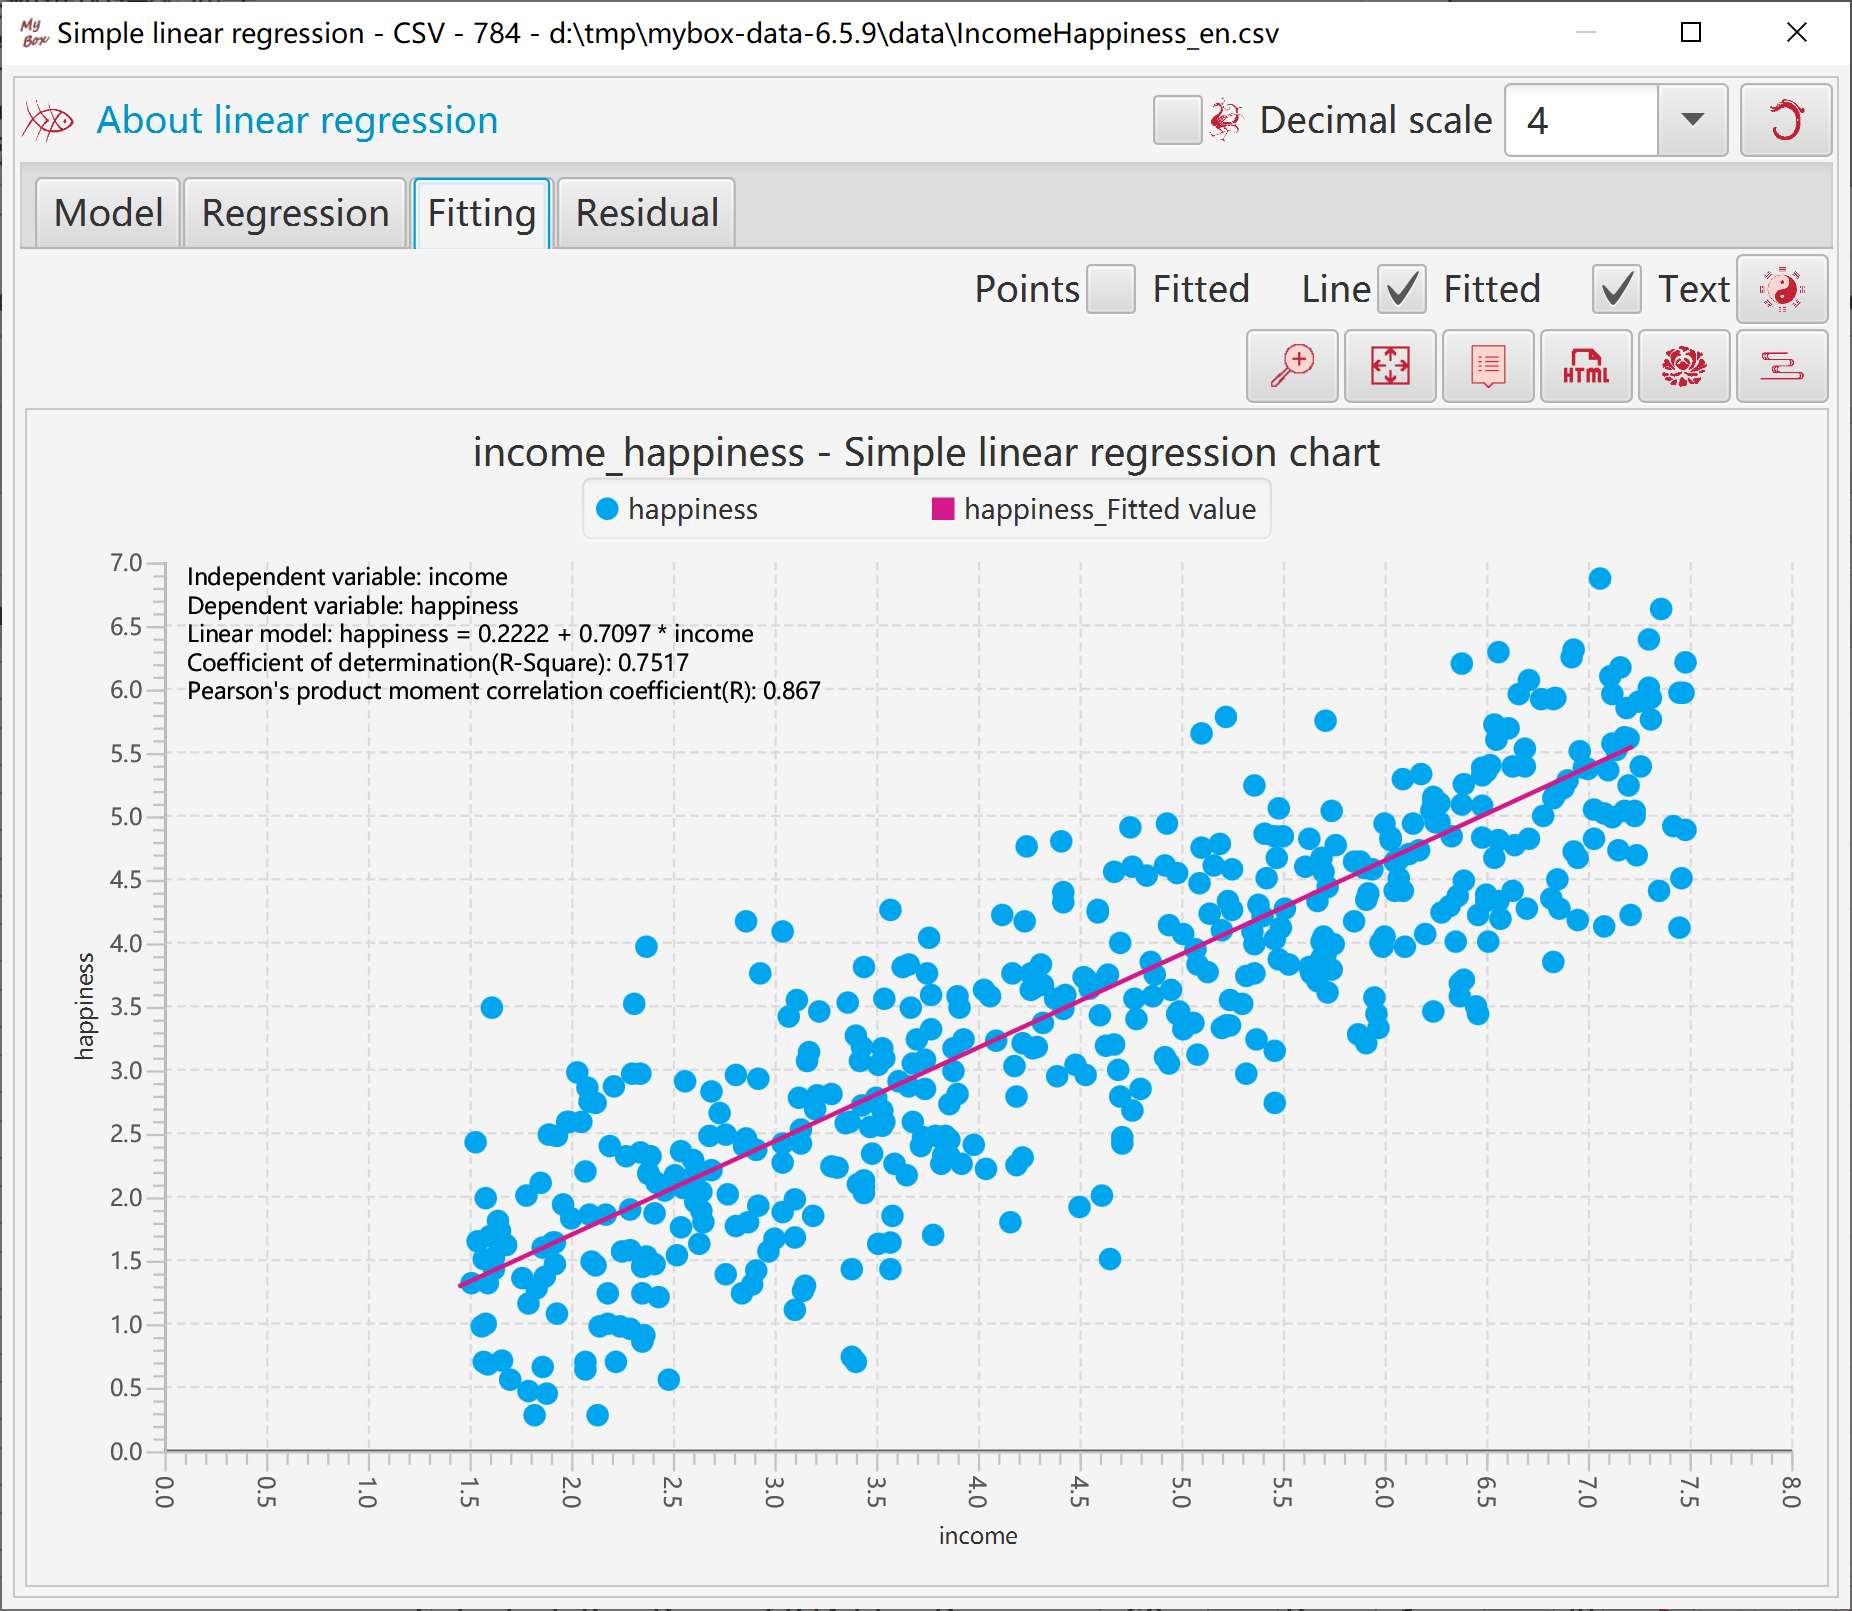
Display fitted liear model.
Display data status of last regression step.
Input value fo independent variable, and generate predicted value.
When handle all data rows(all pages), option to display all values in chart.
When display all values in chart, need concern memory limitation when load lots of data.
Or else only values in current page will be displayed in chart while all pages involve regression, and no memory limitation.
Set parameters of plot, X axis and Y axis.
Options to display fitted points, fitted line, or model description in chart.
Options to display data labels.
Set random colors to fitted points/line.
Fitted chart can be popped.
Html including fitted chart and its data can be created.
Display fitted chart's data in table.
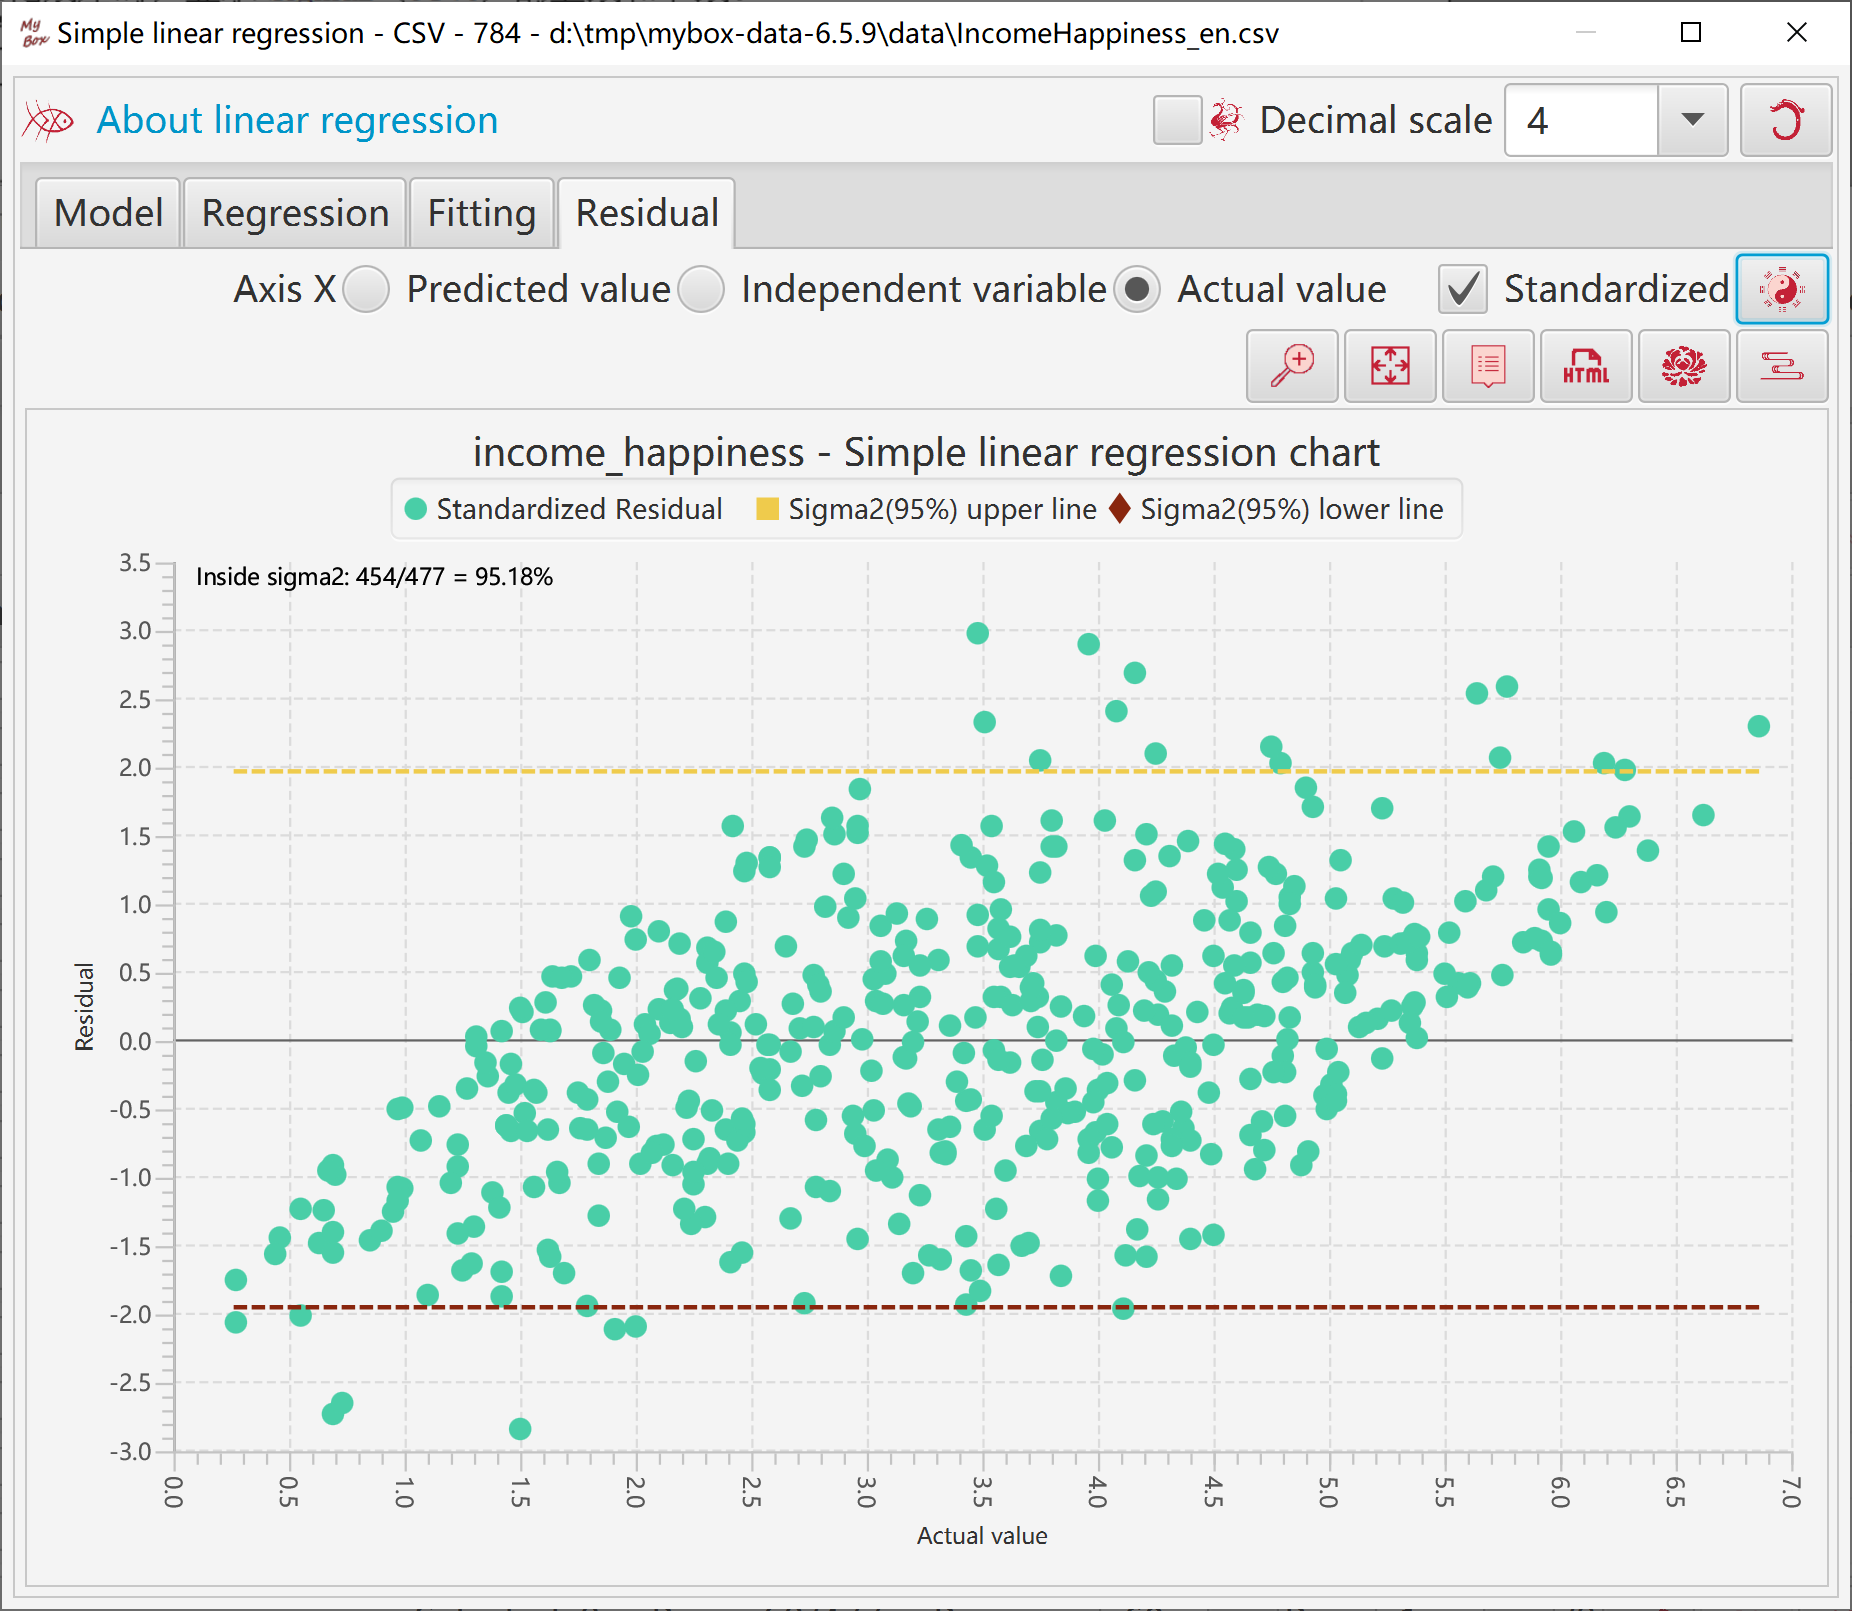
X axis can be set as: predicted value, independent varaible, or actual value.
Option whether standardize residuals.
When standardize residuals, upper line and lower line of Sigma2(95%) will be displayed.
Set random color to points and lines.
Display residual chart's data in table.
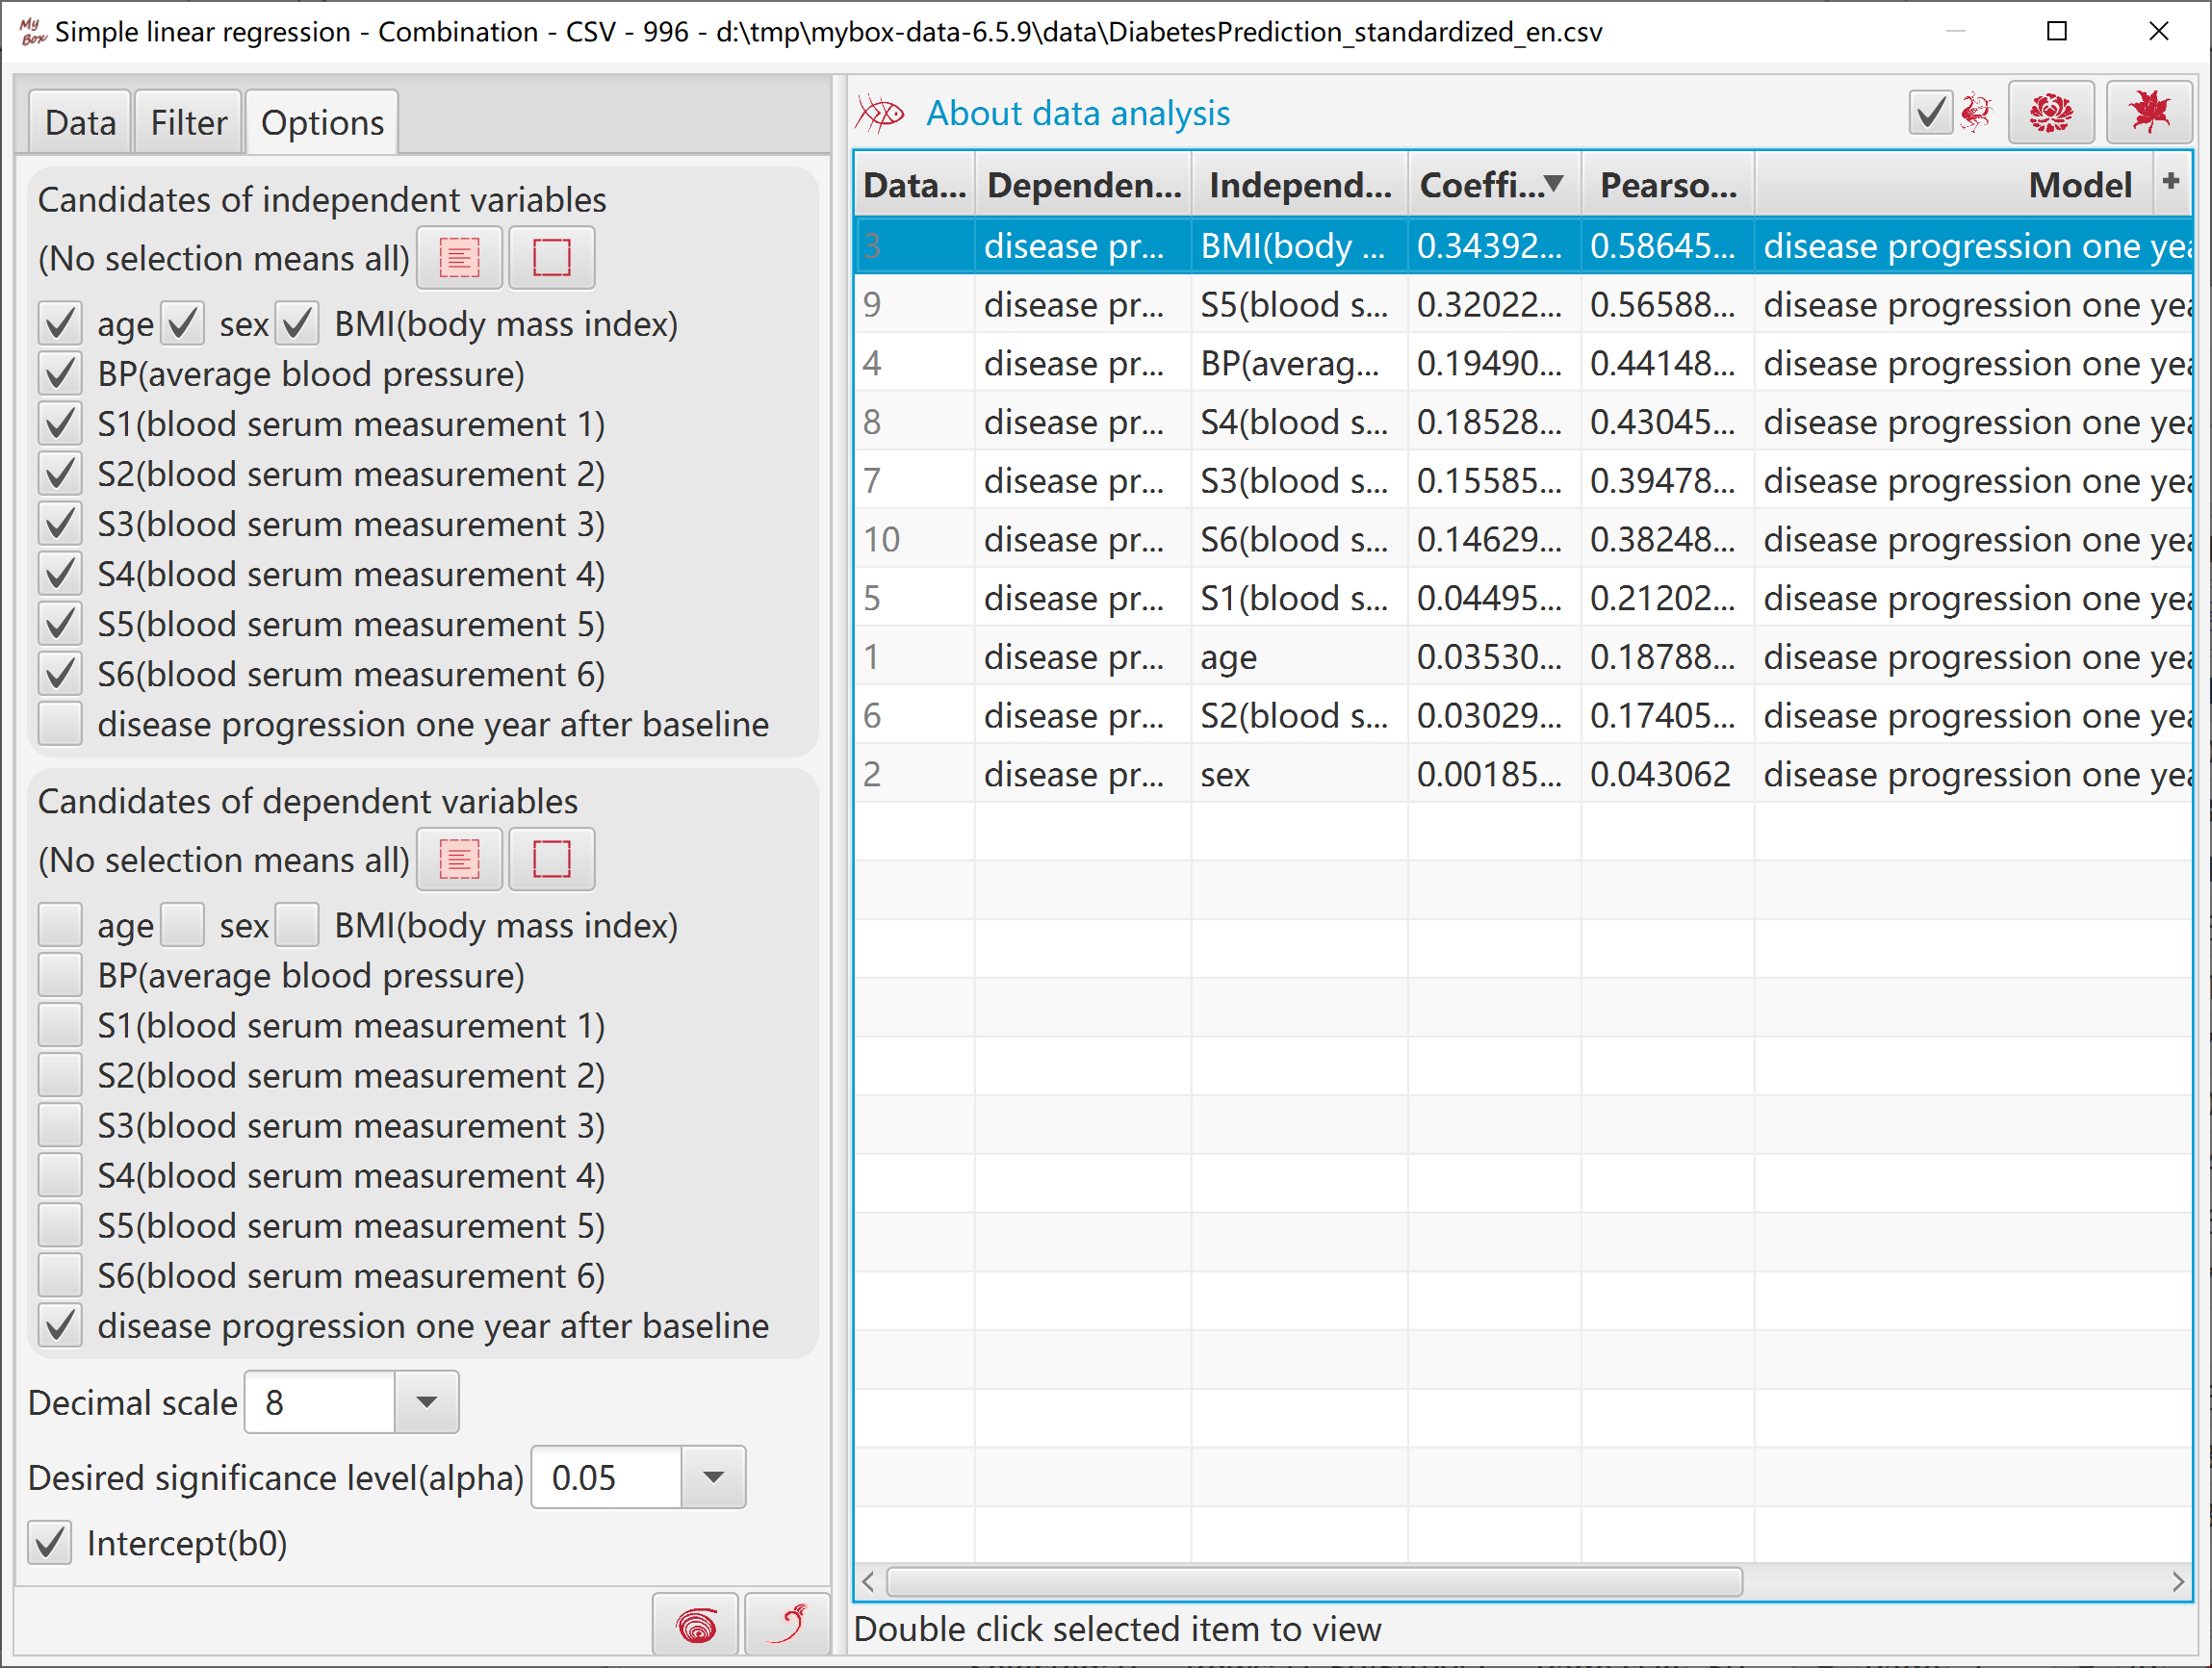
This tool helps to generate data of simple linear regression:
Select some columns as candidates of independent variables.
Select some columns as candidates of dependent variables.
Select options like decimal scale, alpha, whether include intercept.
When click button "OK":
Make pairs from candidates : one as independent variable and another as dependent variable.
Calculate the regression models.
Sort the modes by their coefficient of determination(R-Square) in descending order.
Select one model and click button "View" to view its regression data, fitting chart, and residual chart.
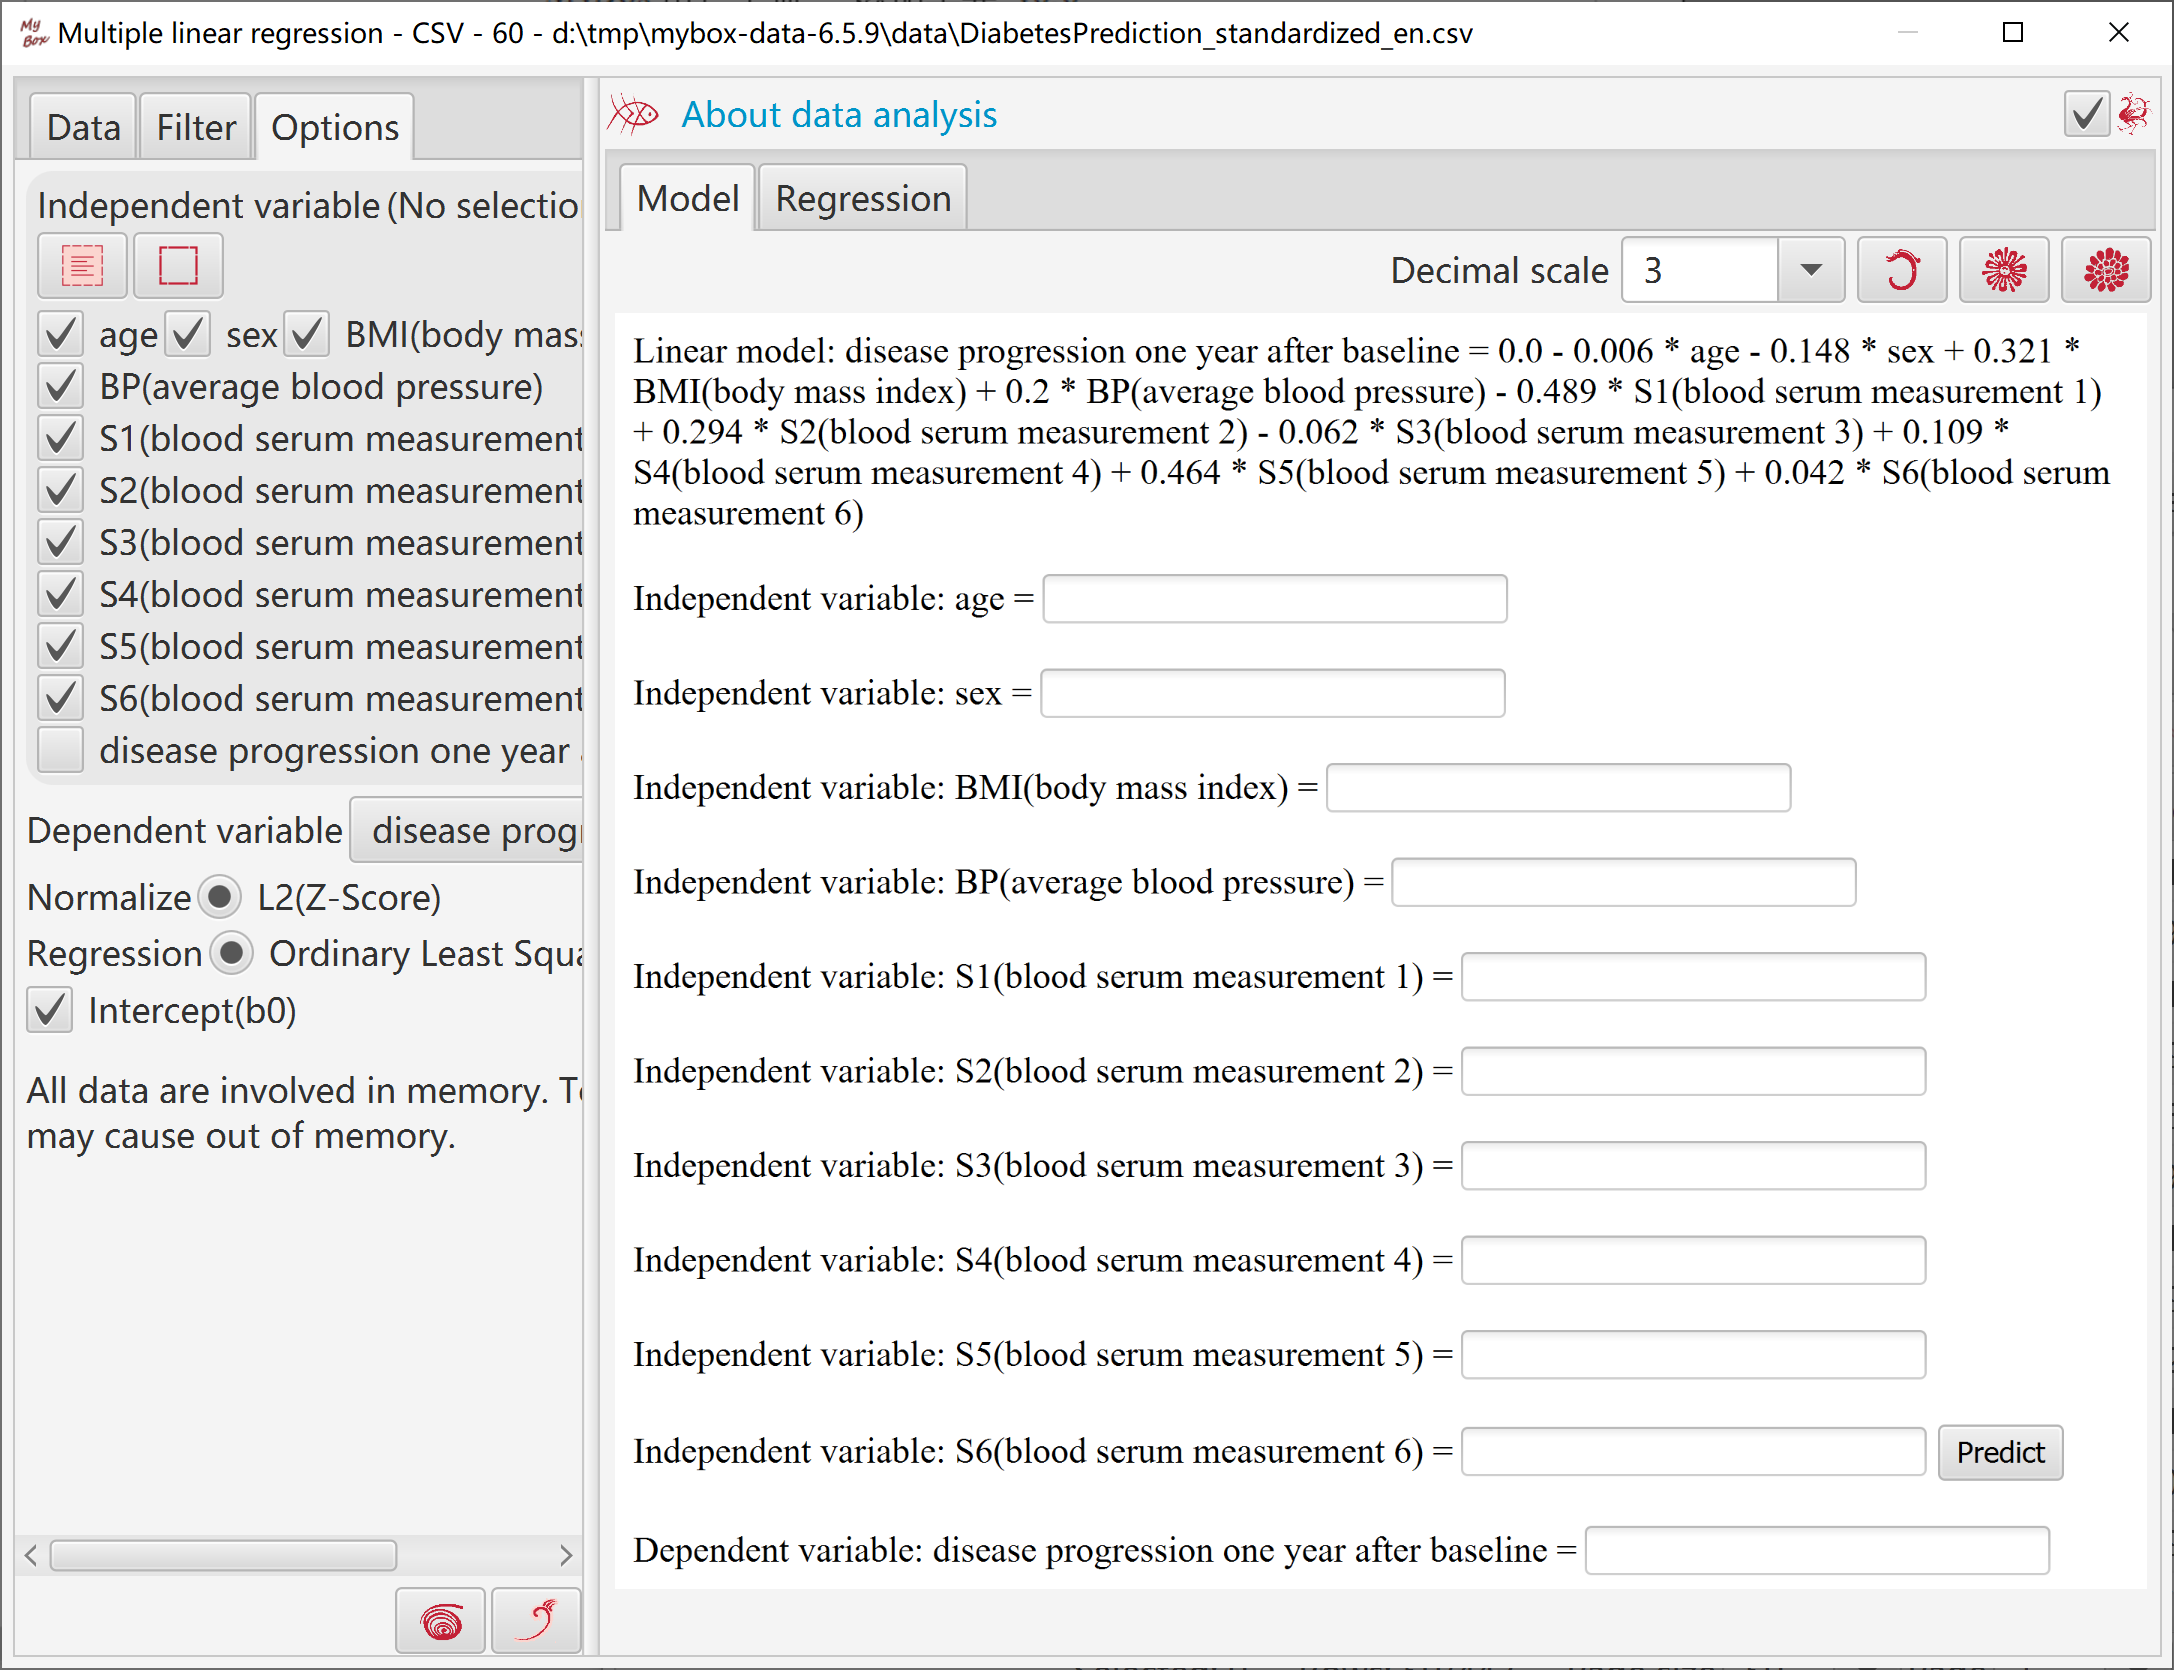
This tool helps to generate data of multiple linear regression based on Apache Commons Math:
Select some column as independent variables, whose data should be numbers.
Select a column as dependent variable, whose data should be numbers.
Select whether include intercept.
Click button "OK":
Tool normalizes involved data by Z-Score.
Tool calculates multiple linear regression by Ordinary Least Squares(OLS).
Results include intercept, coefficients, R-Squre, adjusted R-Squre.
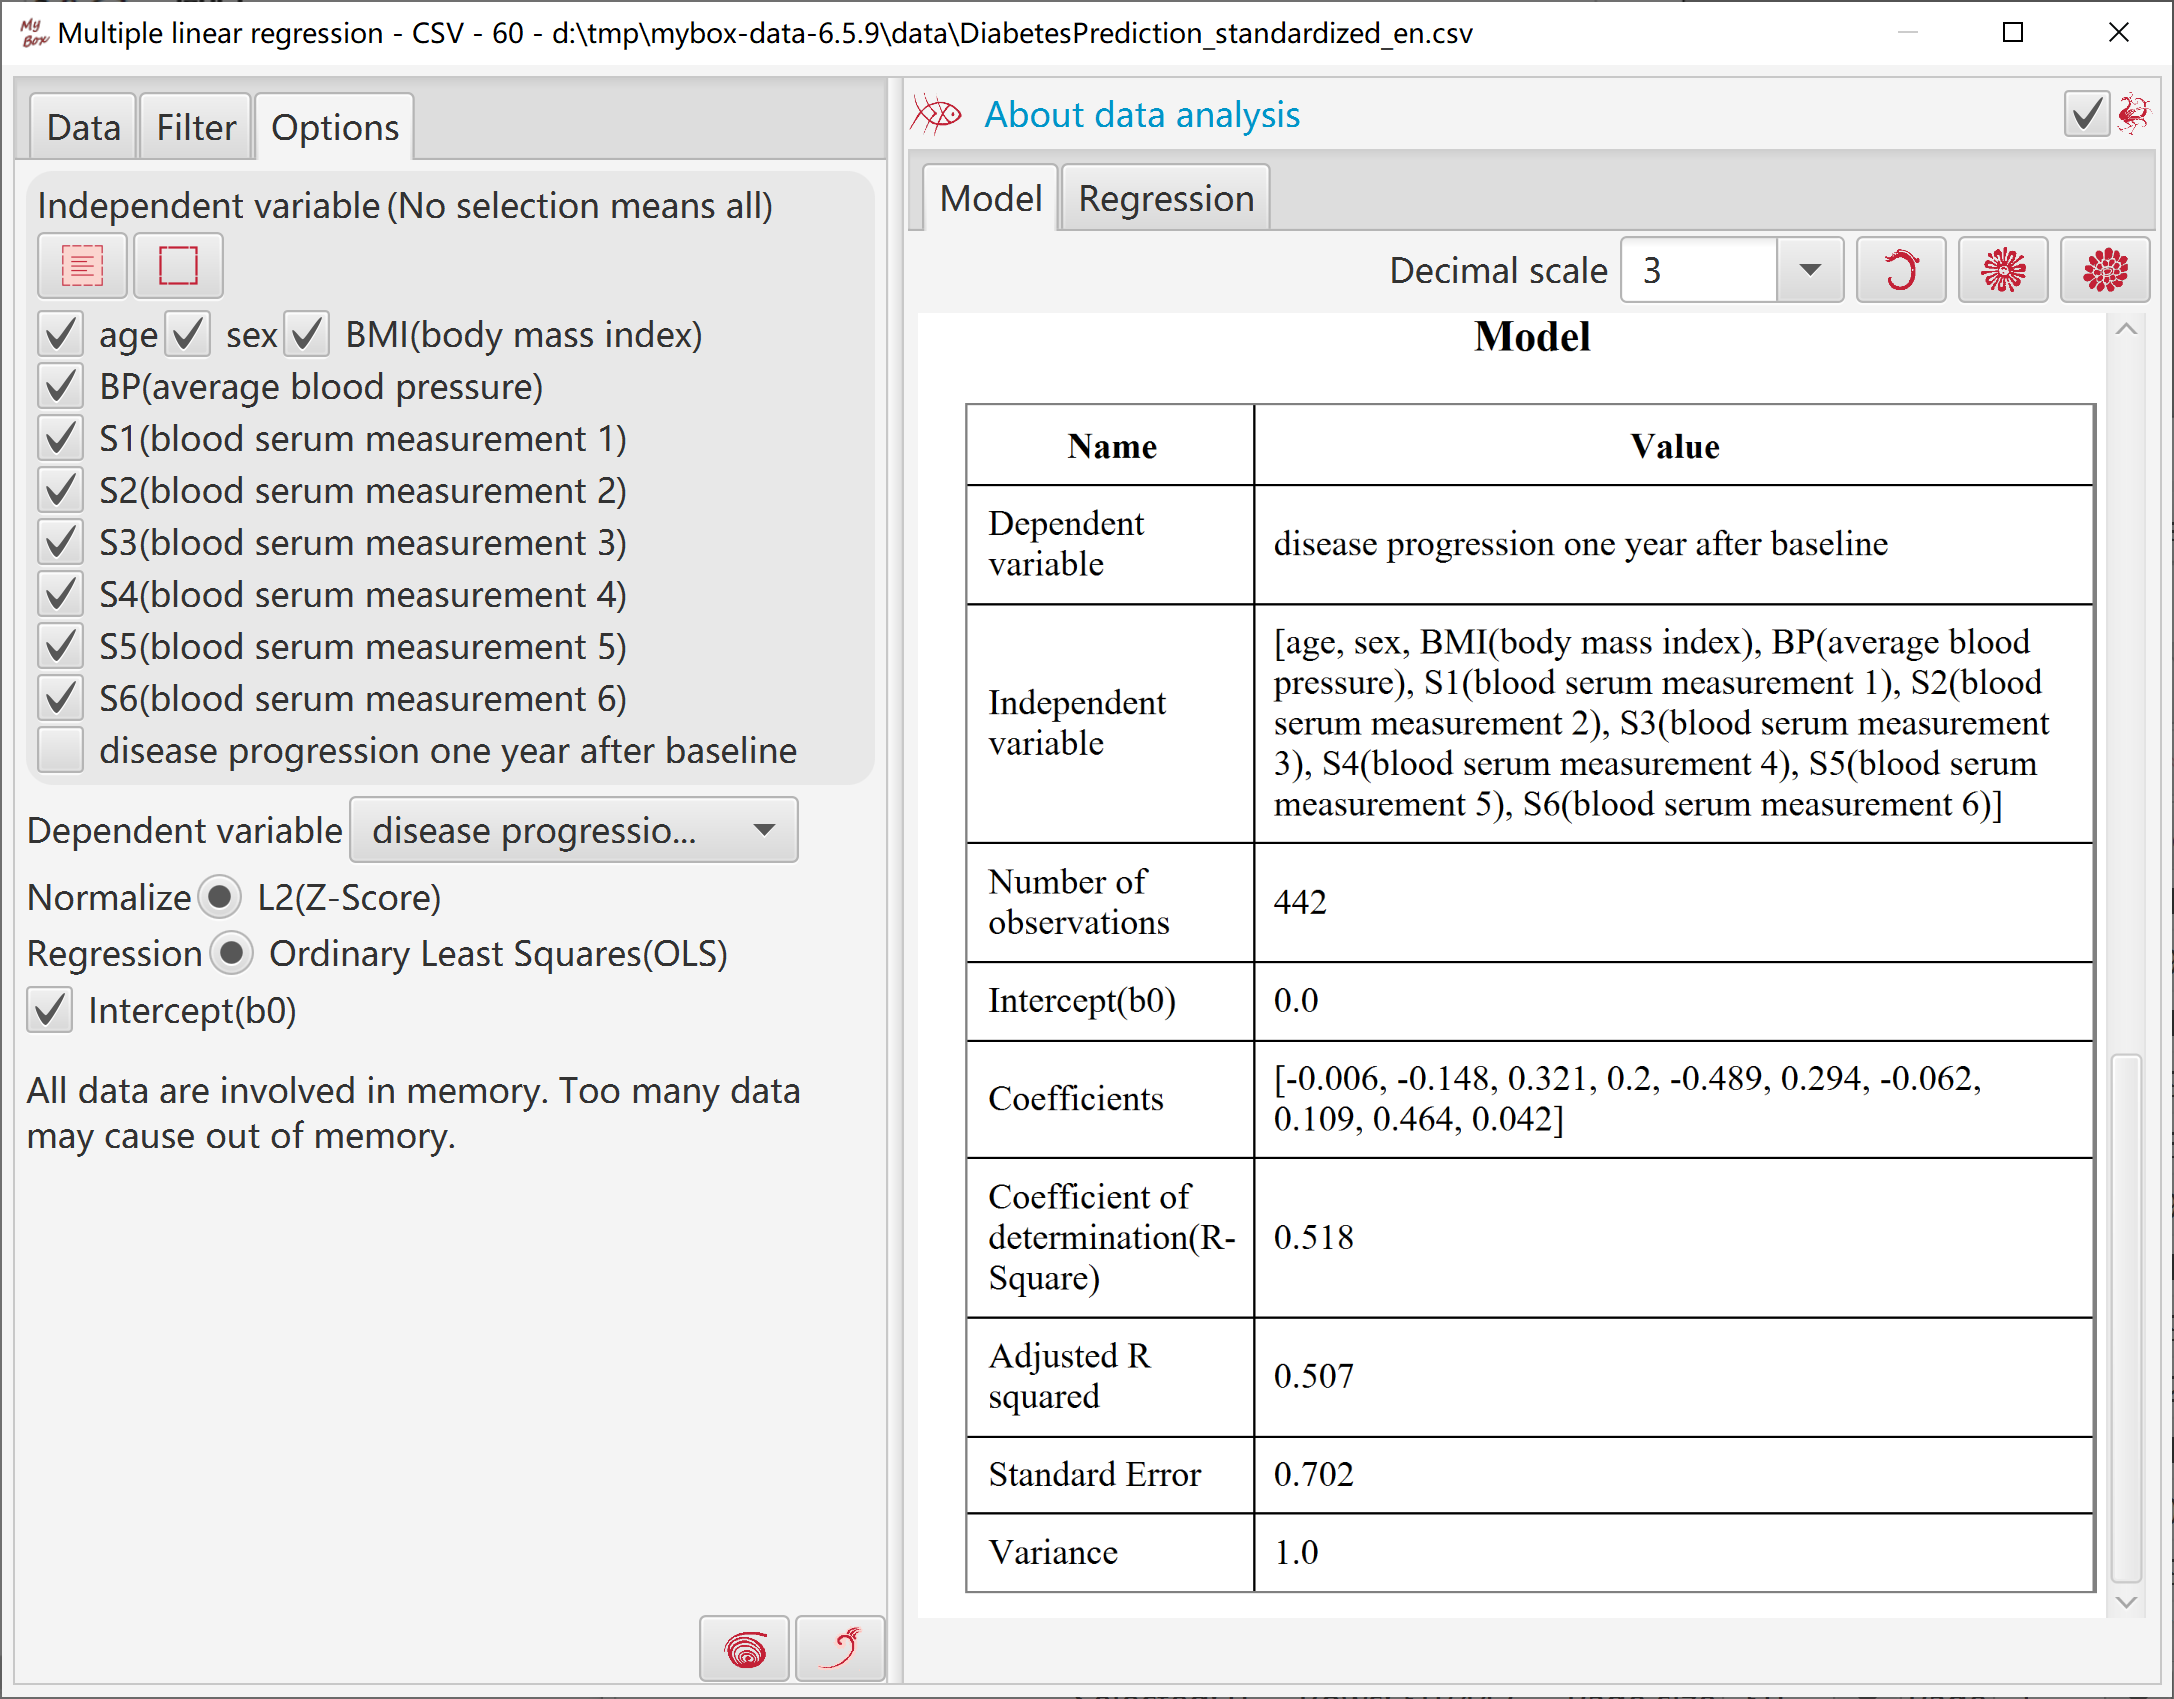
User can input values of independent variables and predict value of dependent variable.
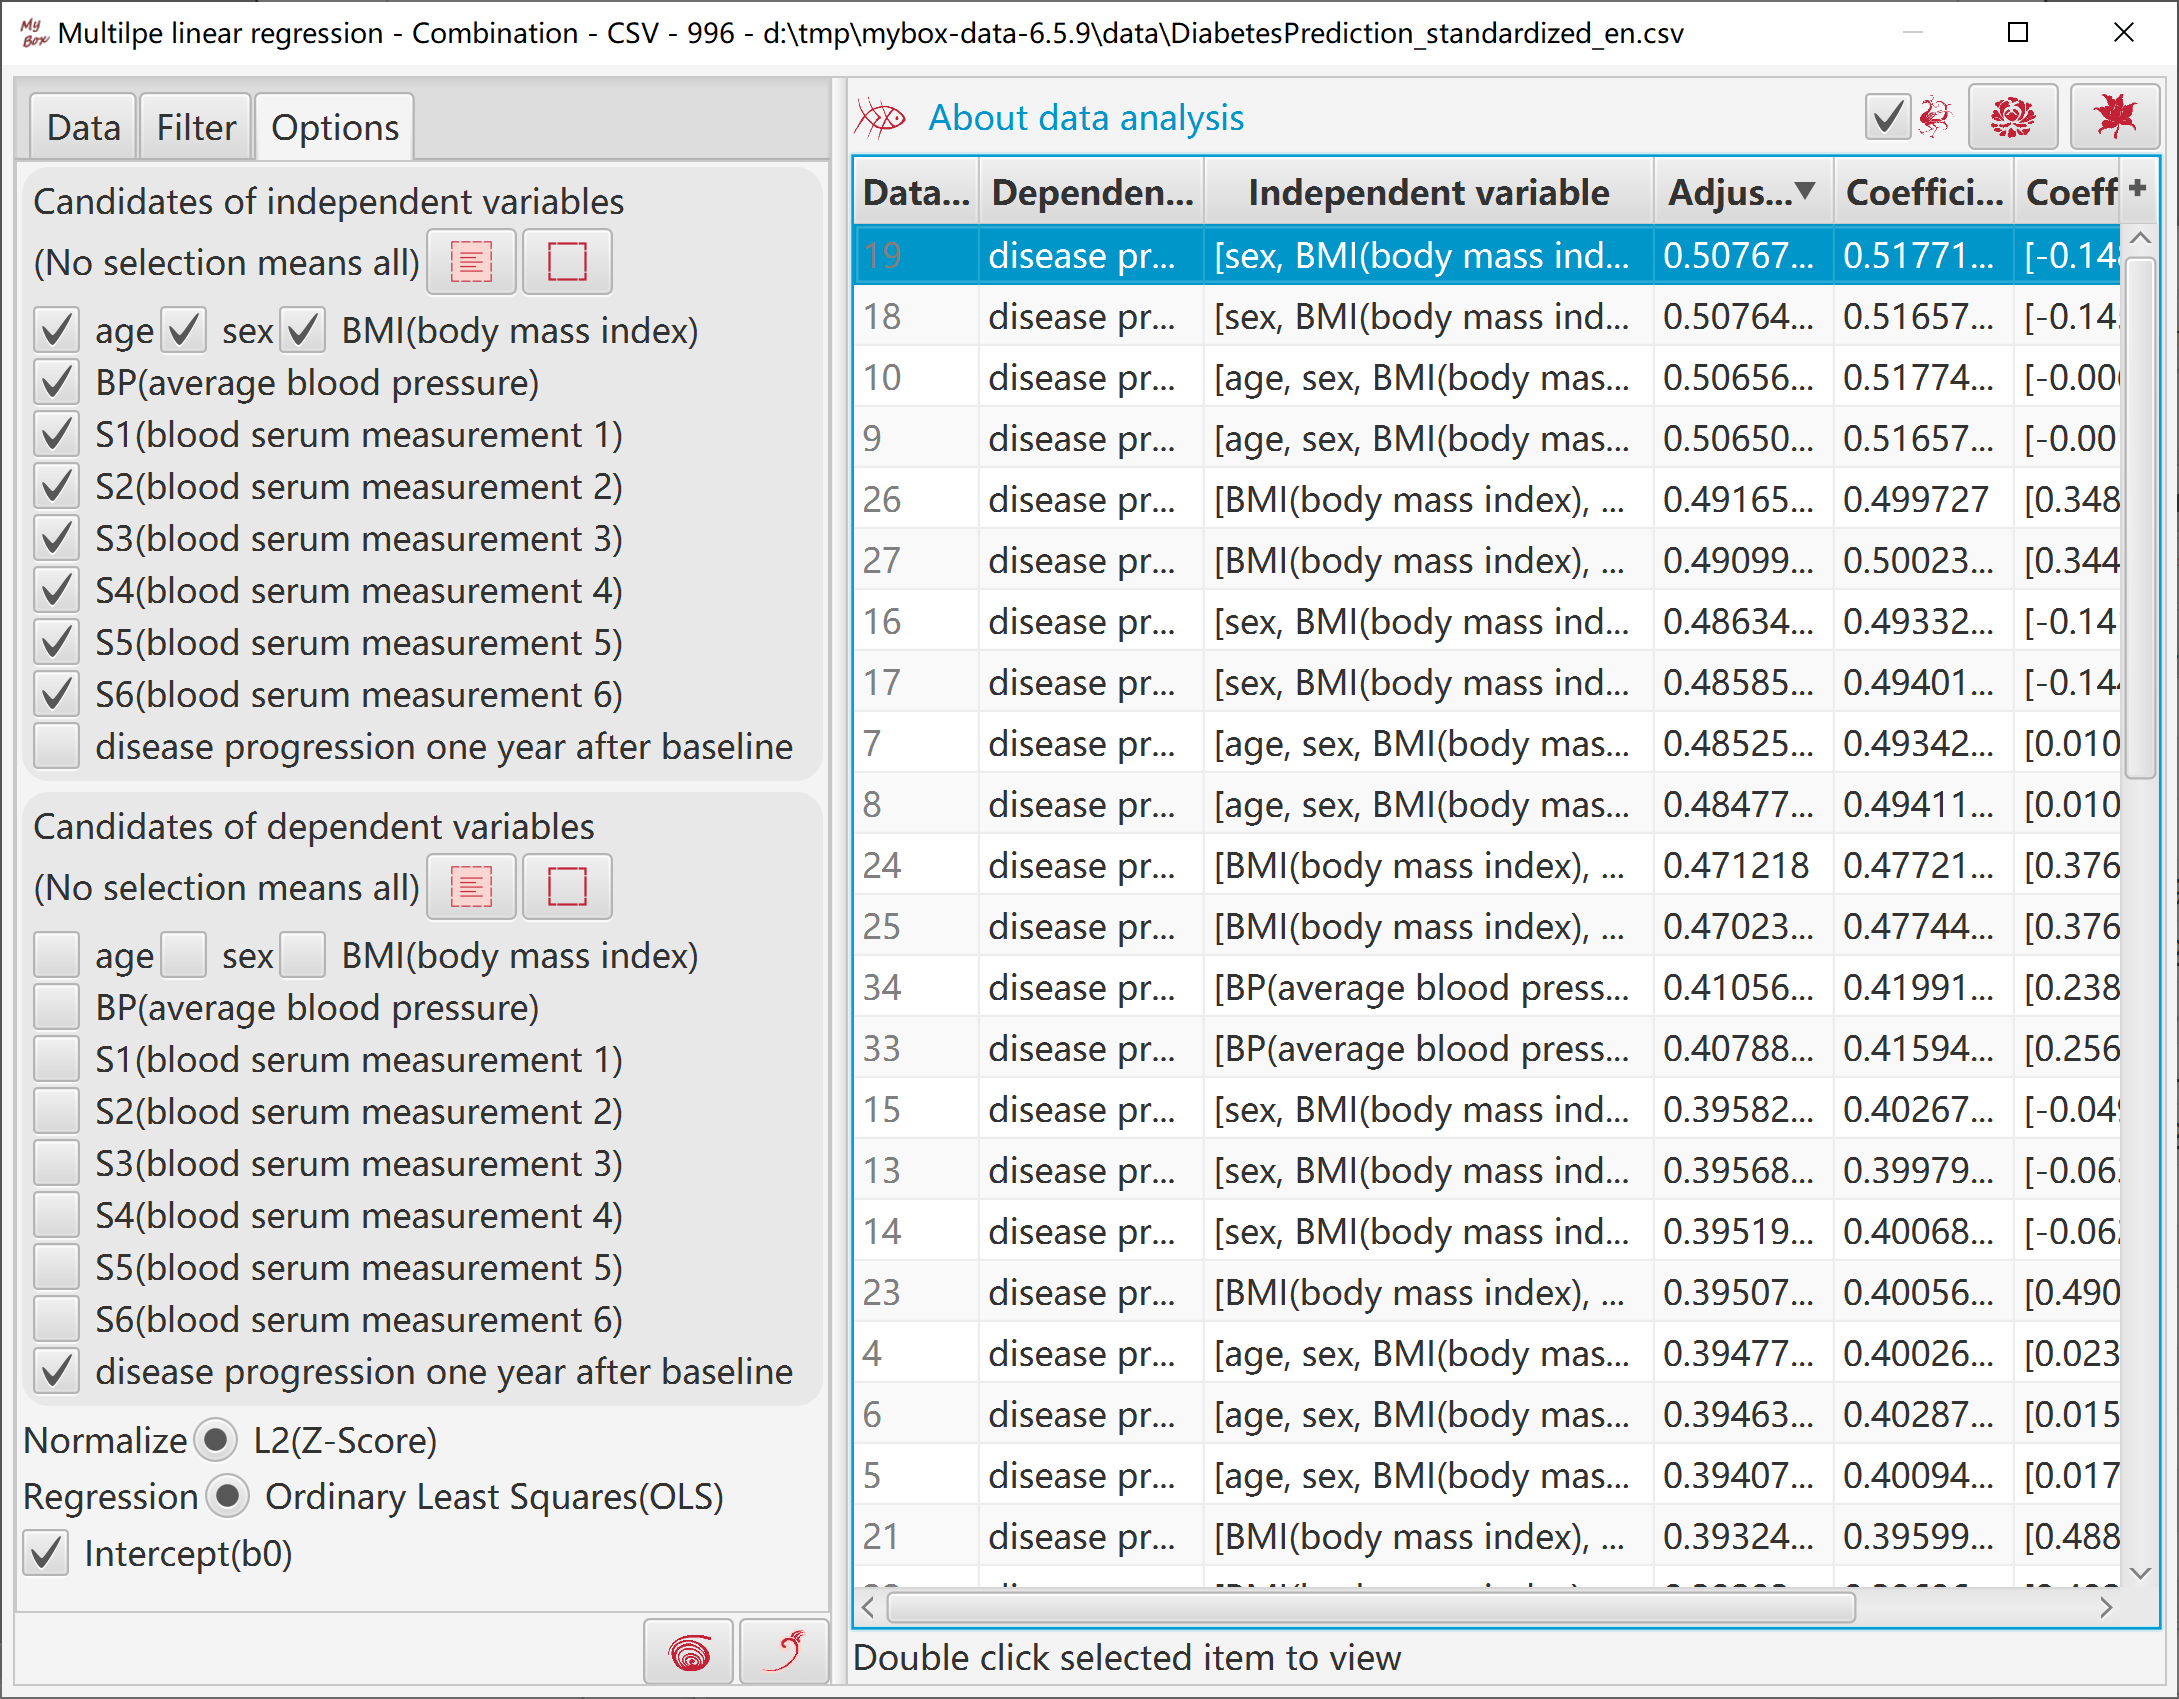
This tool helps to generate data of multiple linear regression based on Apache Commons Math:
Select some columns as candidates of independent variables.
Select some columns as candidates of dependent variables.
Select whether include intercept.
When click button "OK", the tool does following:
Make combination of candidates as independent variables and dependent variable .
Calculate the regression models.
Sort the modes by their adjusted coefficient of determination(R-Square) in descending order.
Select one model and click button "View" to view its regression data
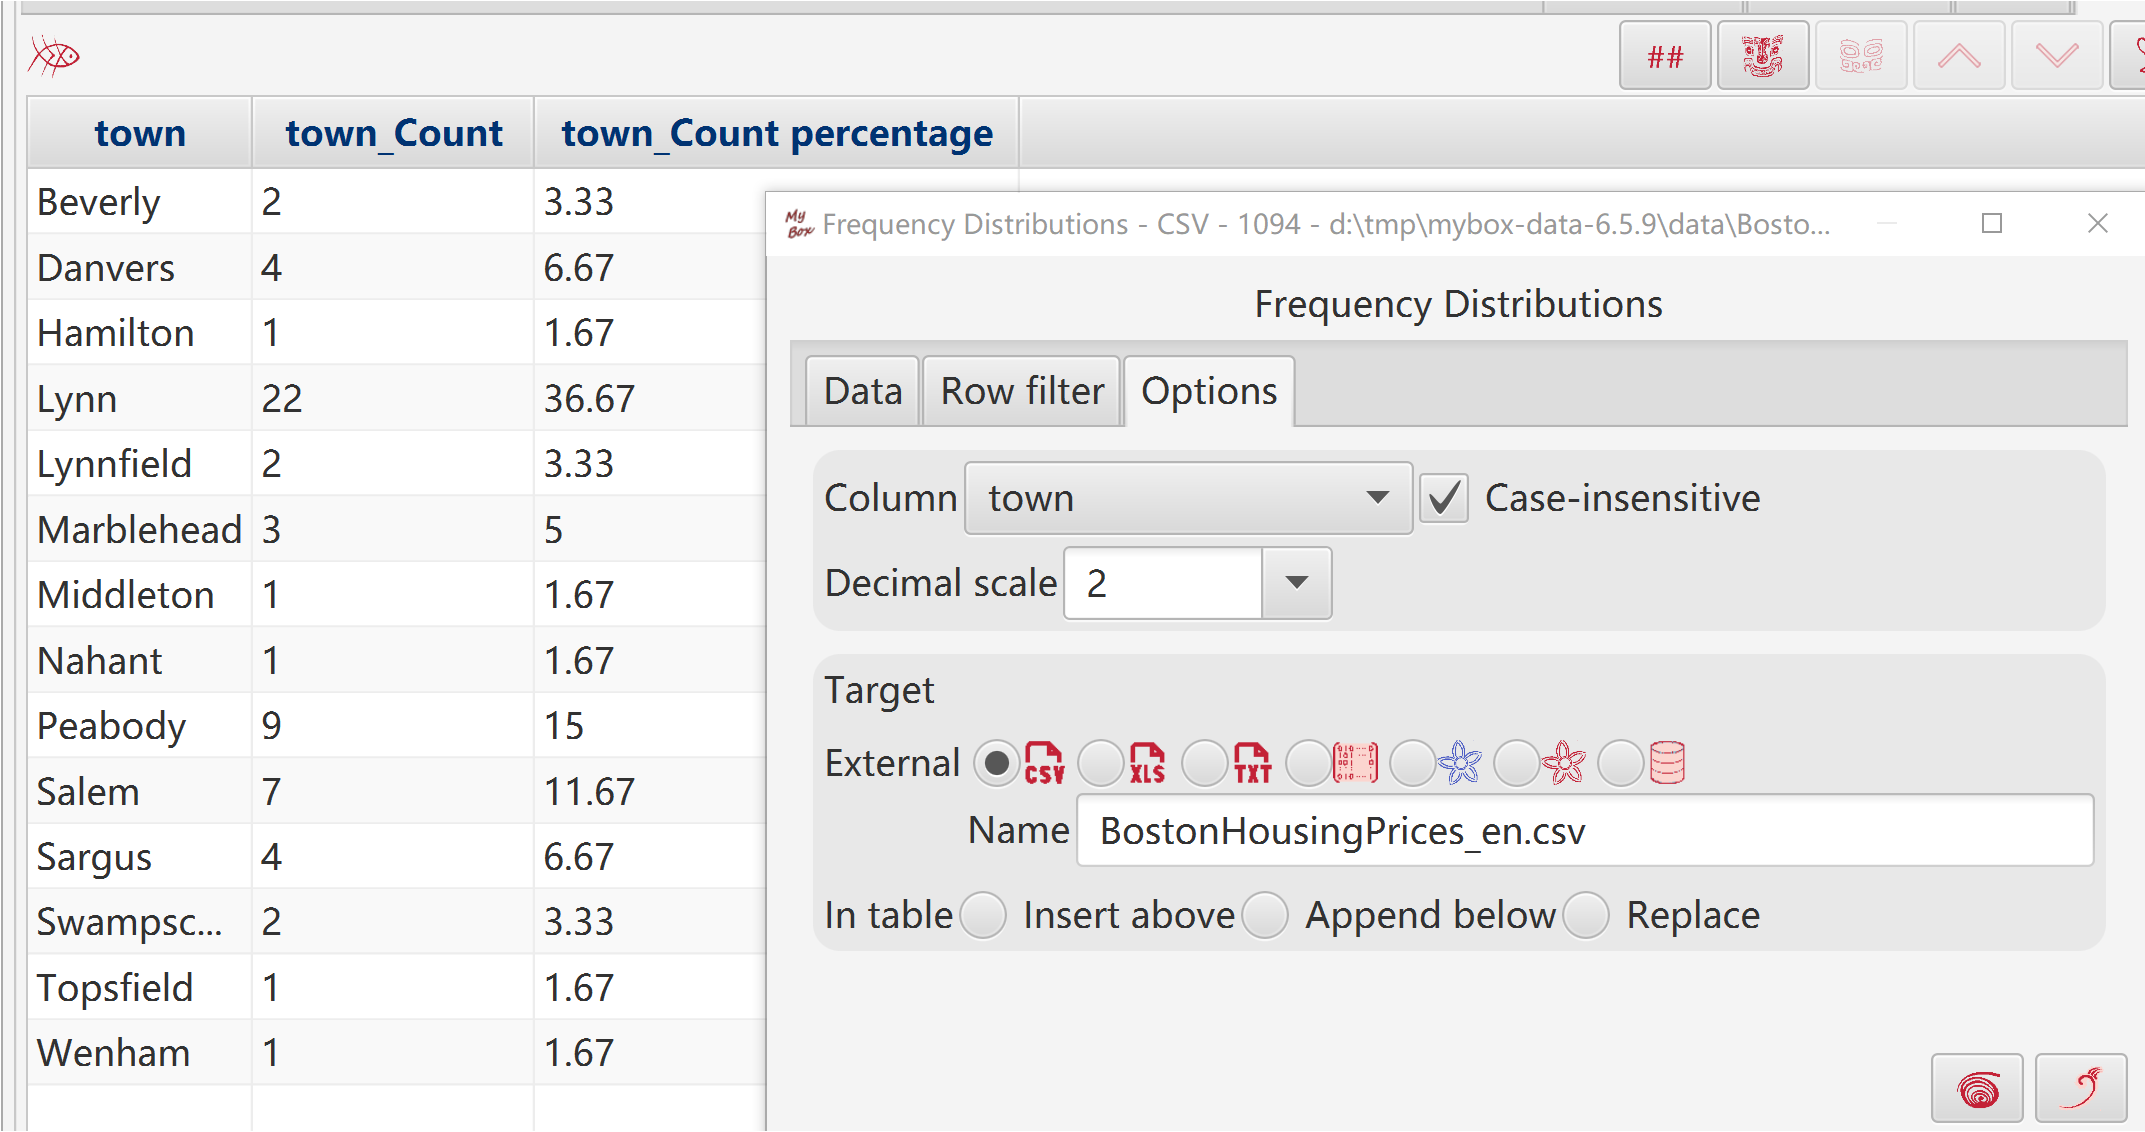
Select data row. Data filter can be set.
Select one column to count frequency.
Option whether case-insensitive
Set decimal scale.
Results can be written as external data, including: new csv/excel/text file, matrix, system clipboard, MyBox clipboard, database table, json, xml, html, or pdf.
When handle rows for current page or selected ones, results can be written in current page: insert, append, or replace data in defined location of the table.
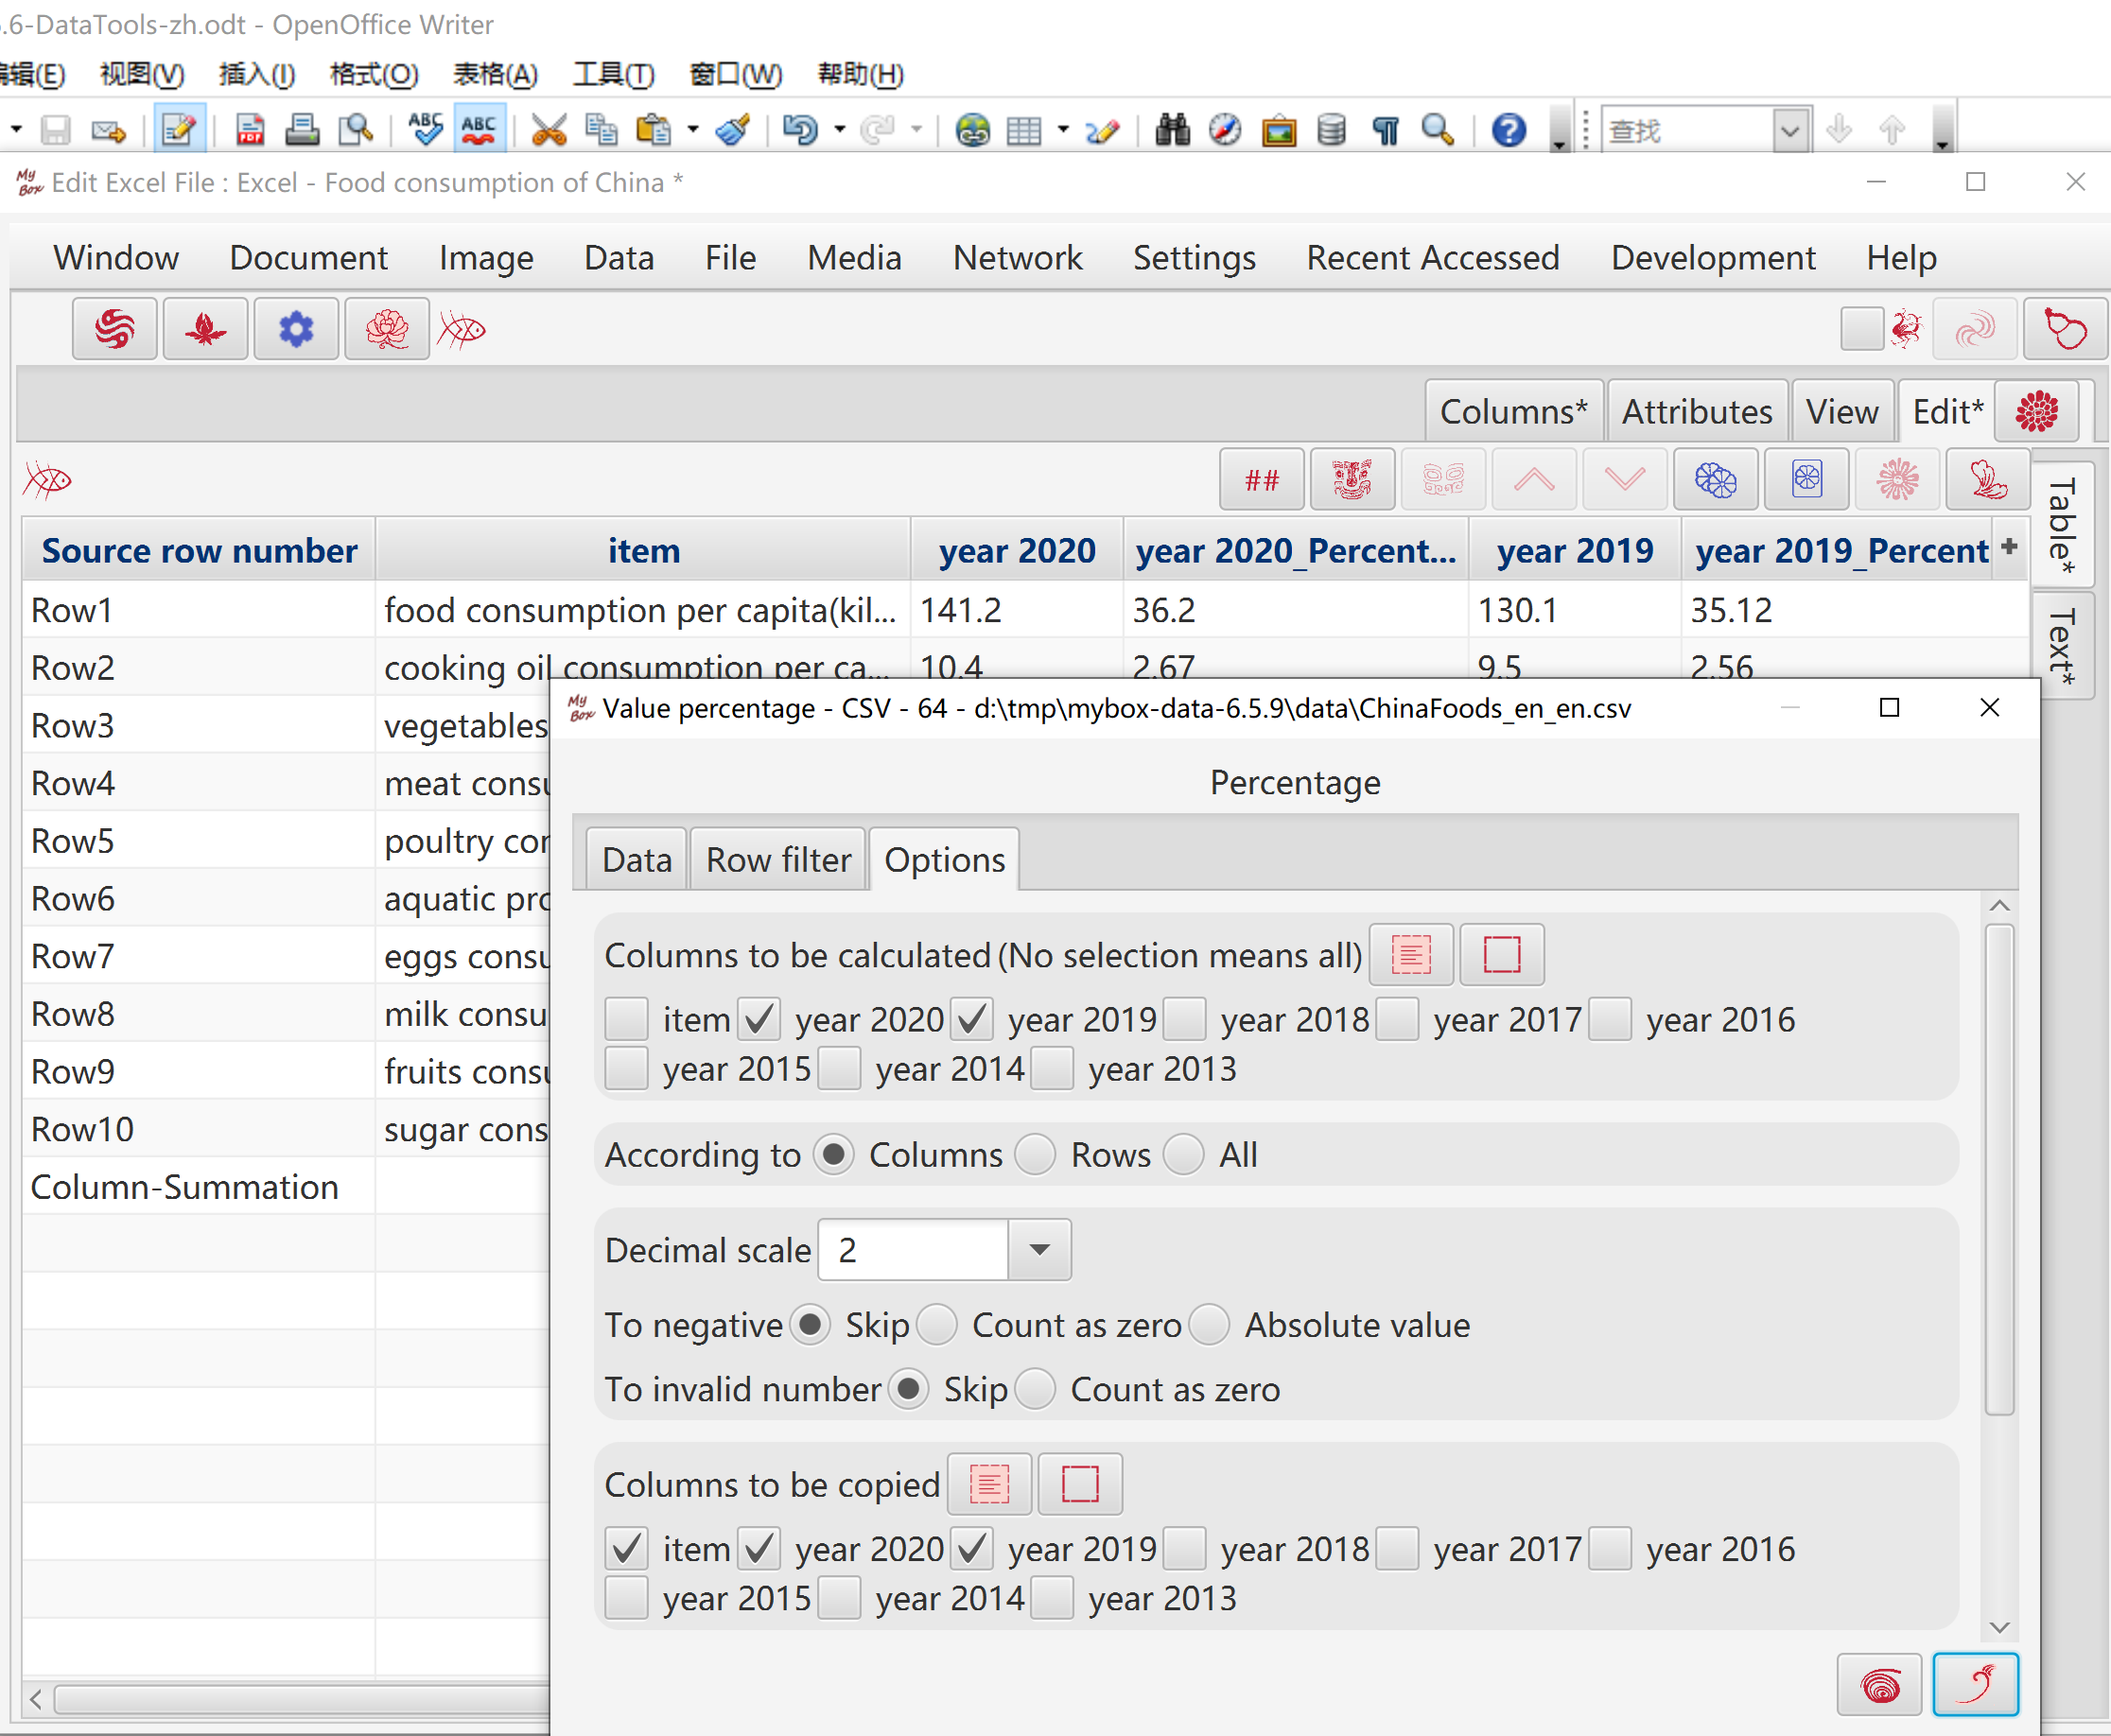
Select data row. Data filter can be set.
Select columns to be calculated.
Select objects: Accroding to columns/rows/all.
Set decimal scale.
To negative values: skip, zero, or absoluate value.
To non-numeric, skip or count as zero.
Select columns to be copied
Results can be written as external data, including: new csv/excel/text file, matrix, system clipboard, MyBox clipboard, database table, json, xml, html, or pdf.
When handle rows for current page or selected ones, results can be written in current page: insert, append, or replace data in defined location of the table.
Hover or click button “Function” to select functions under menu item “Charts”.
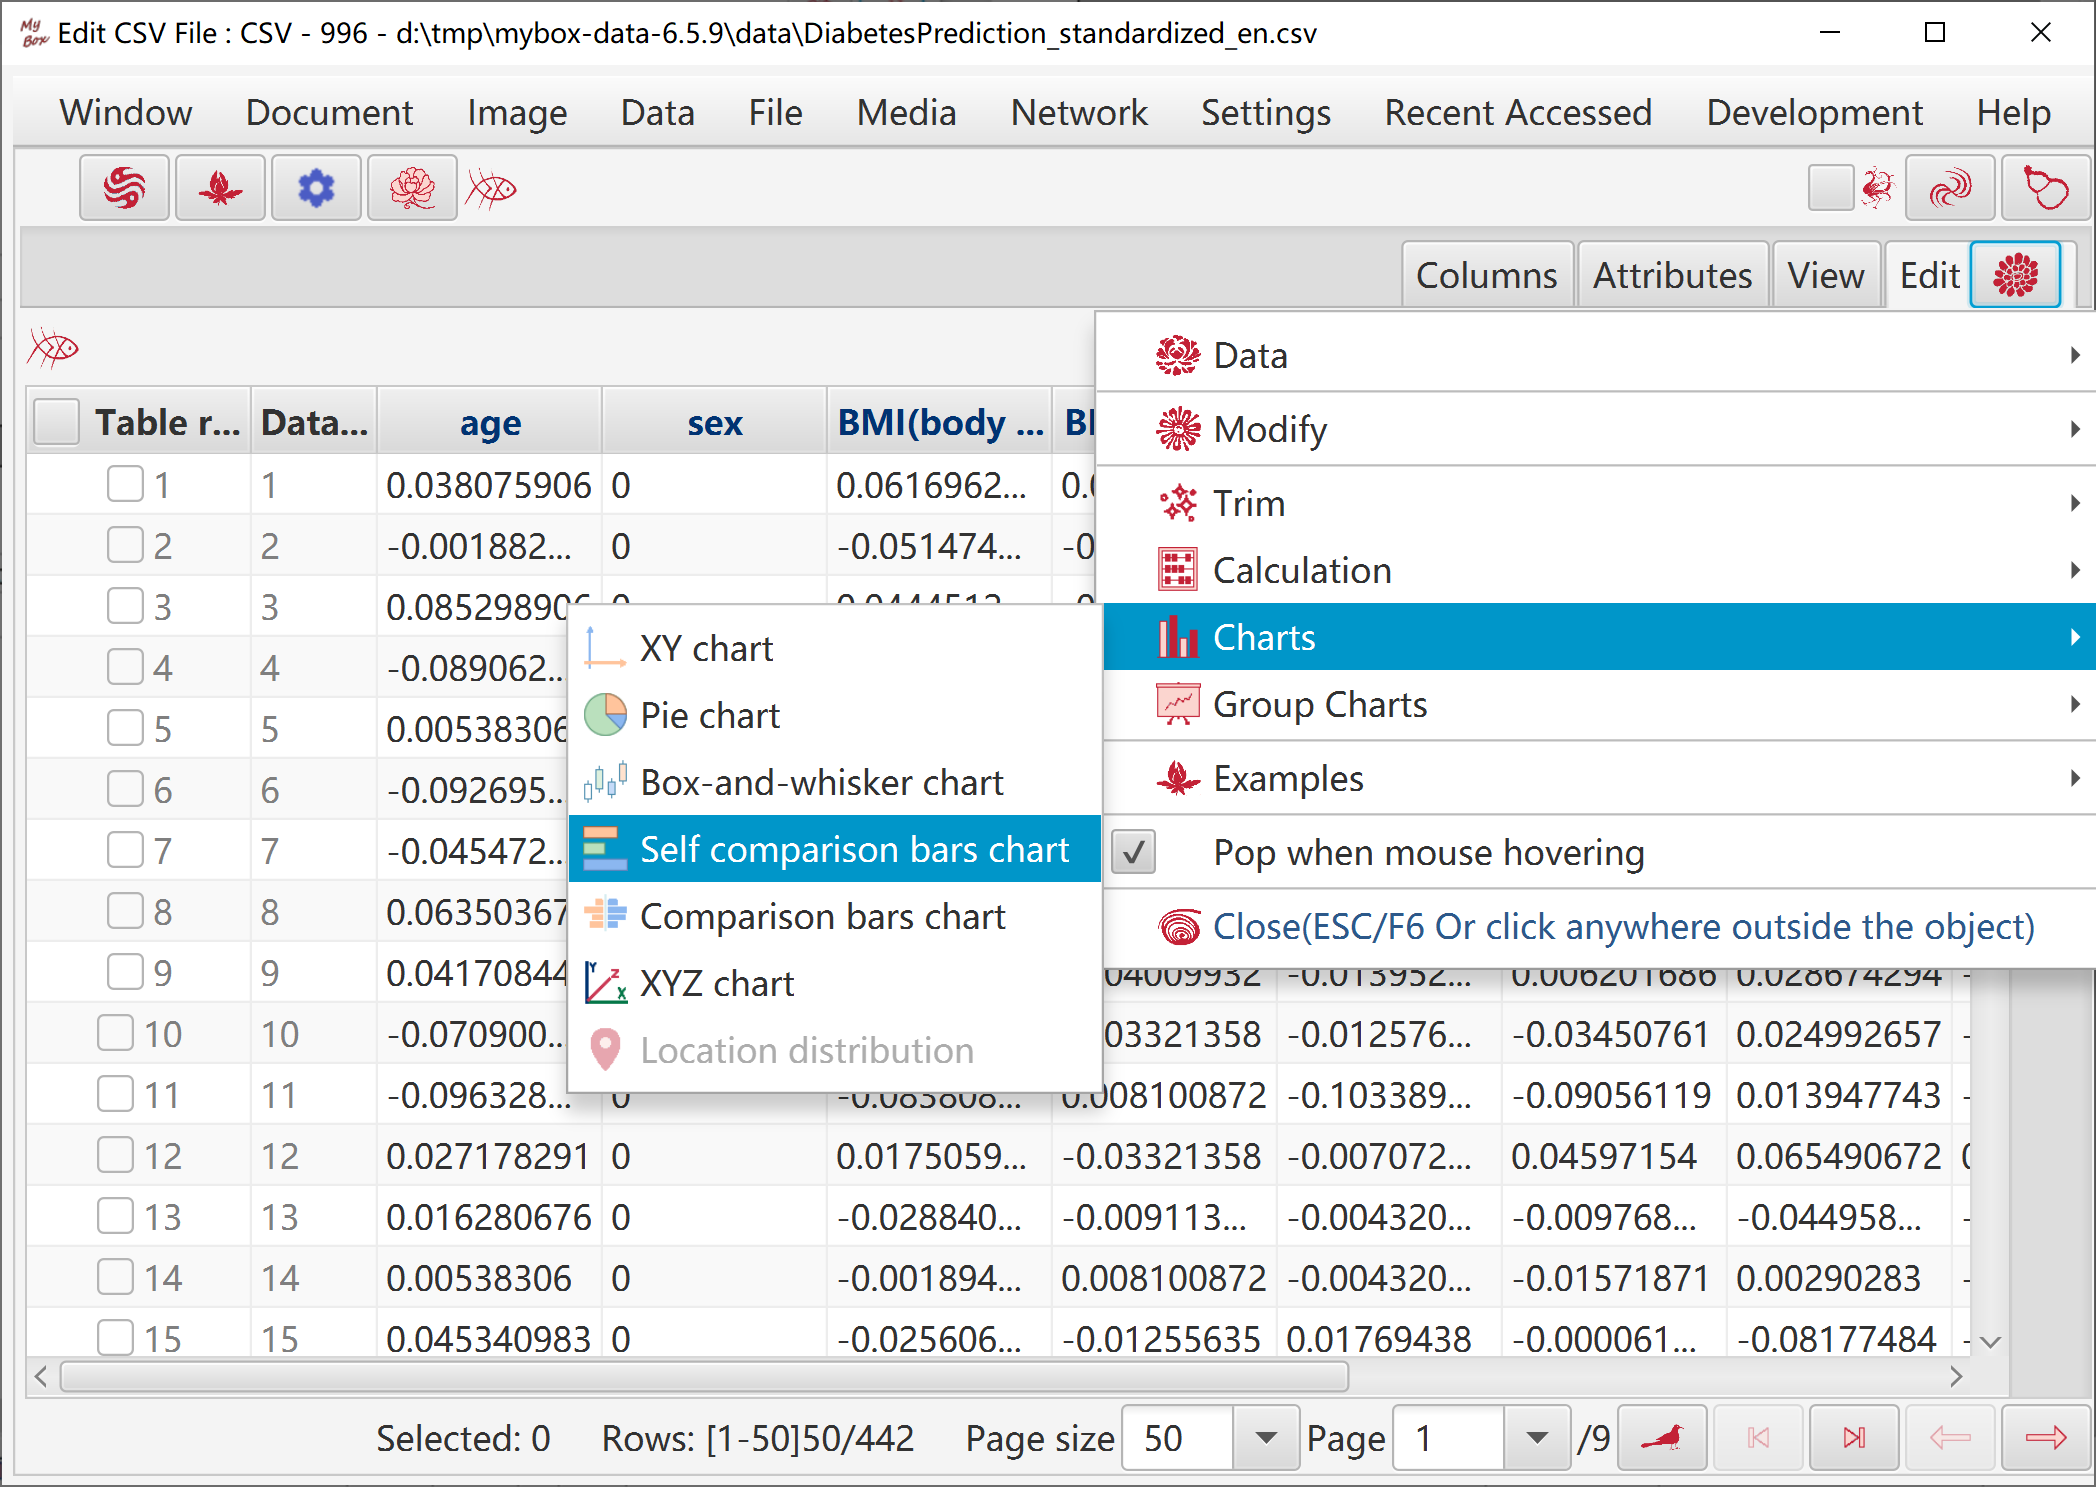
Select data rows. Data filter can be set.
Select type of XY Chart.
Select one column as "Category Axis", to define data names.
Select several columns as "Value Axis". Different value series are shown in different colors or shapes.
By default, "Category Axis" is the horizontal axis and "Number Axis" is the vertical axis.
To invalid data:, skip or count as zero.
When display all data rows(all pages), need concern memory limitation.
Click button “Menu” to set parameters of chart.
Click button “Pop” to display current chart as image in popped window.
Click button “Data” to display data of the chart in data table.
Click button “Html” to display data of the chart in html page.
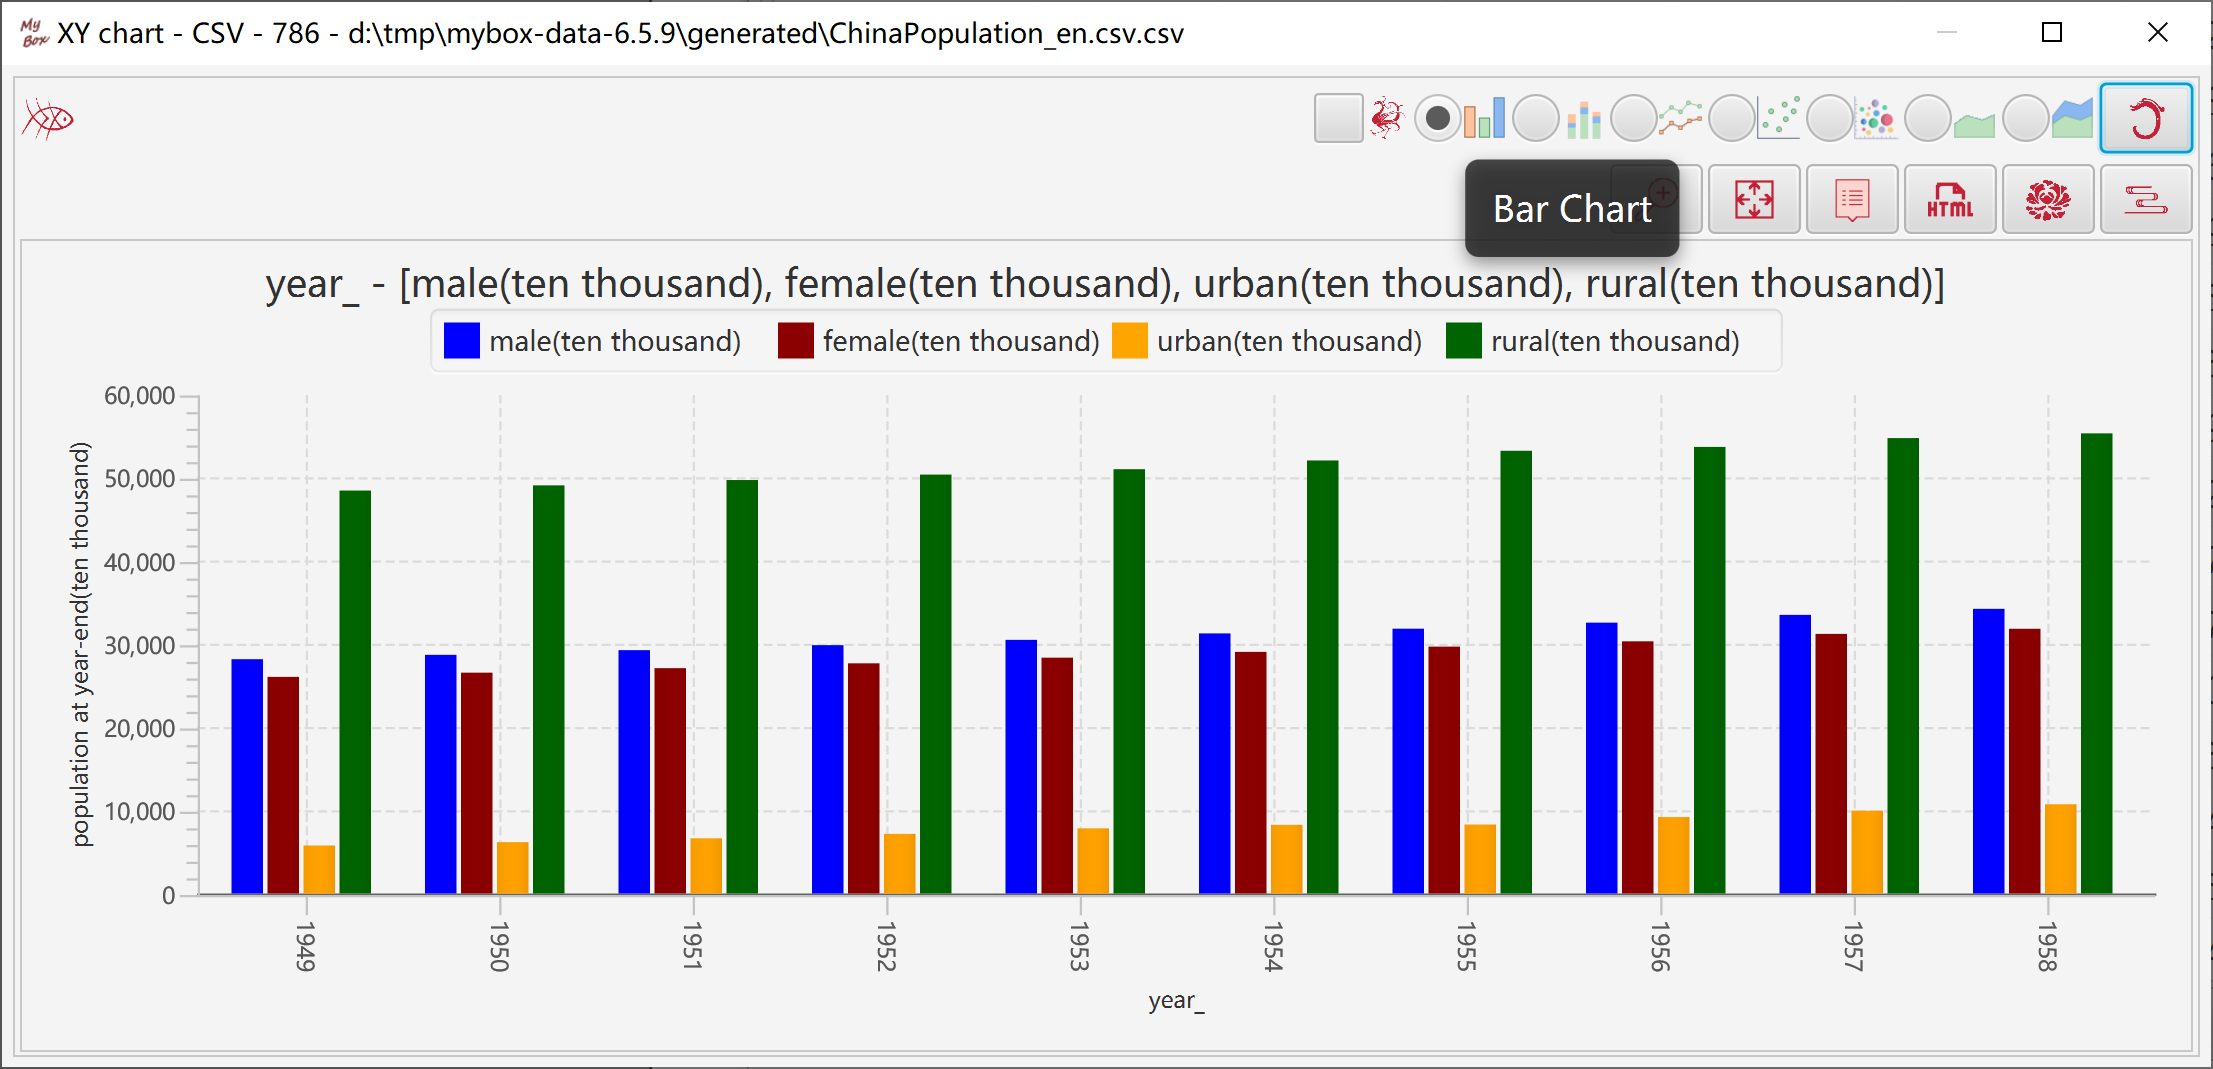
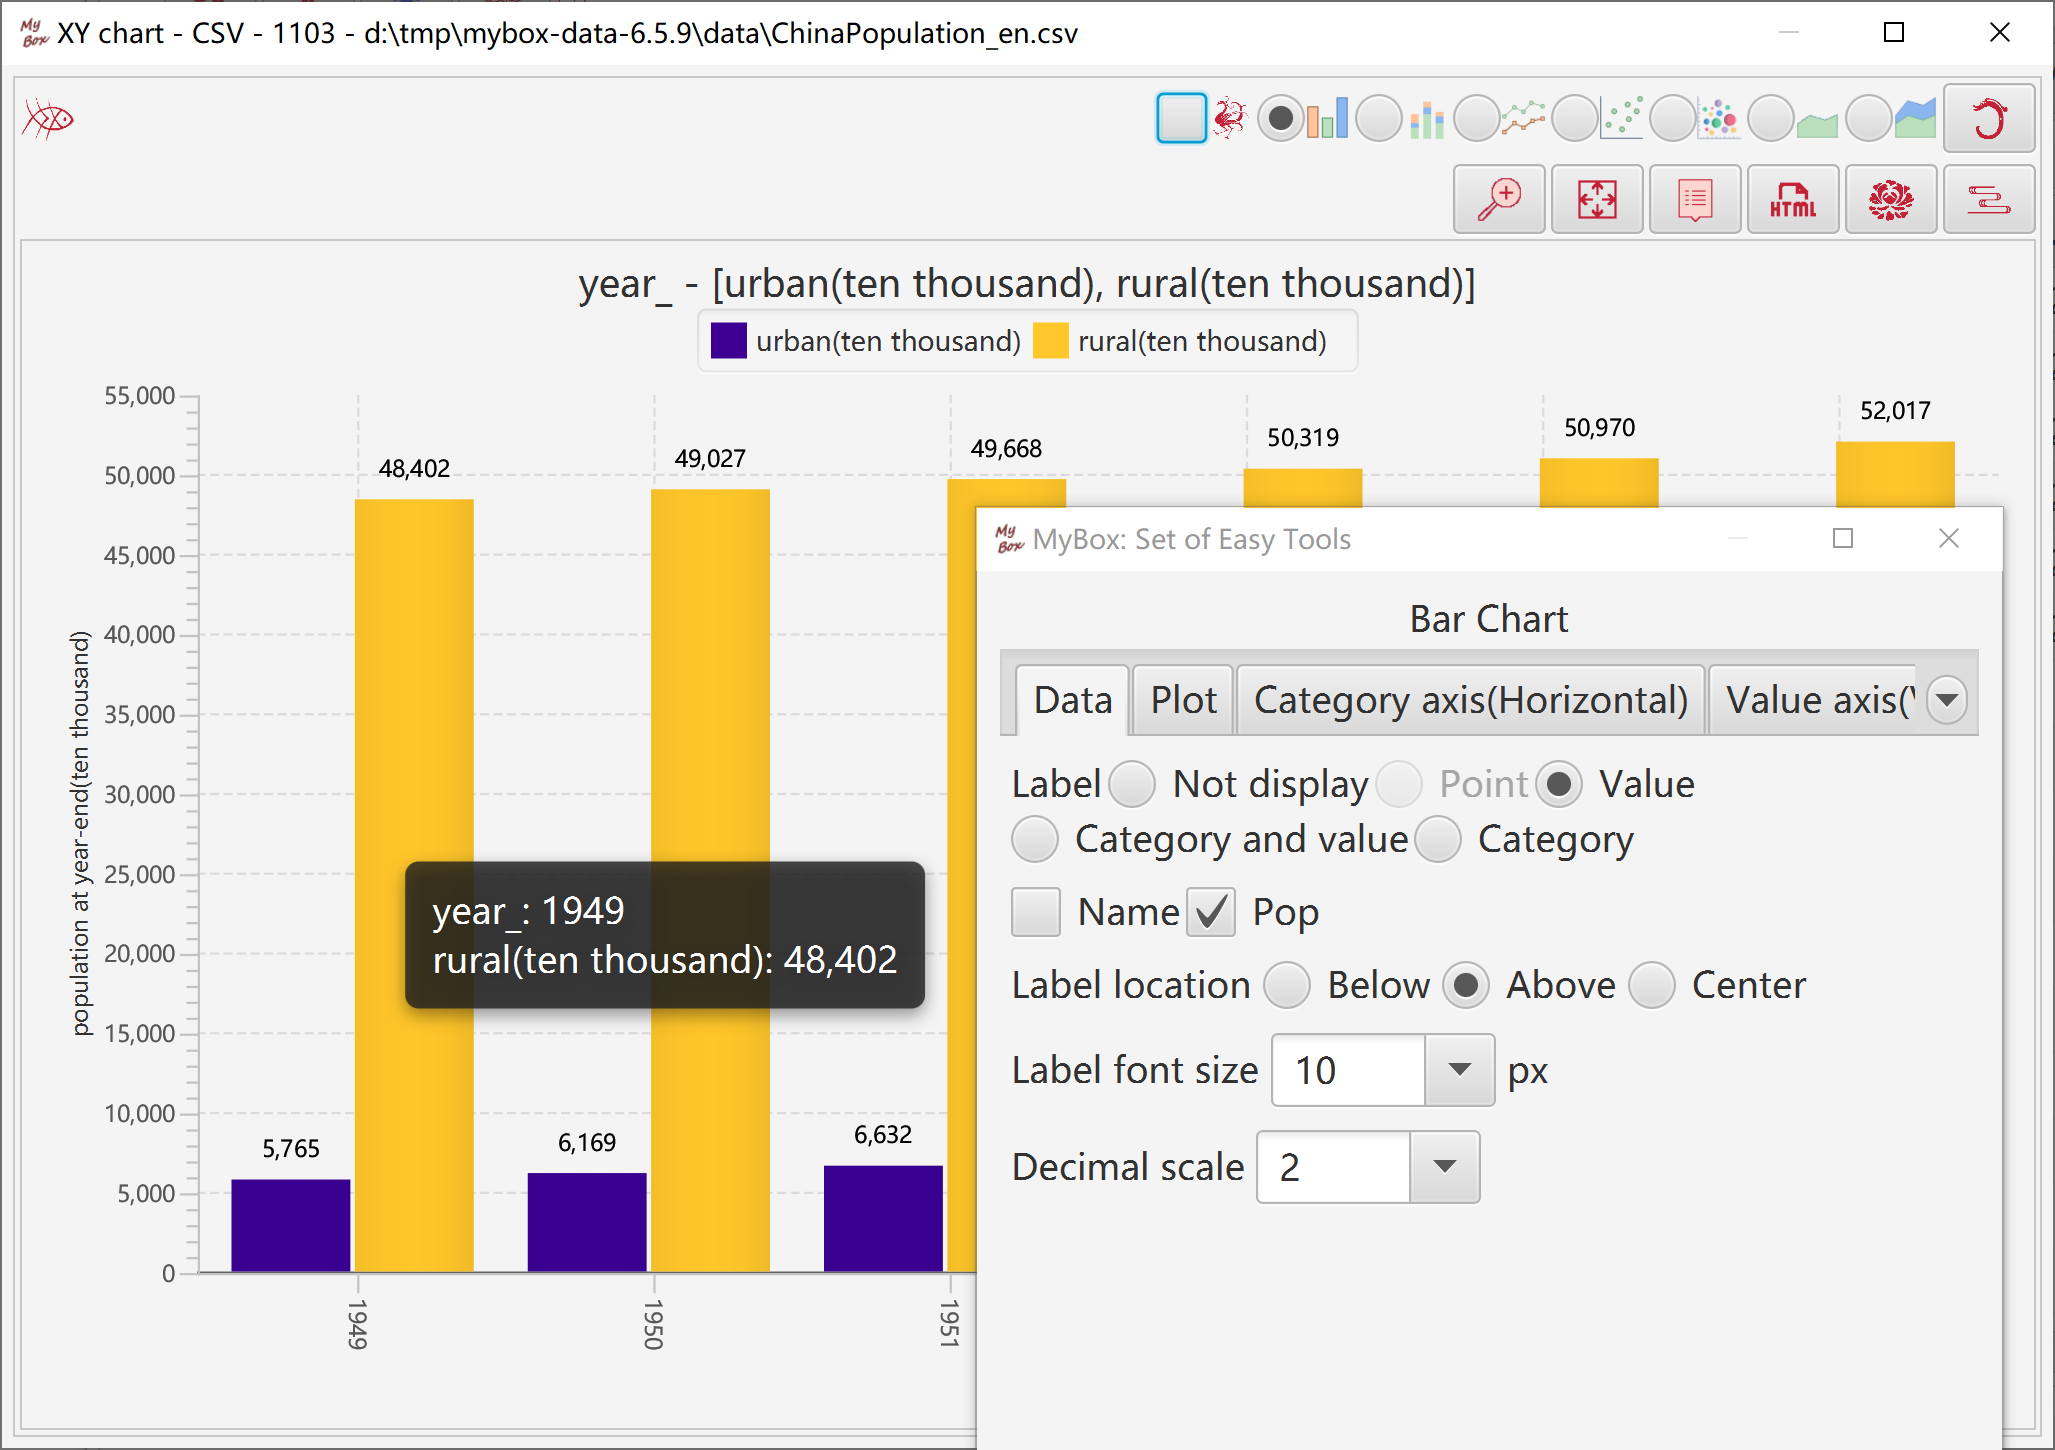
Represents data size with bars' heights.
"Category" column is always counted as strings.
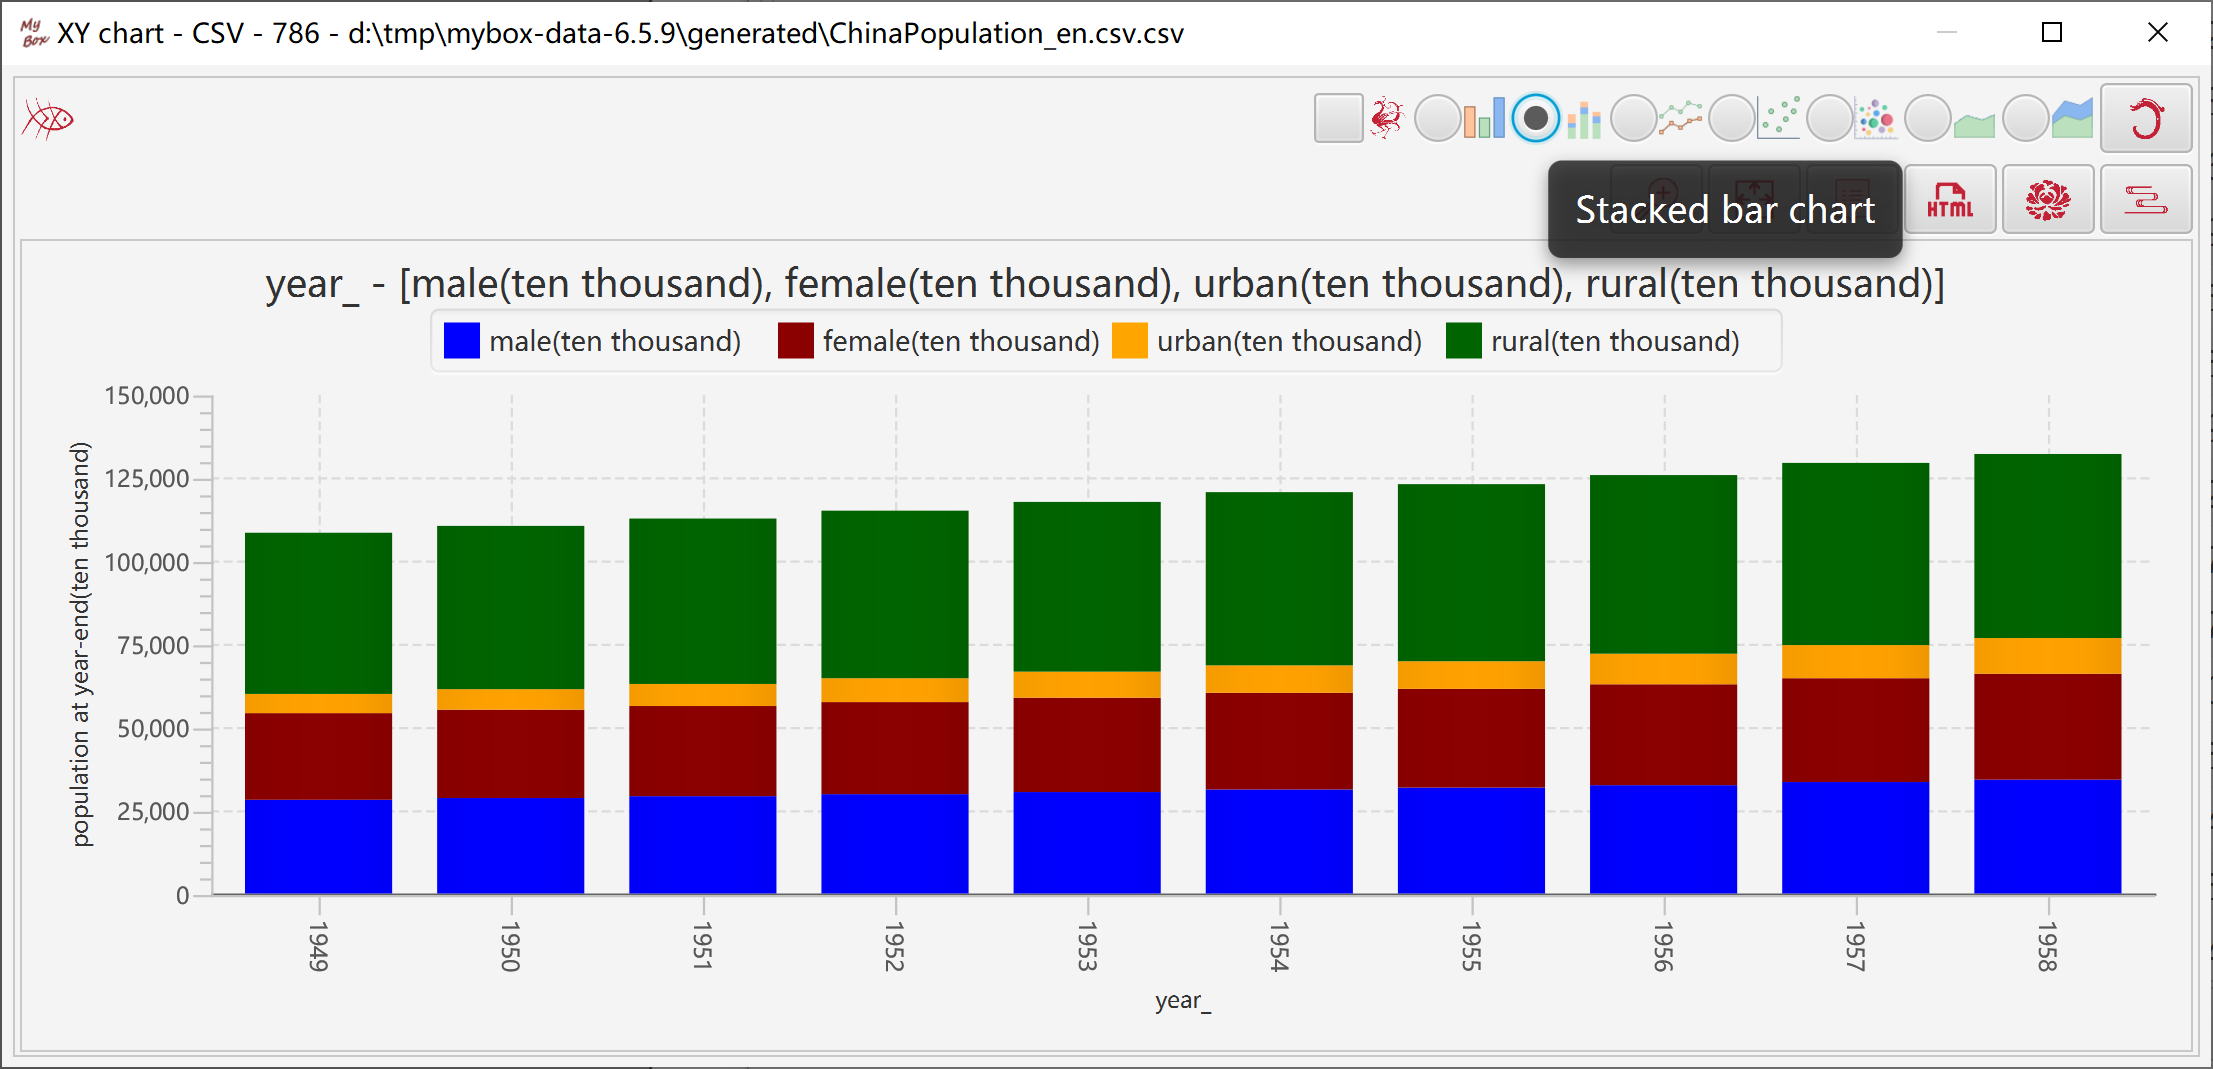
Represents data size with bars' heights.
"Category" column is always counted as strings.
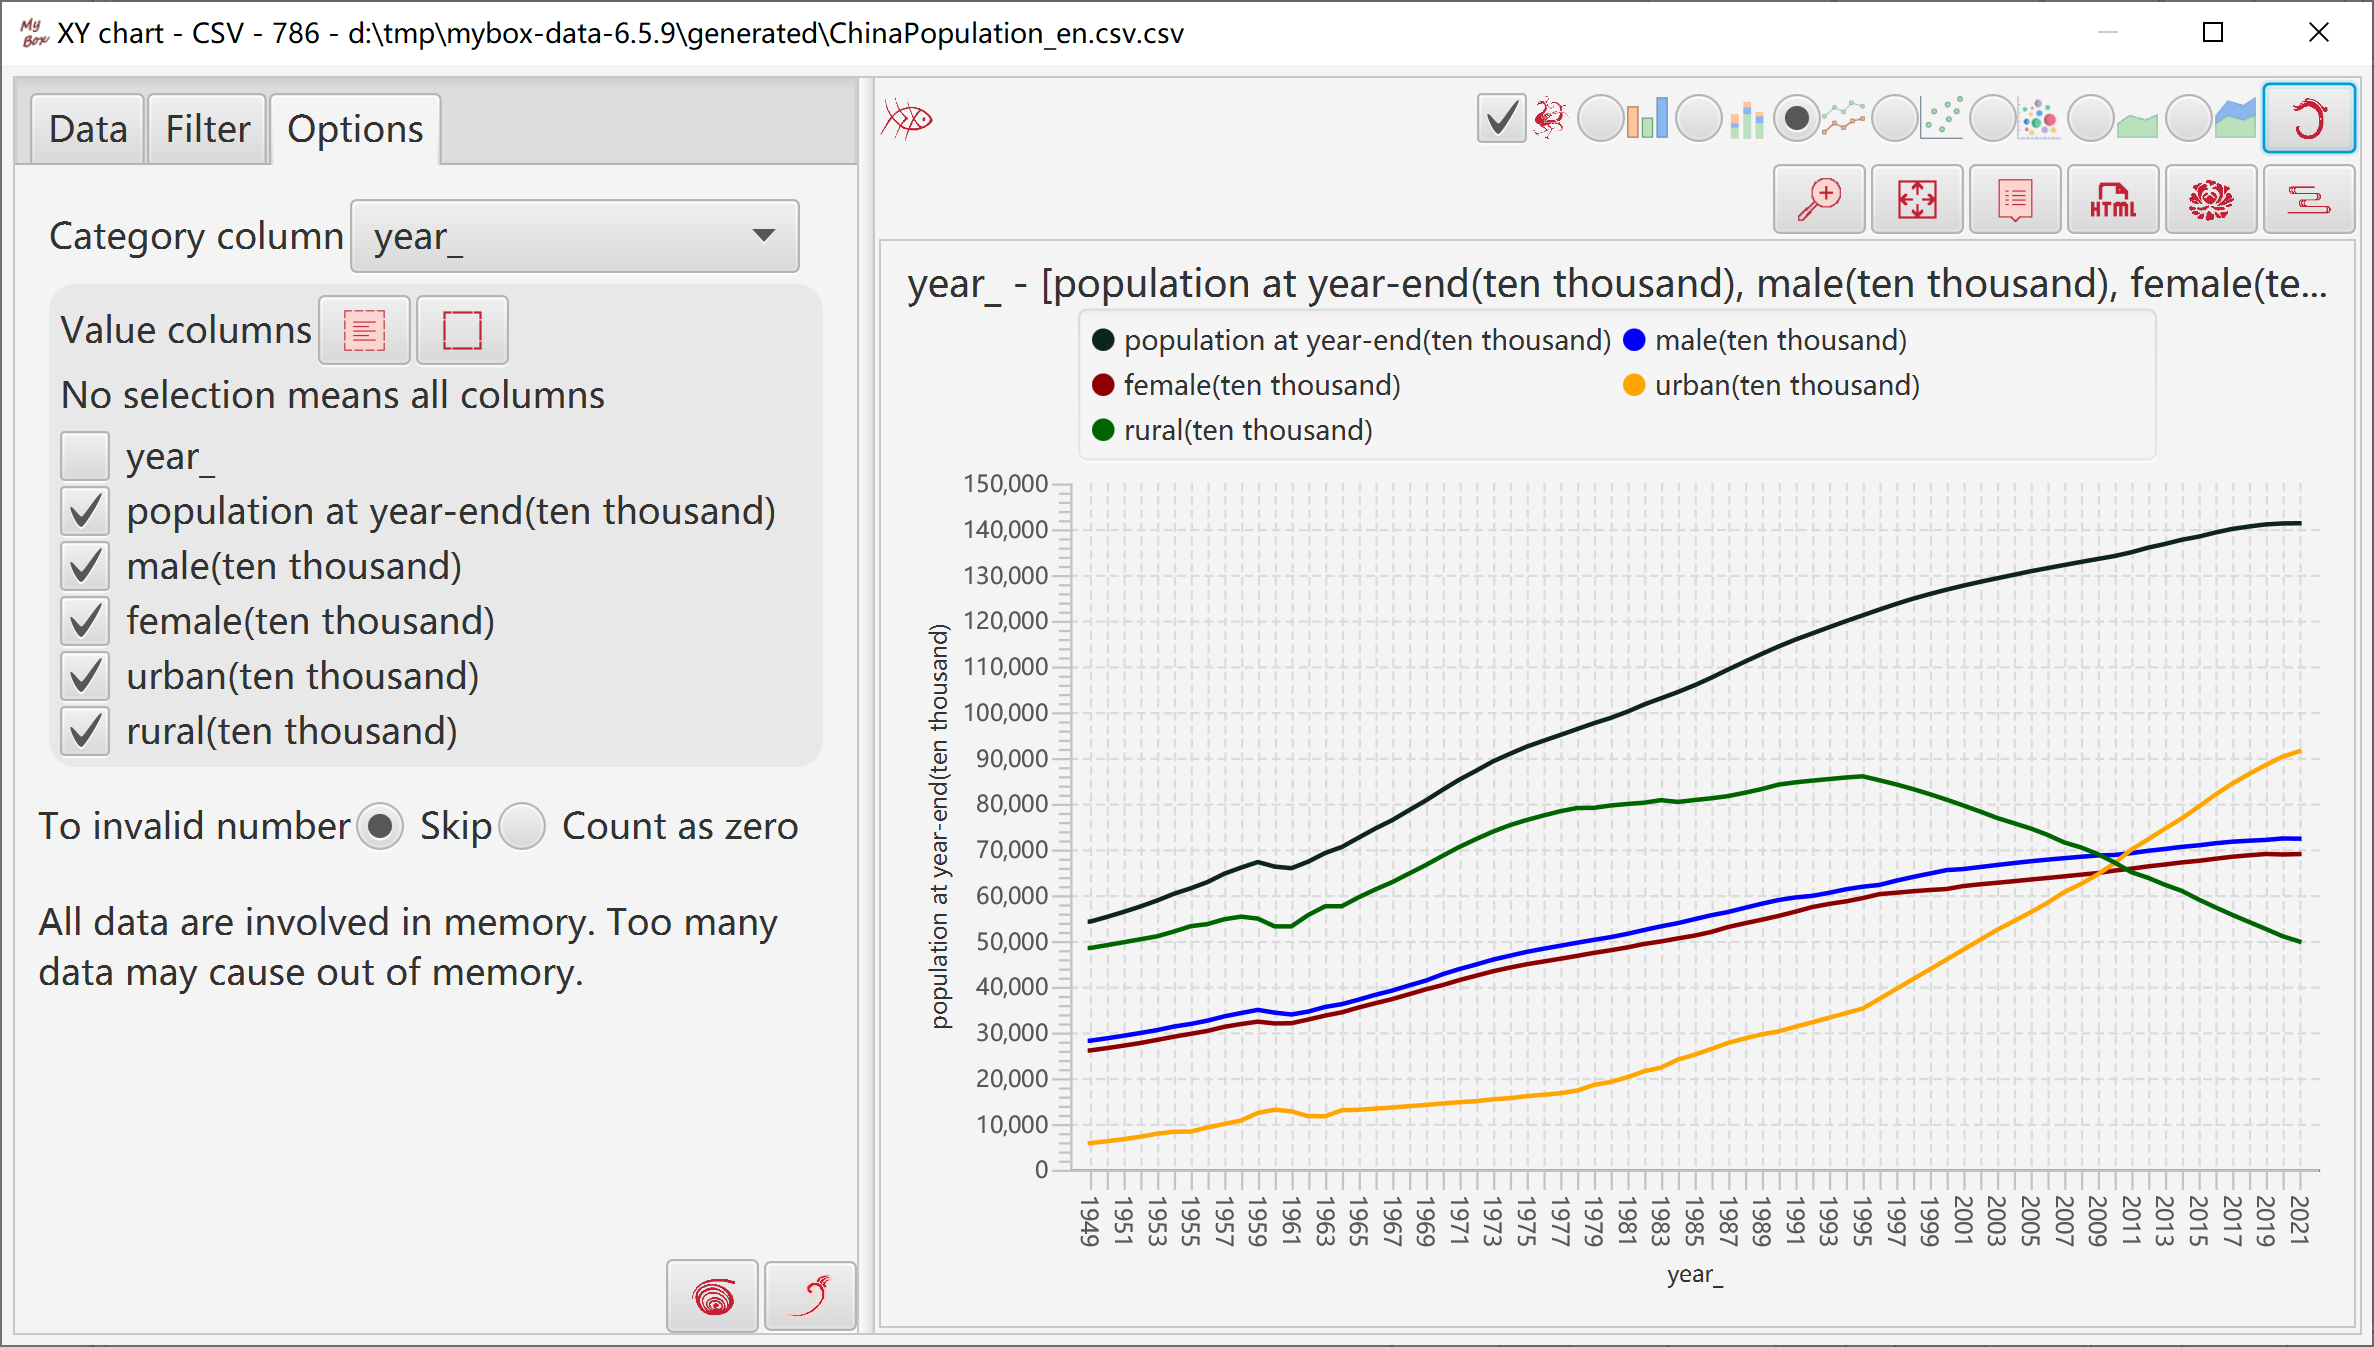
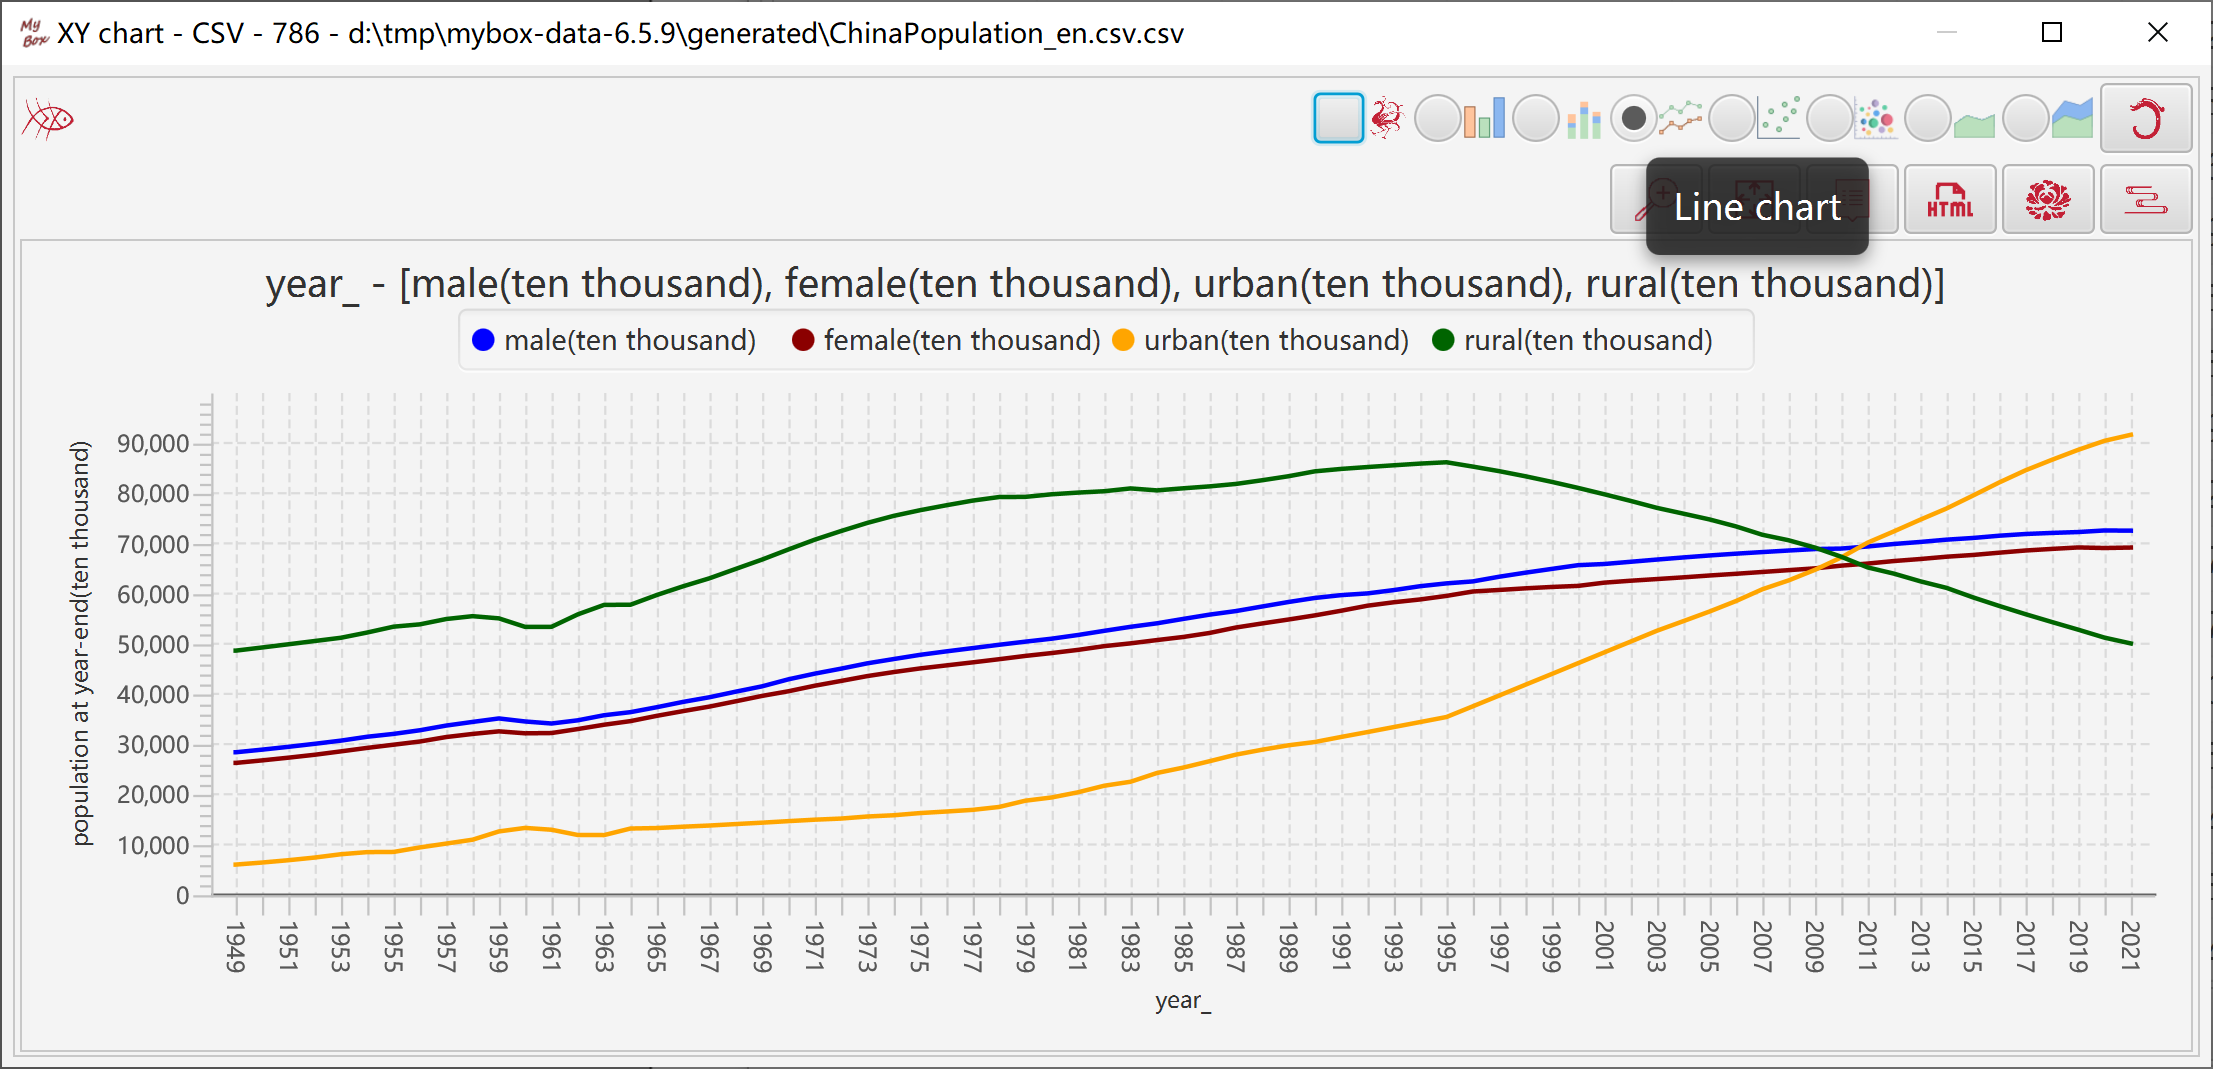
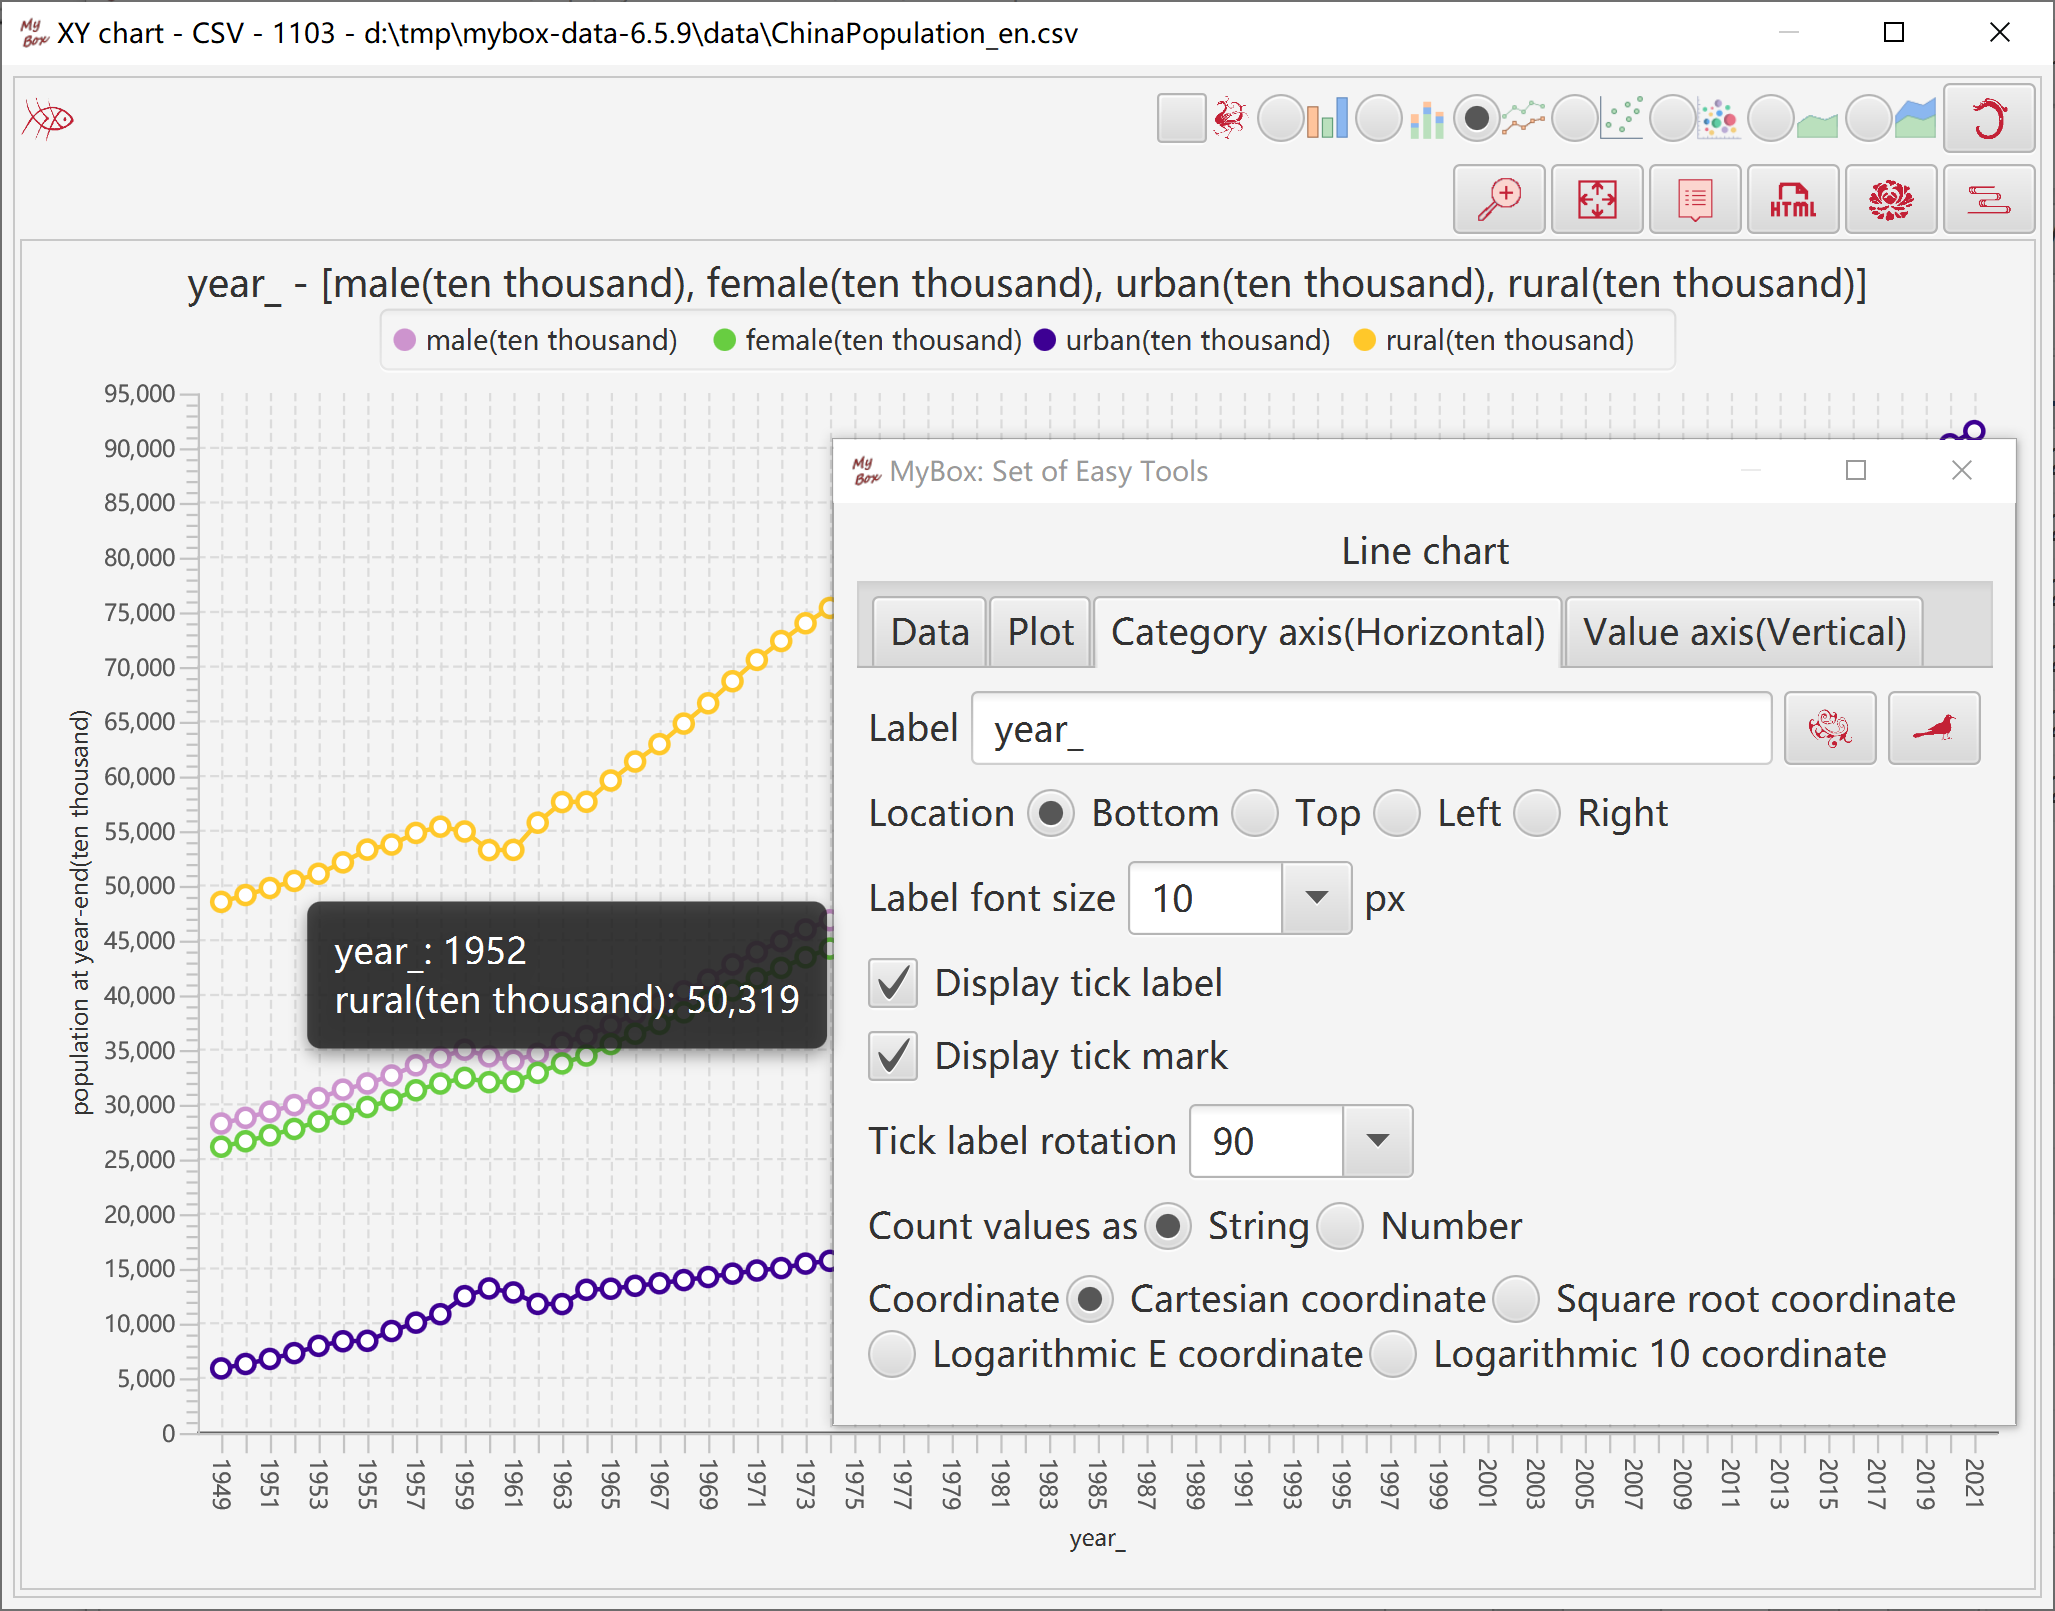
Represents data trend with lines connecting points.
"Category" column can be counted as strings or numbers.
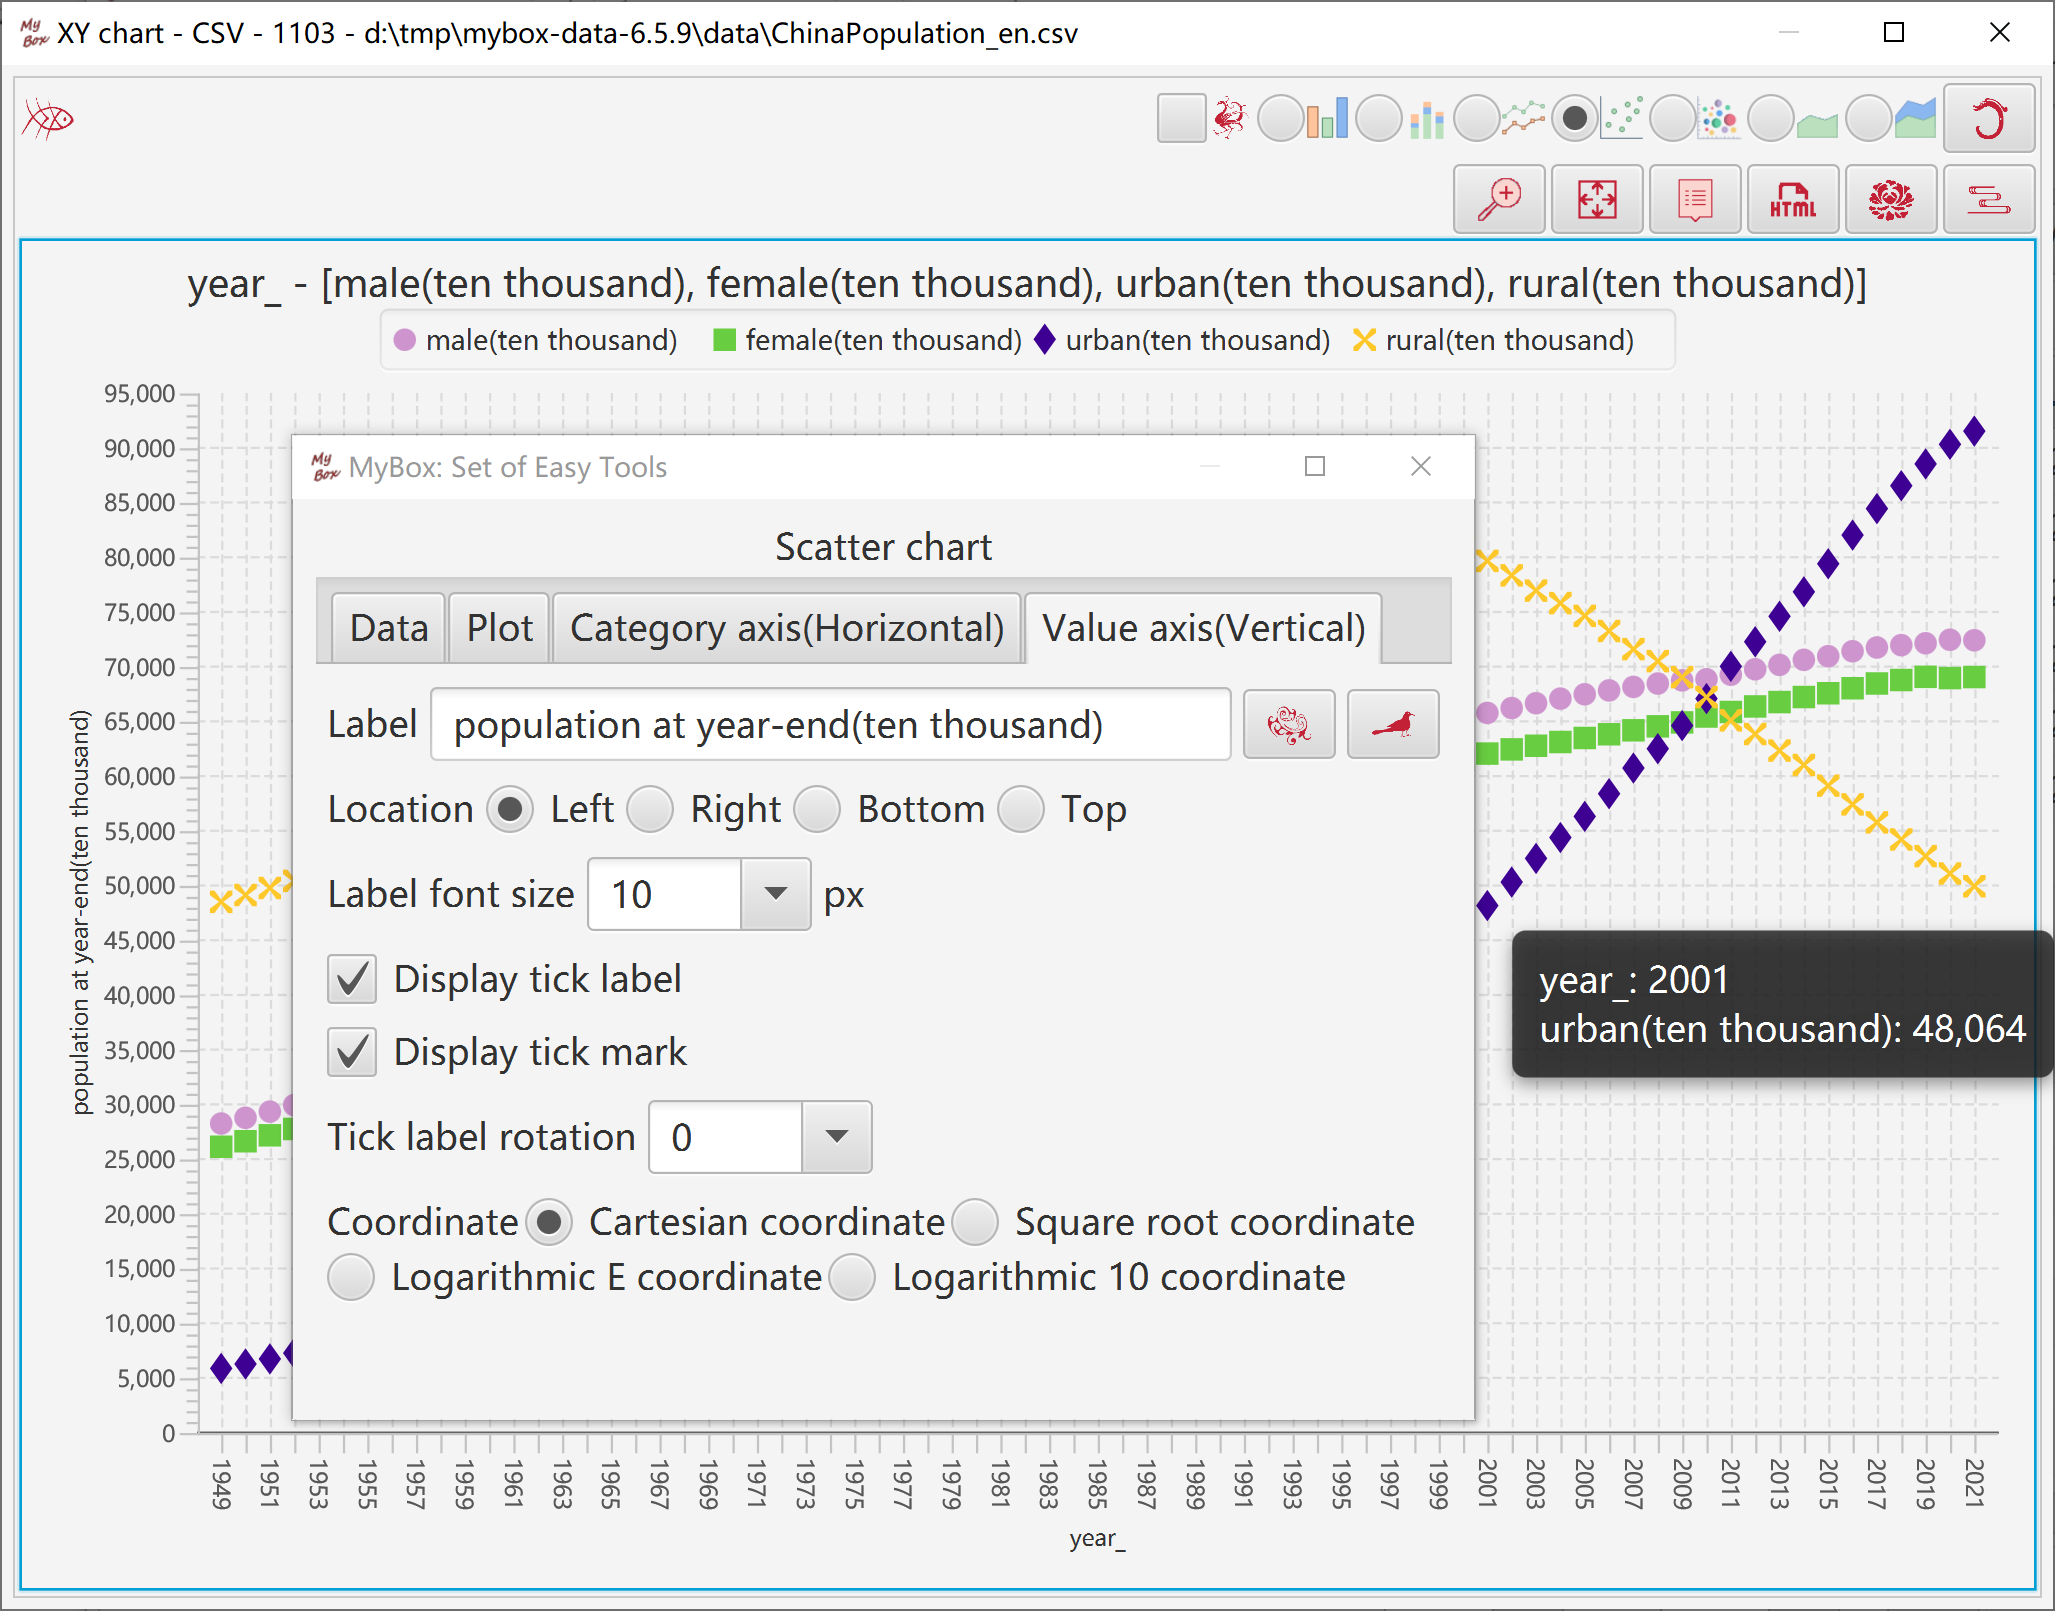
Represents data distribution with symbols.
"Category" column can be counted as strings or numbers.

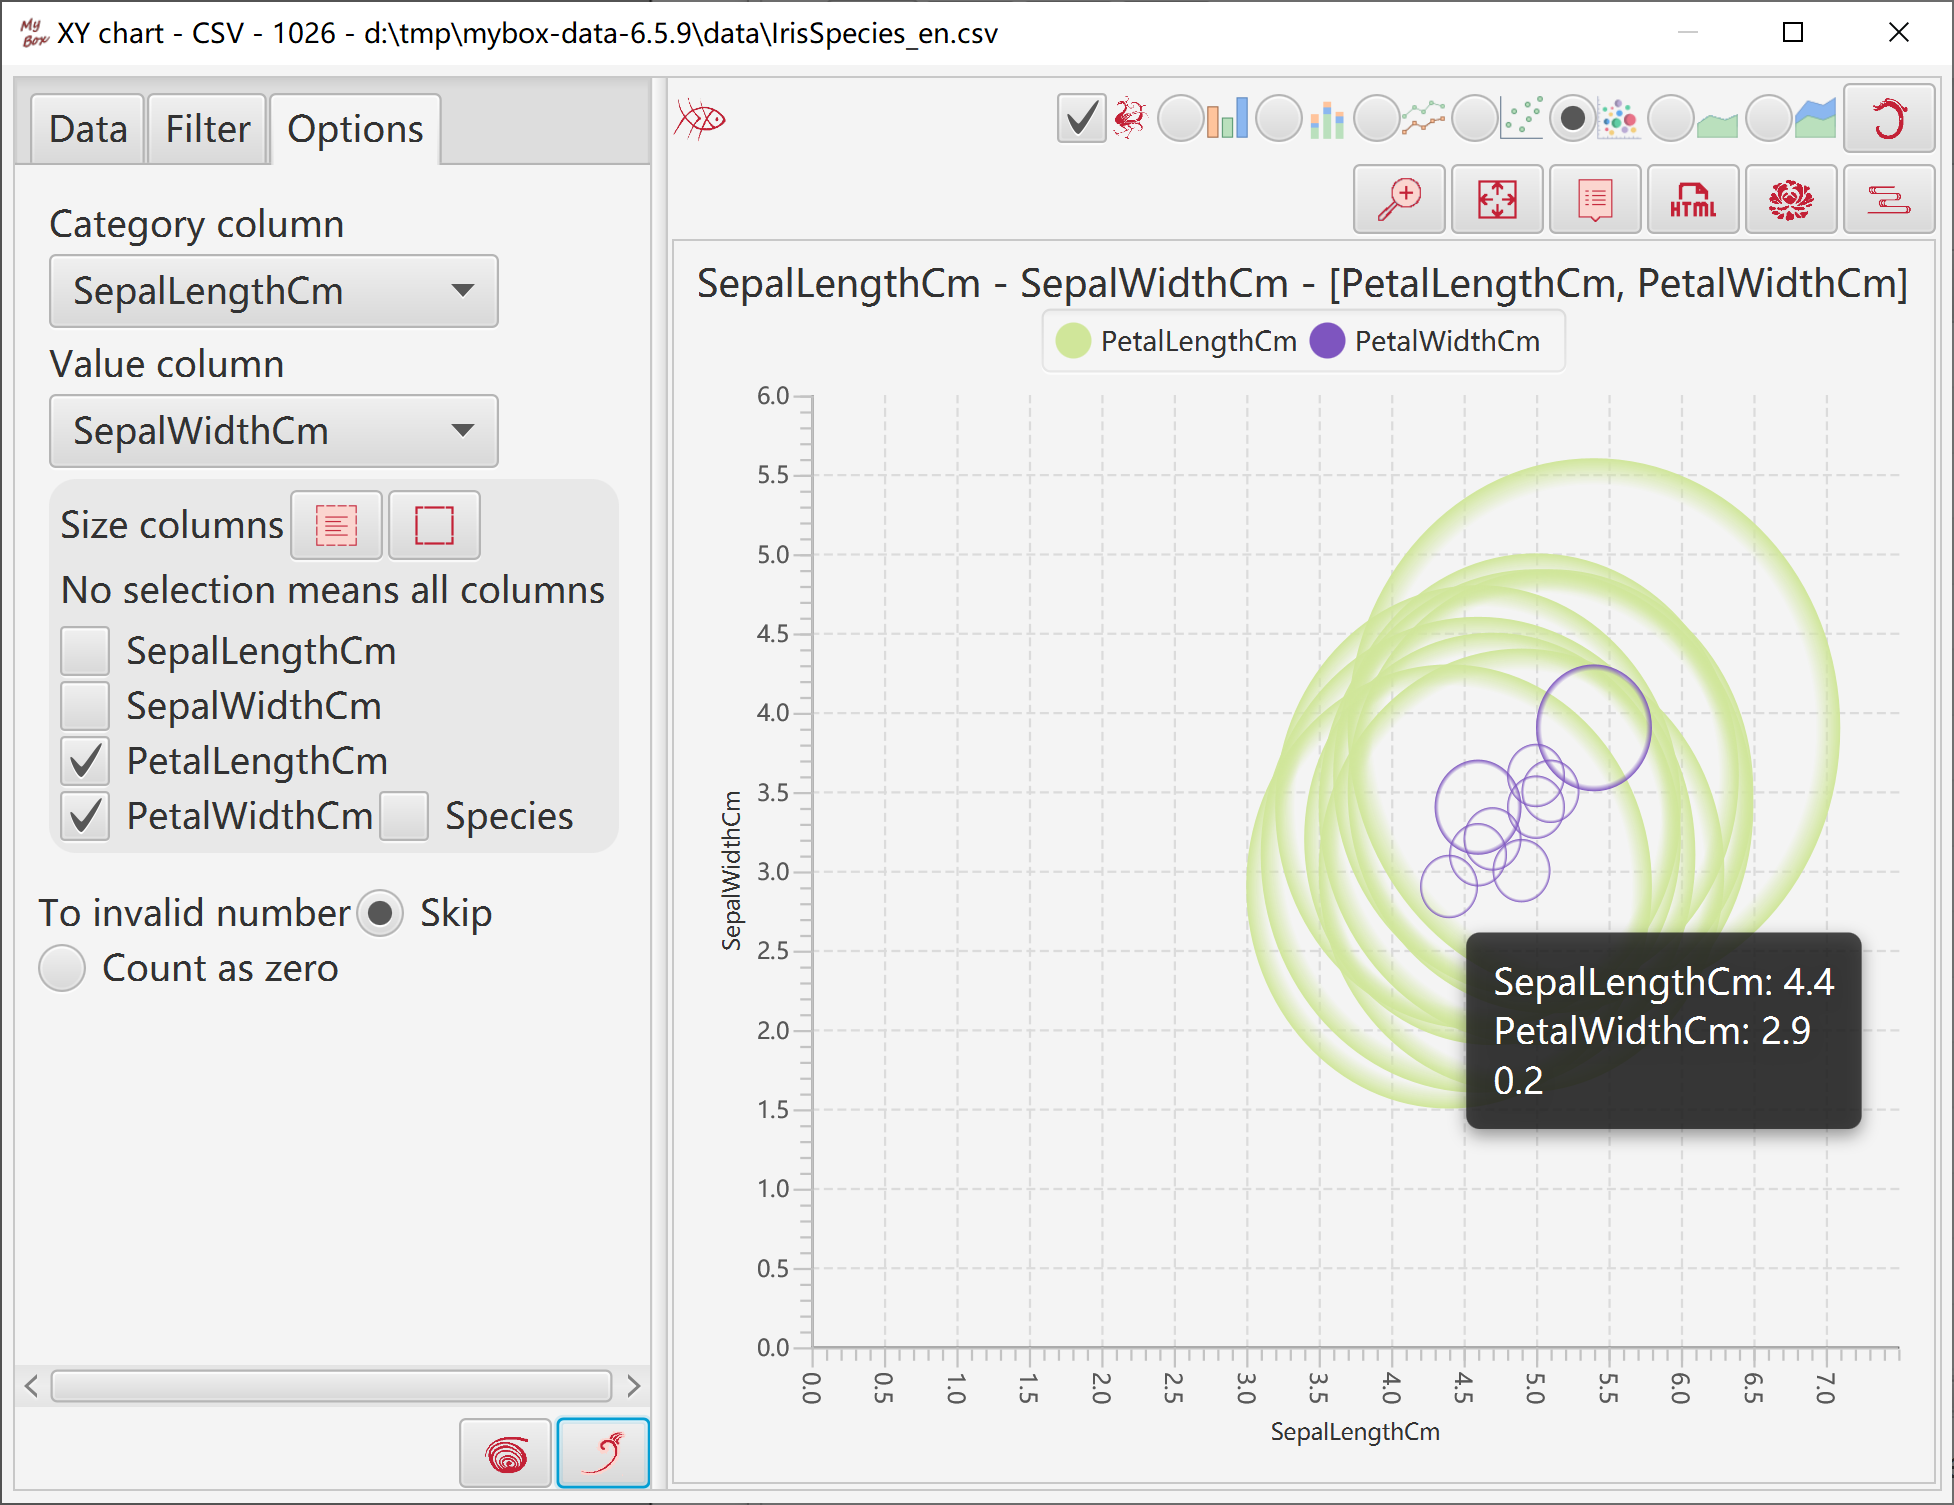
Represents data size with circles of different radius:
"Category Column" and "Value Column" define coordinates of data.
Select several columns as "Size Columns" to defines data size.
All columns should be numbers. Size columns should be non-negative.
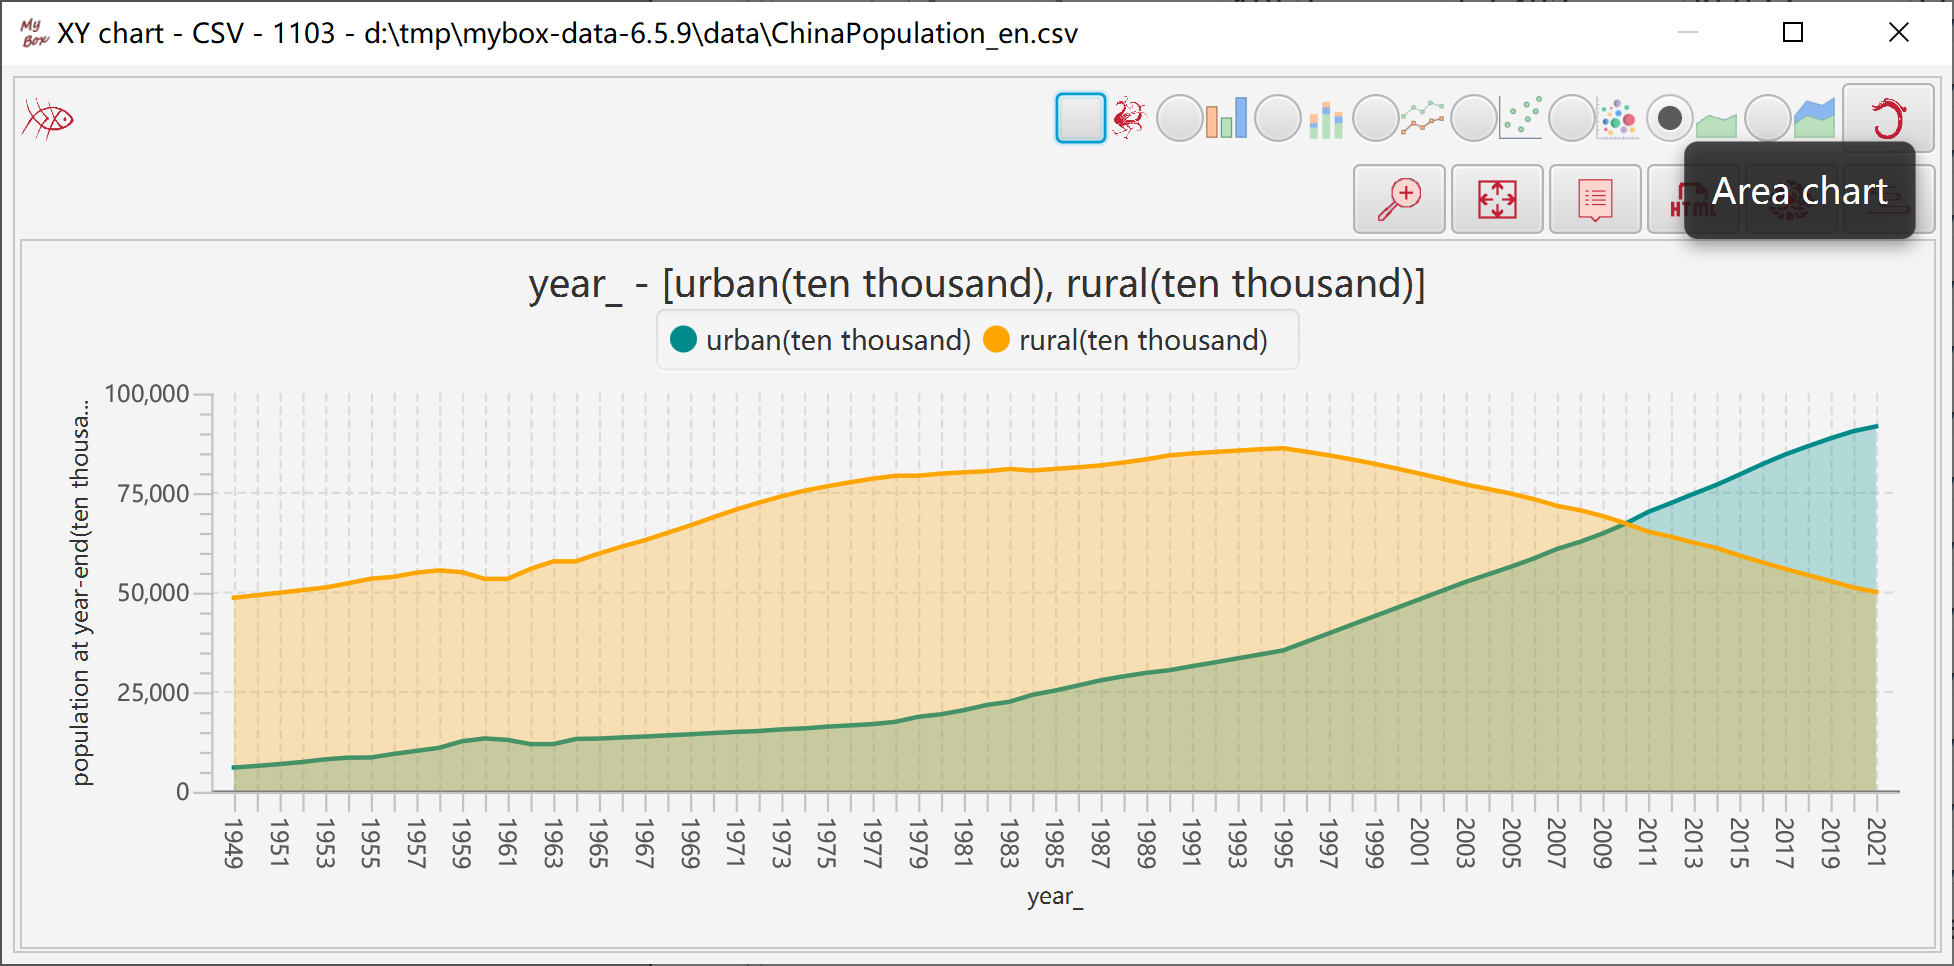
Represents data size with area size.
"Category" column is always counted as strings.
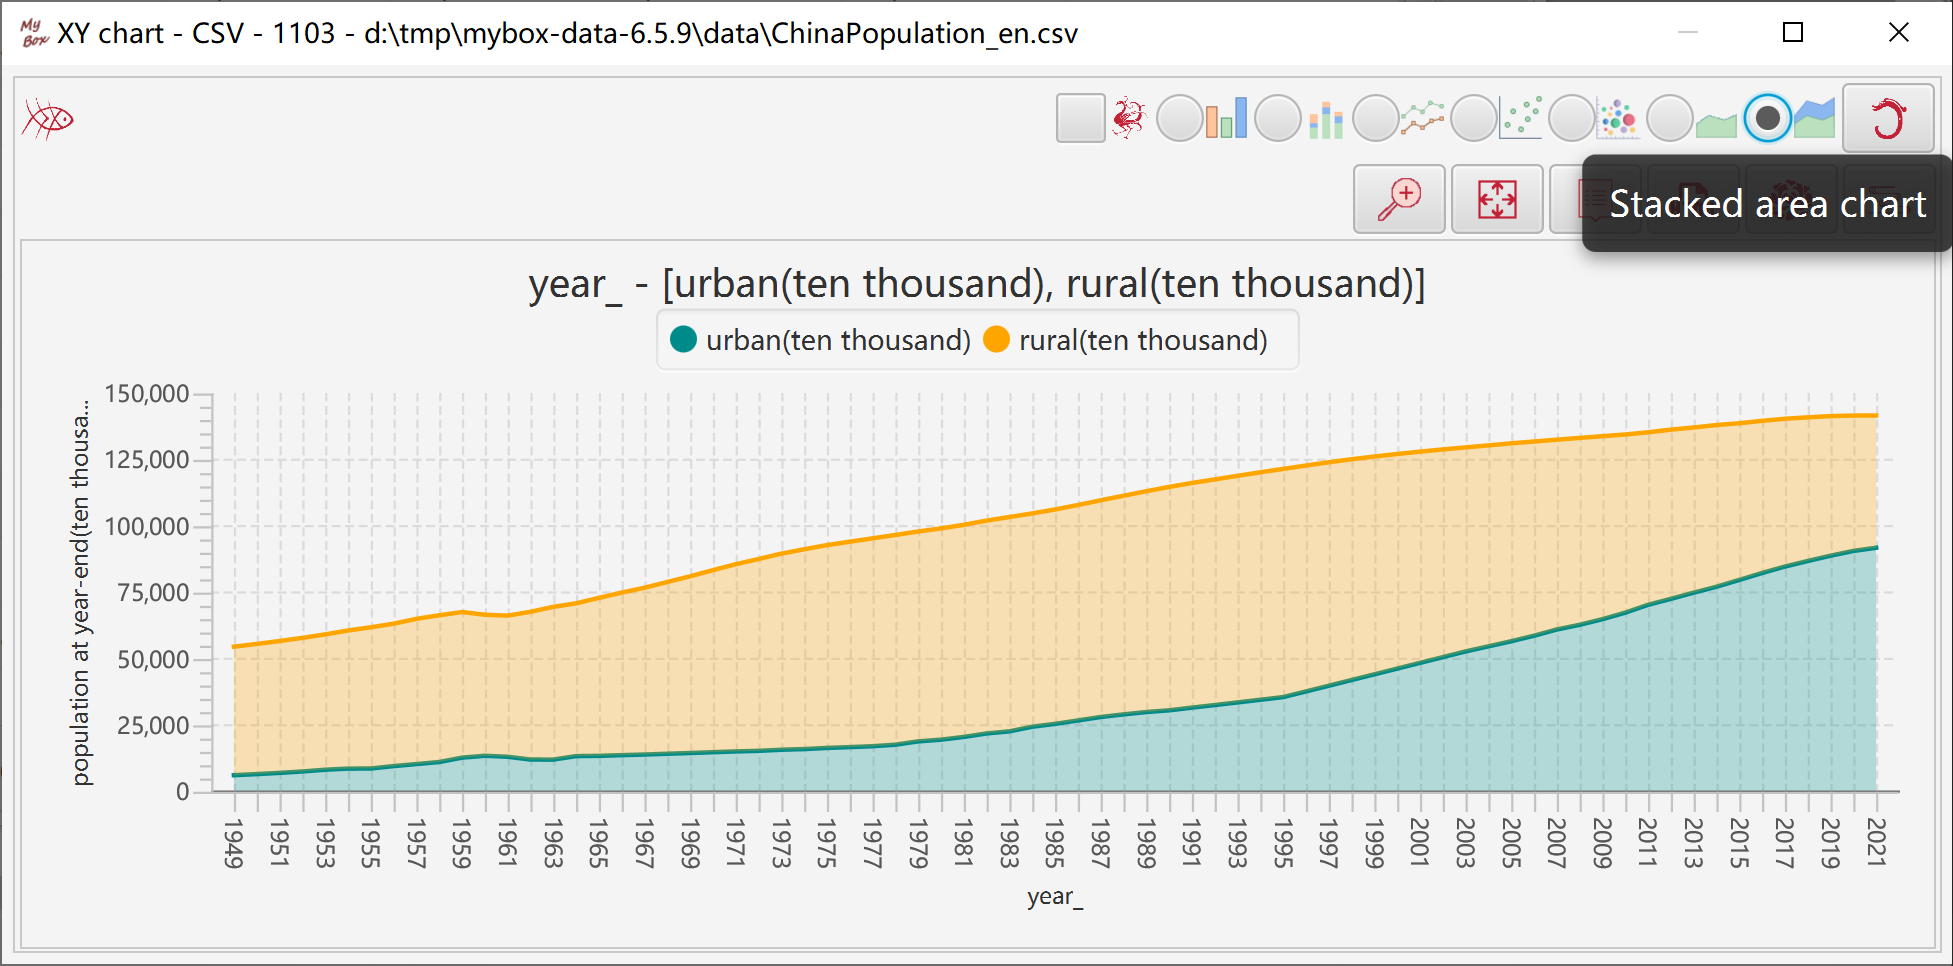
Represents data size with area size.
"Category" column is always counted as strings.
Options about label: not display, point, value, category, etc.
Location of labels.
Font size of labels.
Decimal scale.
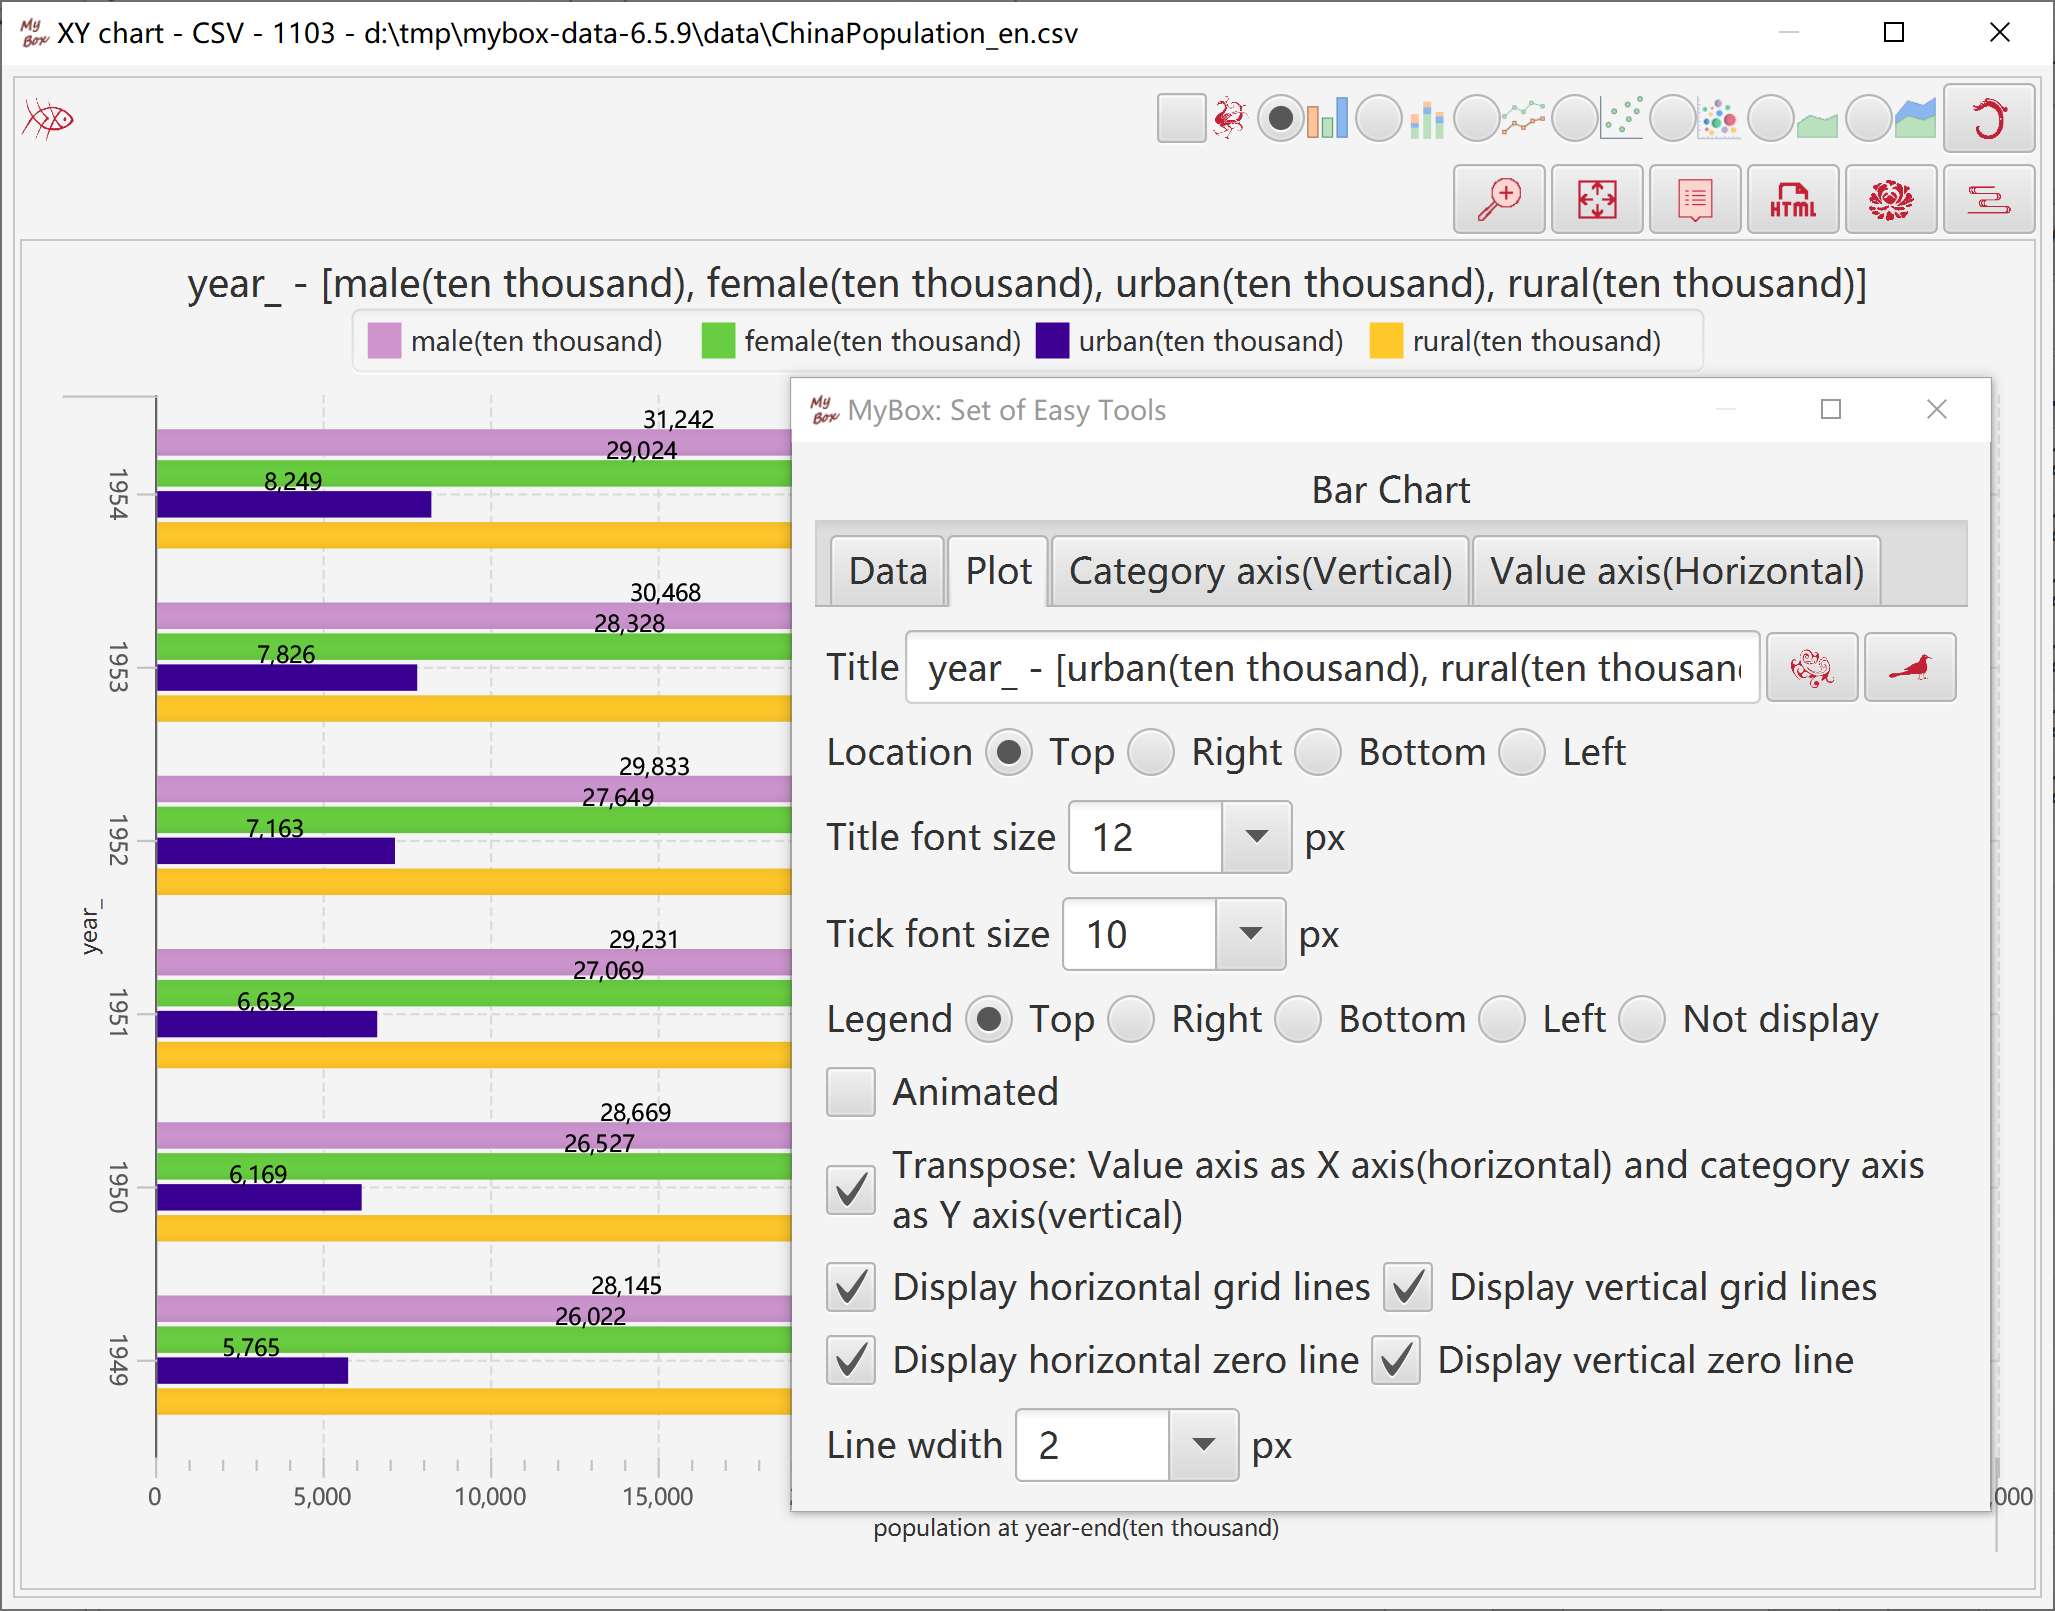
Set parameters of plot: title, font size, location of legend, zero-lines, grid lines, line width, etc.
Set parameters of category axis: label, font size, location, tick, count values as string or number, coordinate, etc.
Set parameters of number axis: label, font, location, tick, coordinate, etc.
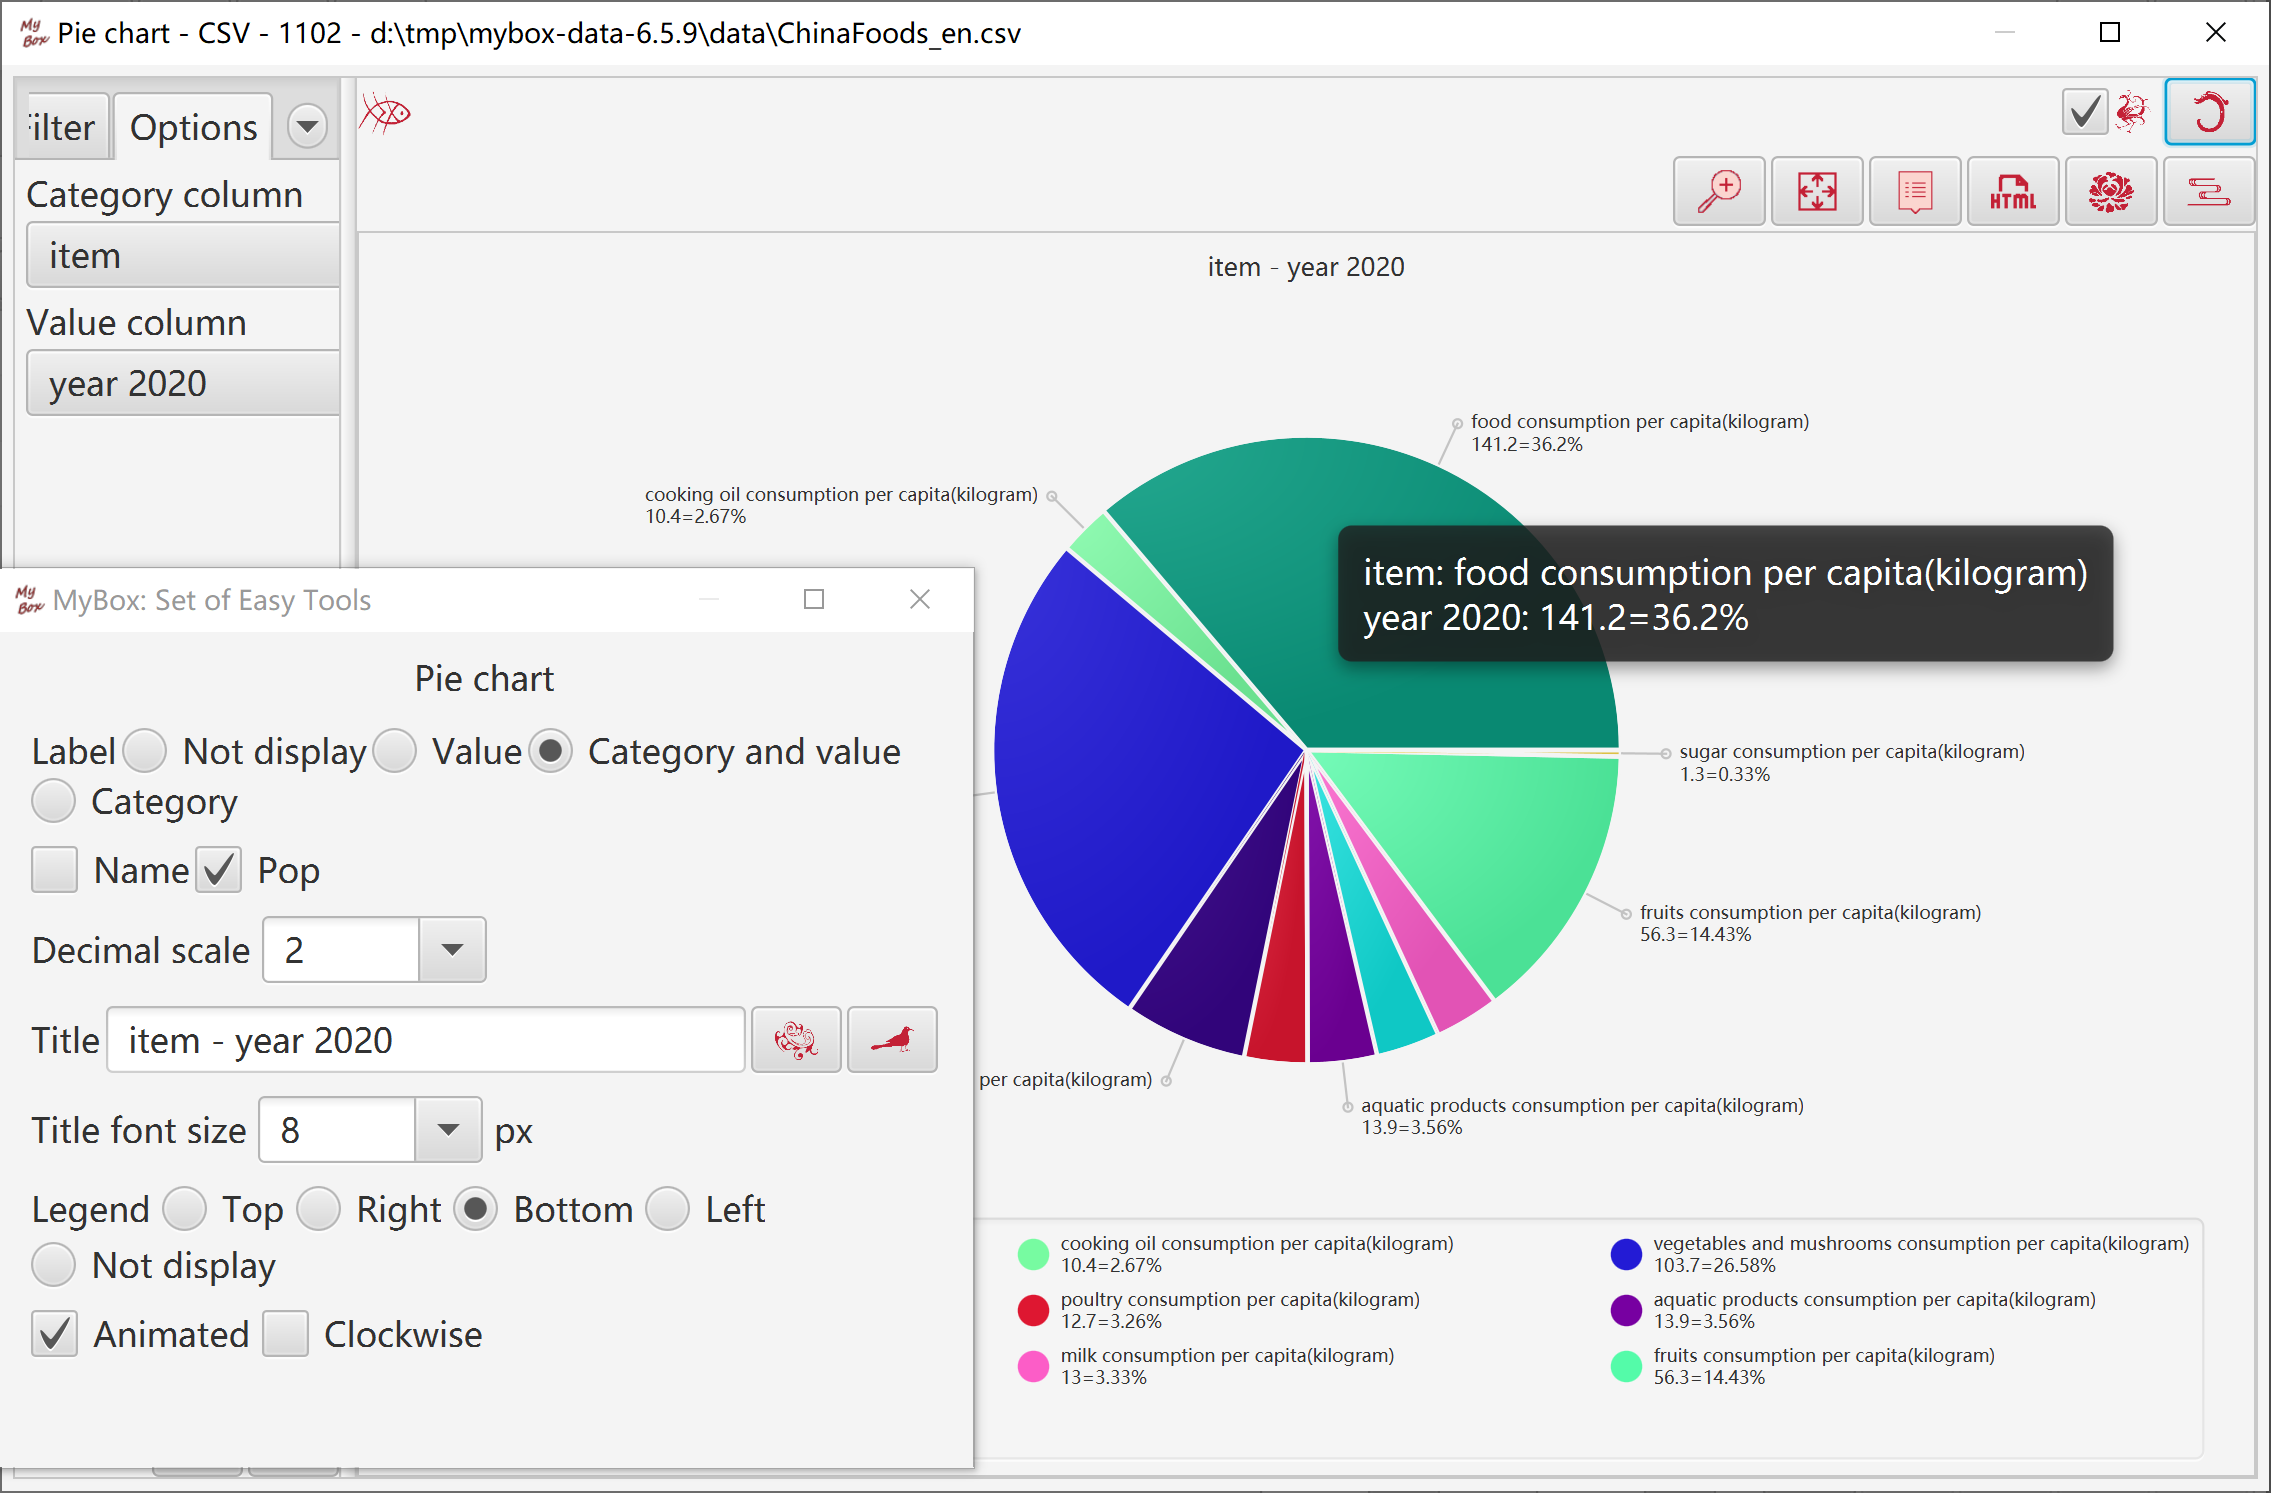
Data numbers are represented as percentages with a circle divided into segments.
Select data rows. Data filter can be set.
Select one column as "Category Axis", to define data names..
Select another column as "Number Axis". Values should be non-negative.
When display all data rows(all pages), need concern memory limitation
Click button “Menu” to set parameters of chart.
Click button “Pop” to display current chart as image in popped window.
Click button “Data” to display data of the chart in data table.
Click button “Html” to display data of the chart in html page.
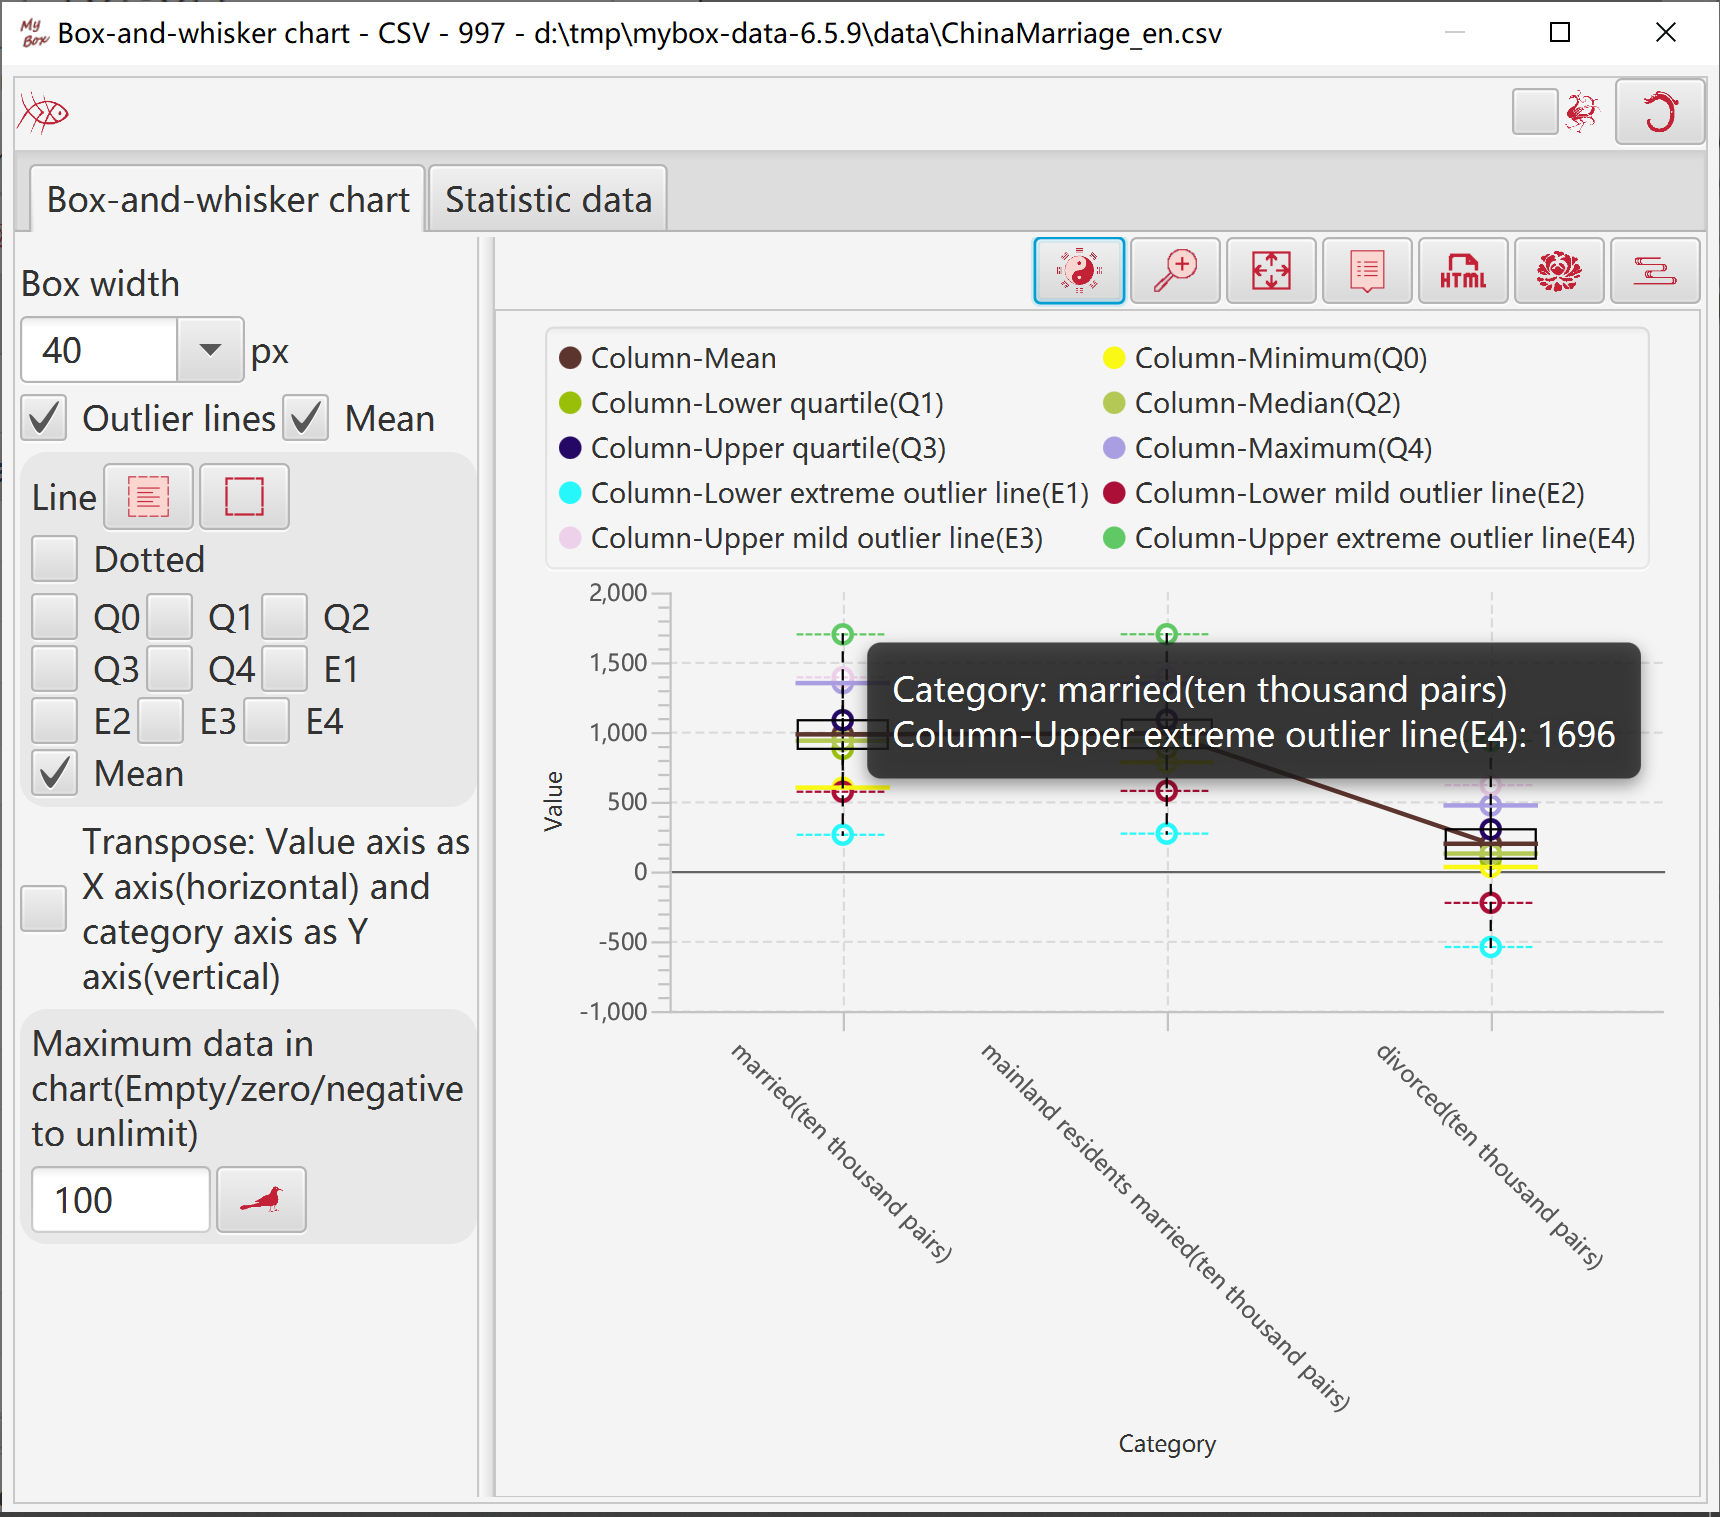
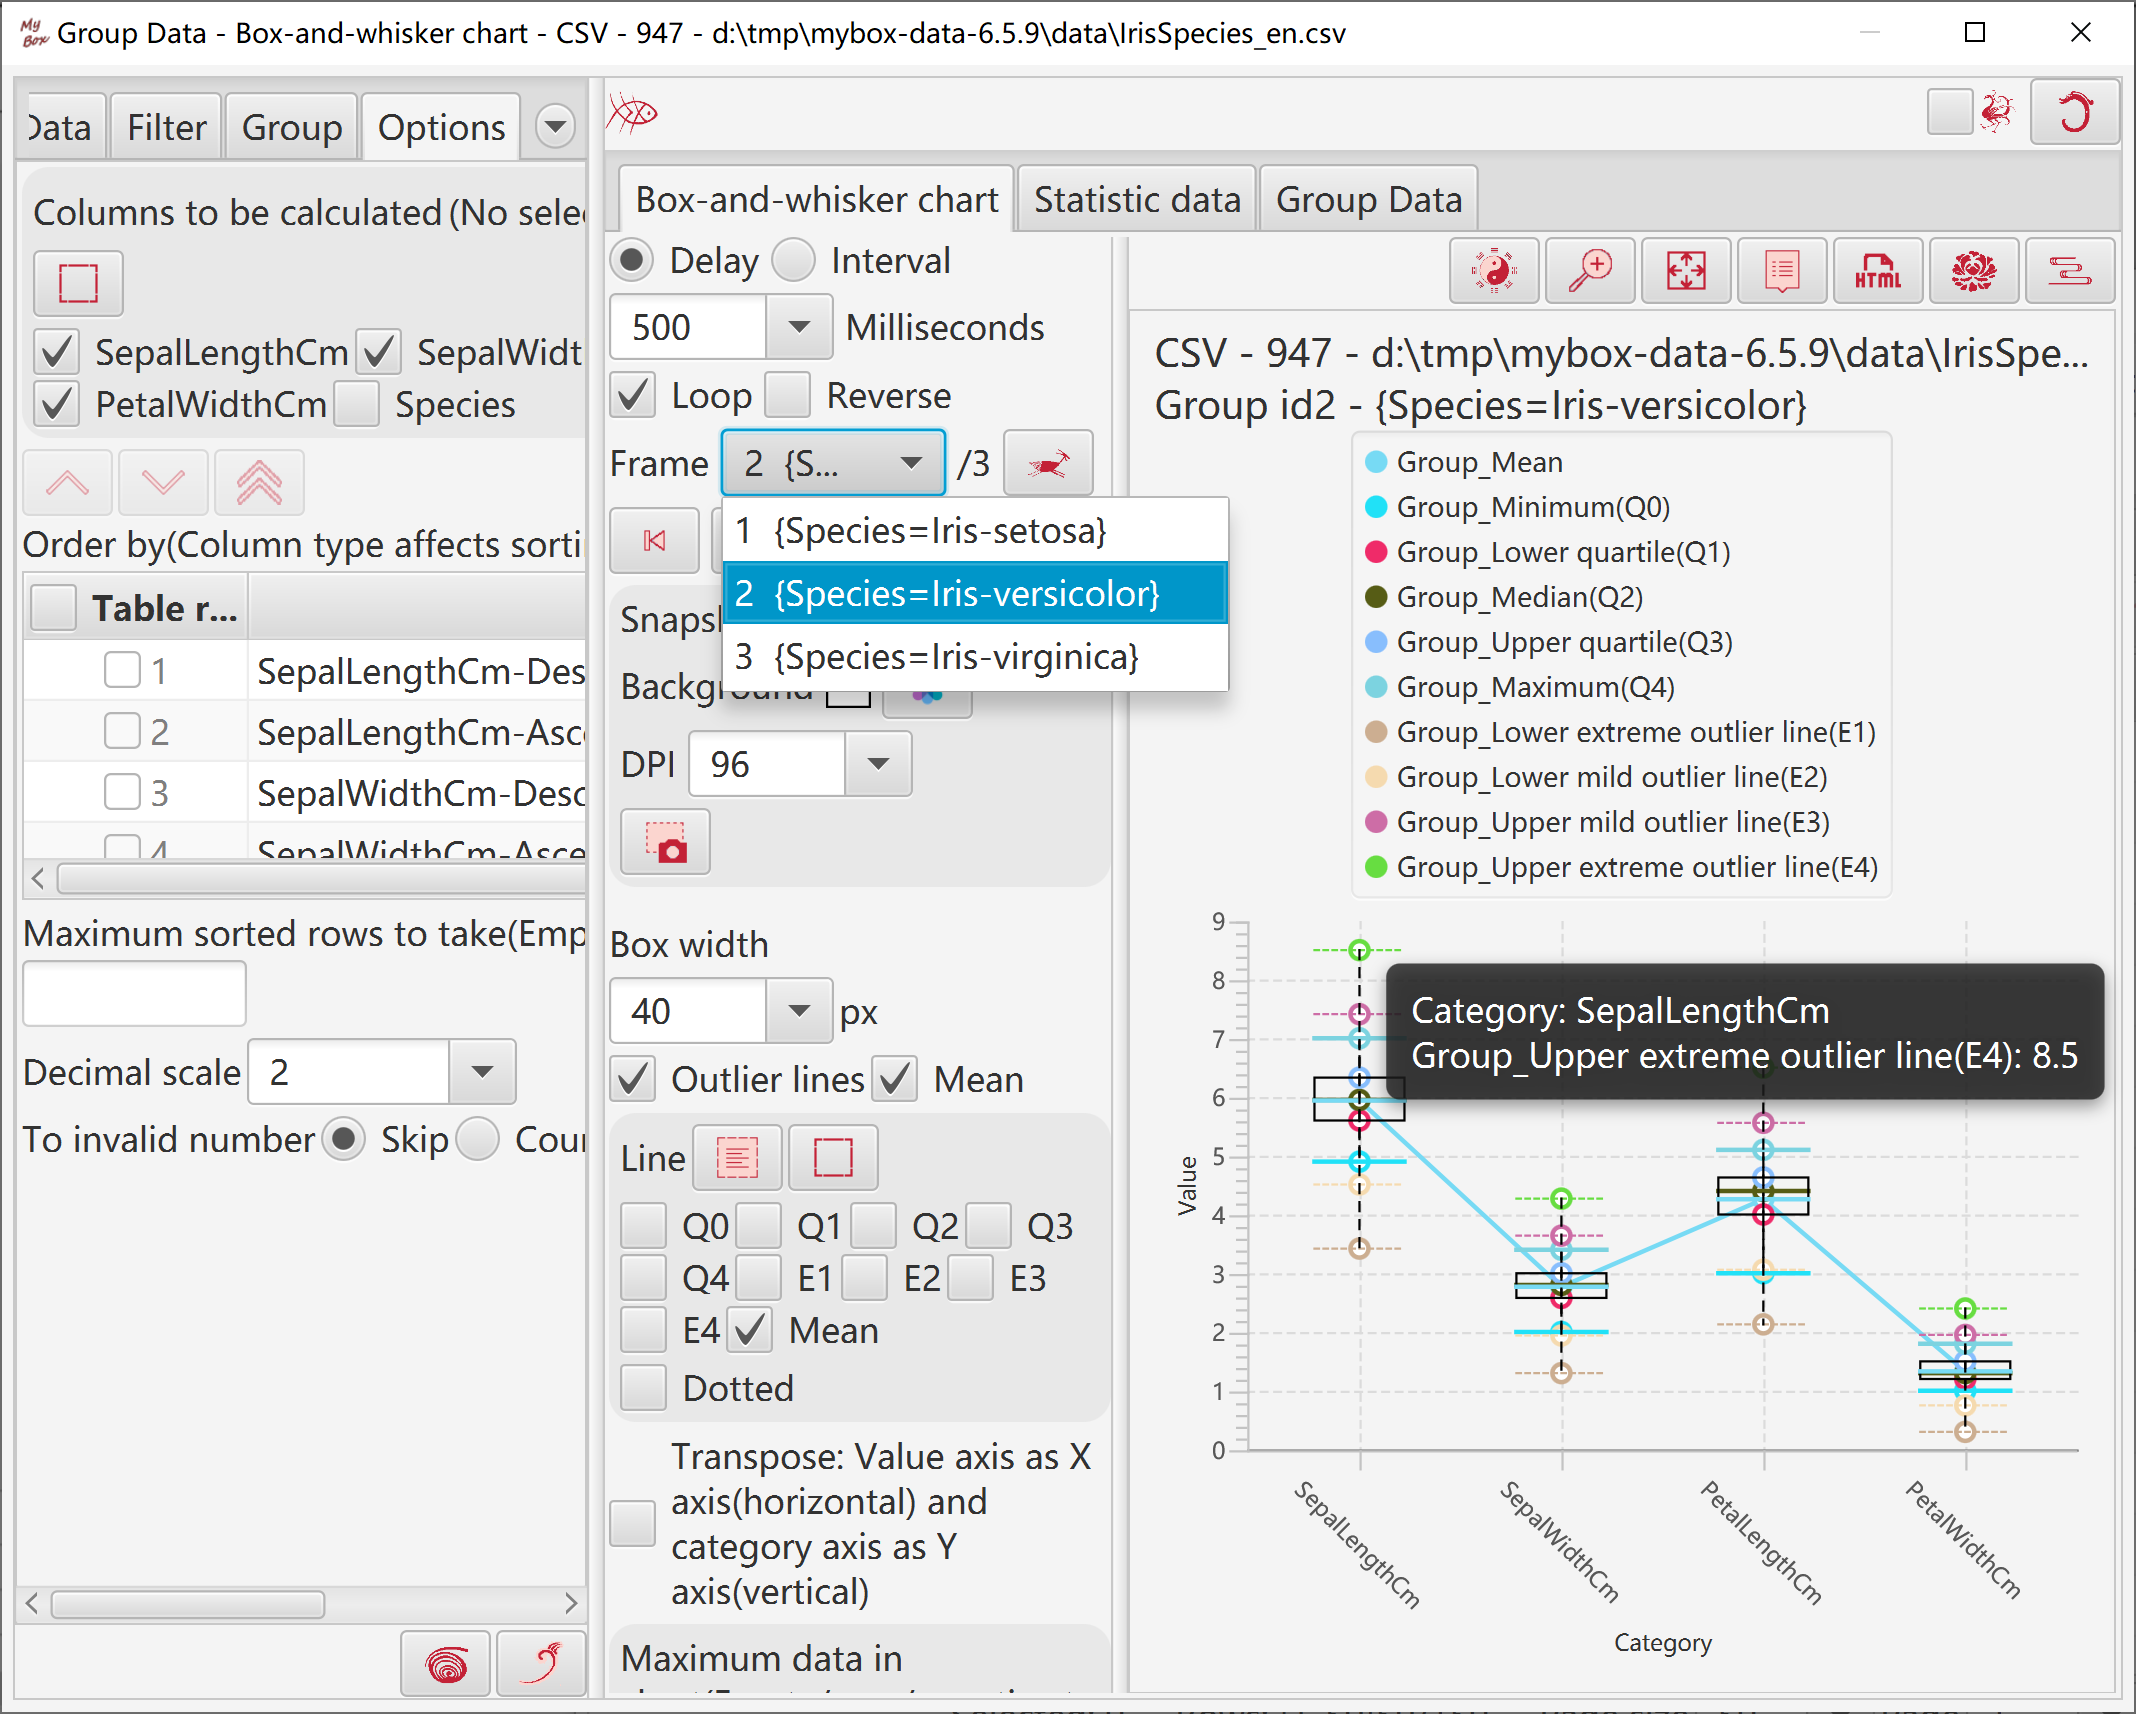
Box-and-whisker chart represents data distribution:
Sort data according to column/row/all in ascending order.
Following items can show aggregation and discreteness of data:
Minimum Q0 = in 0%(start) of the data list
Lower quartile Q1 = in 25% of the data list
Median Q2 = in 50%(middle) of the data list
Upper quartile Q3 = in 75% of the data list
Maximum Q4 = in 100%(end) of the data list
Following values can be used to mark ourliers of data:
Lower extreme outlier line E1 = Q1 - 3 * ( Q3 - Q1 )
Lower mild outlier line E2 = Q1 - 1.5 * ( Q3 - Q1 )
Upper mild outlier line E3 = Q3 + 1.5 * ( Q3 - Q1 )
Upper extreme outlier line E4 = Q3 + 3 * ( Q3 - Q1 )
Following values can be referred for discreteness:
Mean = avarage of the data list
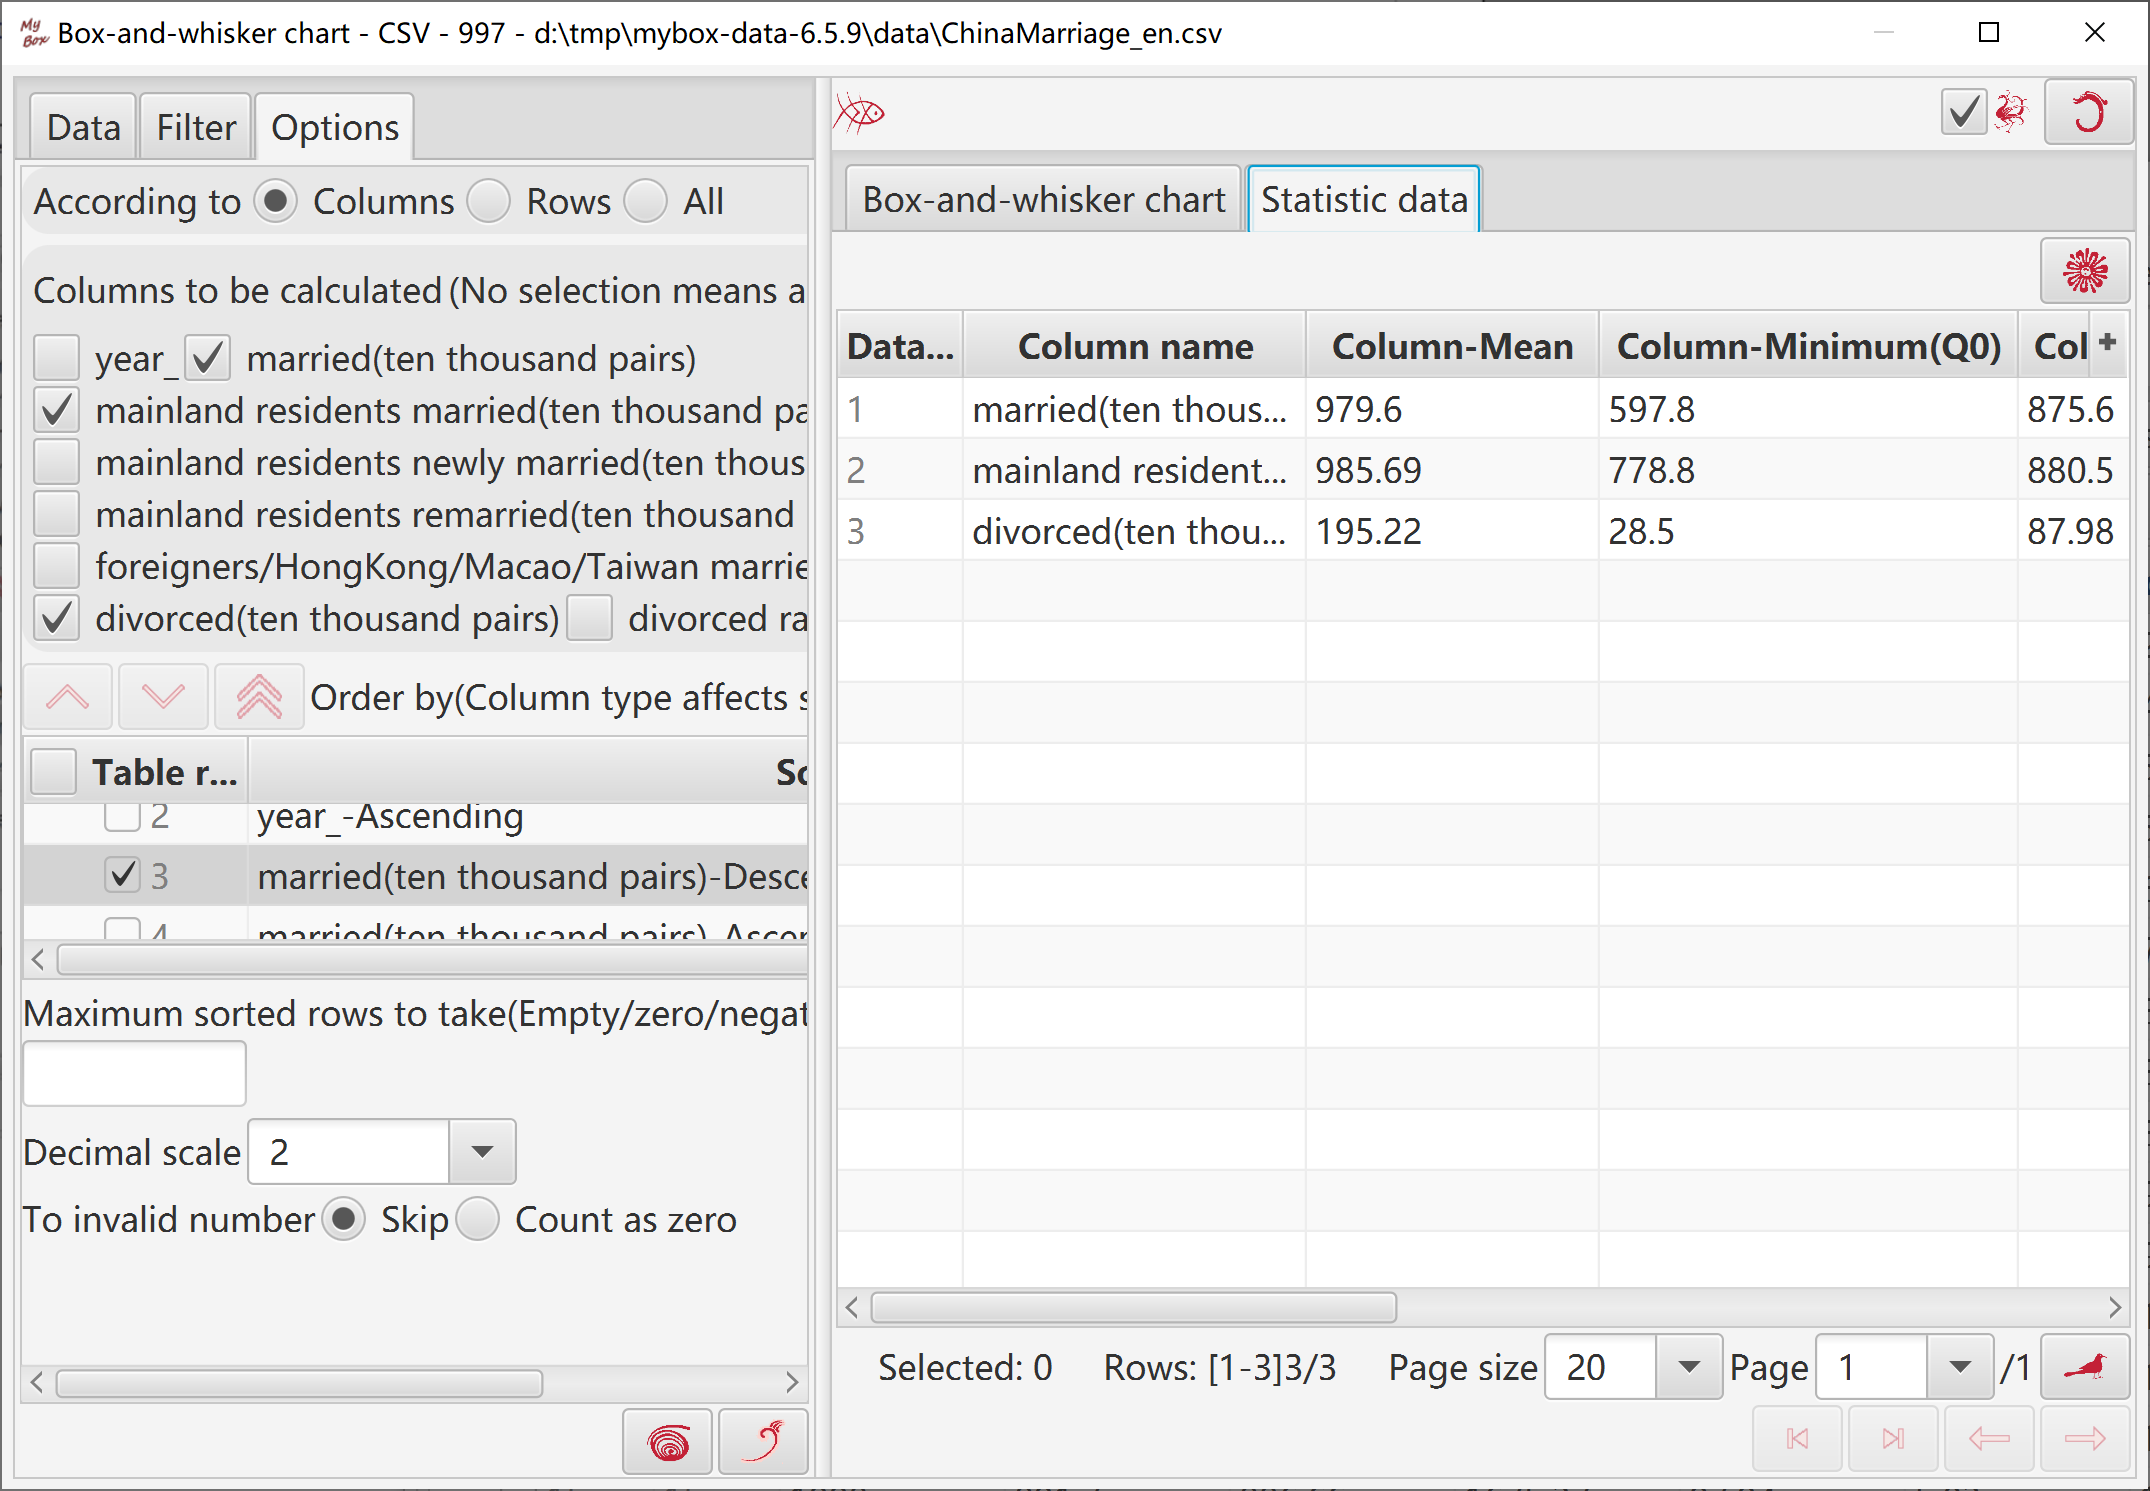
Select data rows. Data filter can be set.
Select objects: According to columns, rows(select category column), or all.
Select columns to be calculated.
Set conditions of sorting, and maximum data number to take.
To invalid values: skip, or count as zero.
Generated statistic data can be viewed and edited.
Box width
Whether display outliers lines or mean
Whether display connection lines of values, and whether dotted lines
Whether transpose
Maximum data number in chart
Random colors
Click button “Menu” to set parameters of chart.
Click button “Pop” to display current chart as image in popped window.
Click button “Data” to display data of the chart in data table.
Click button “Html” to display data of the chart in html page.
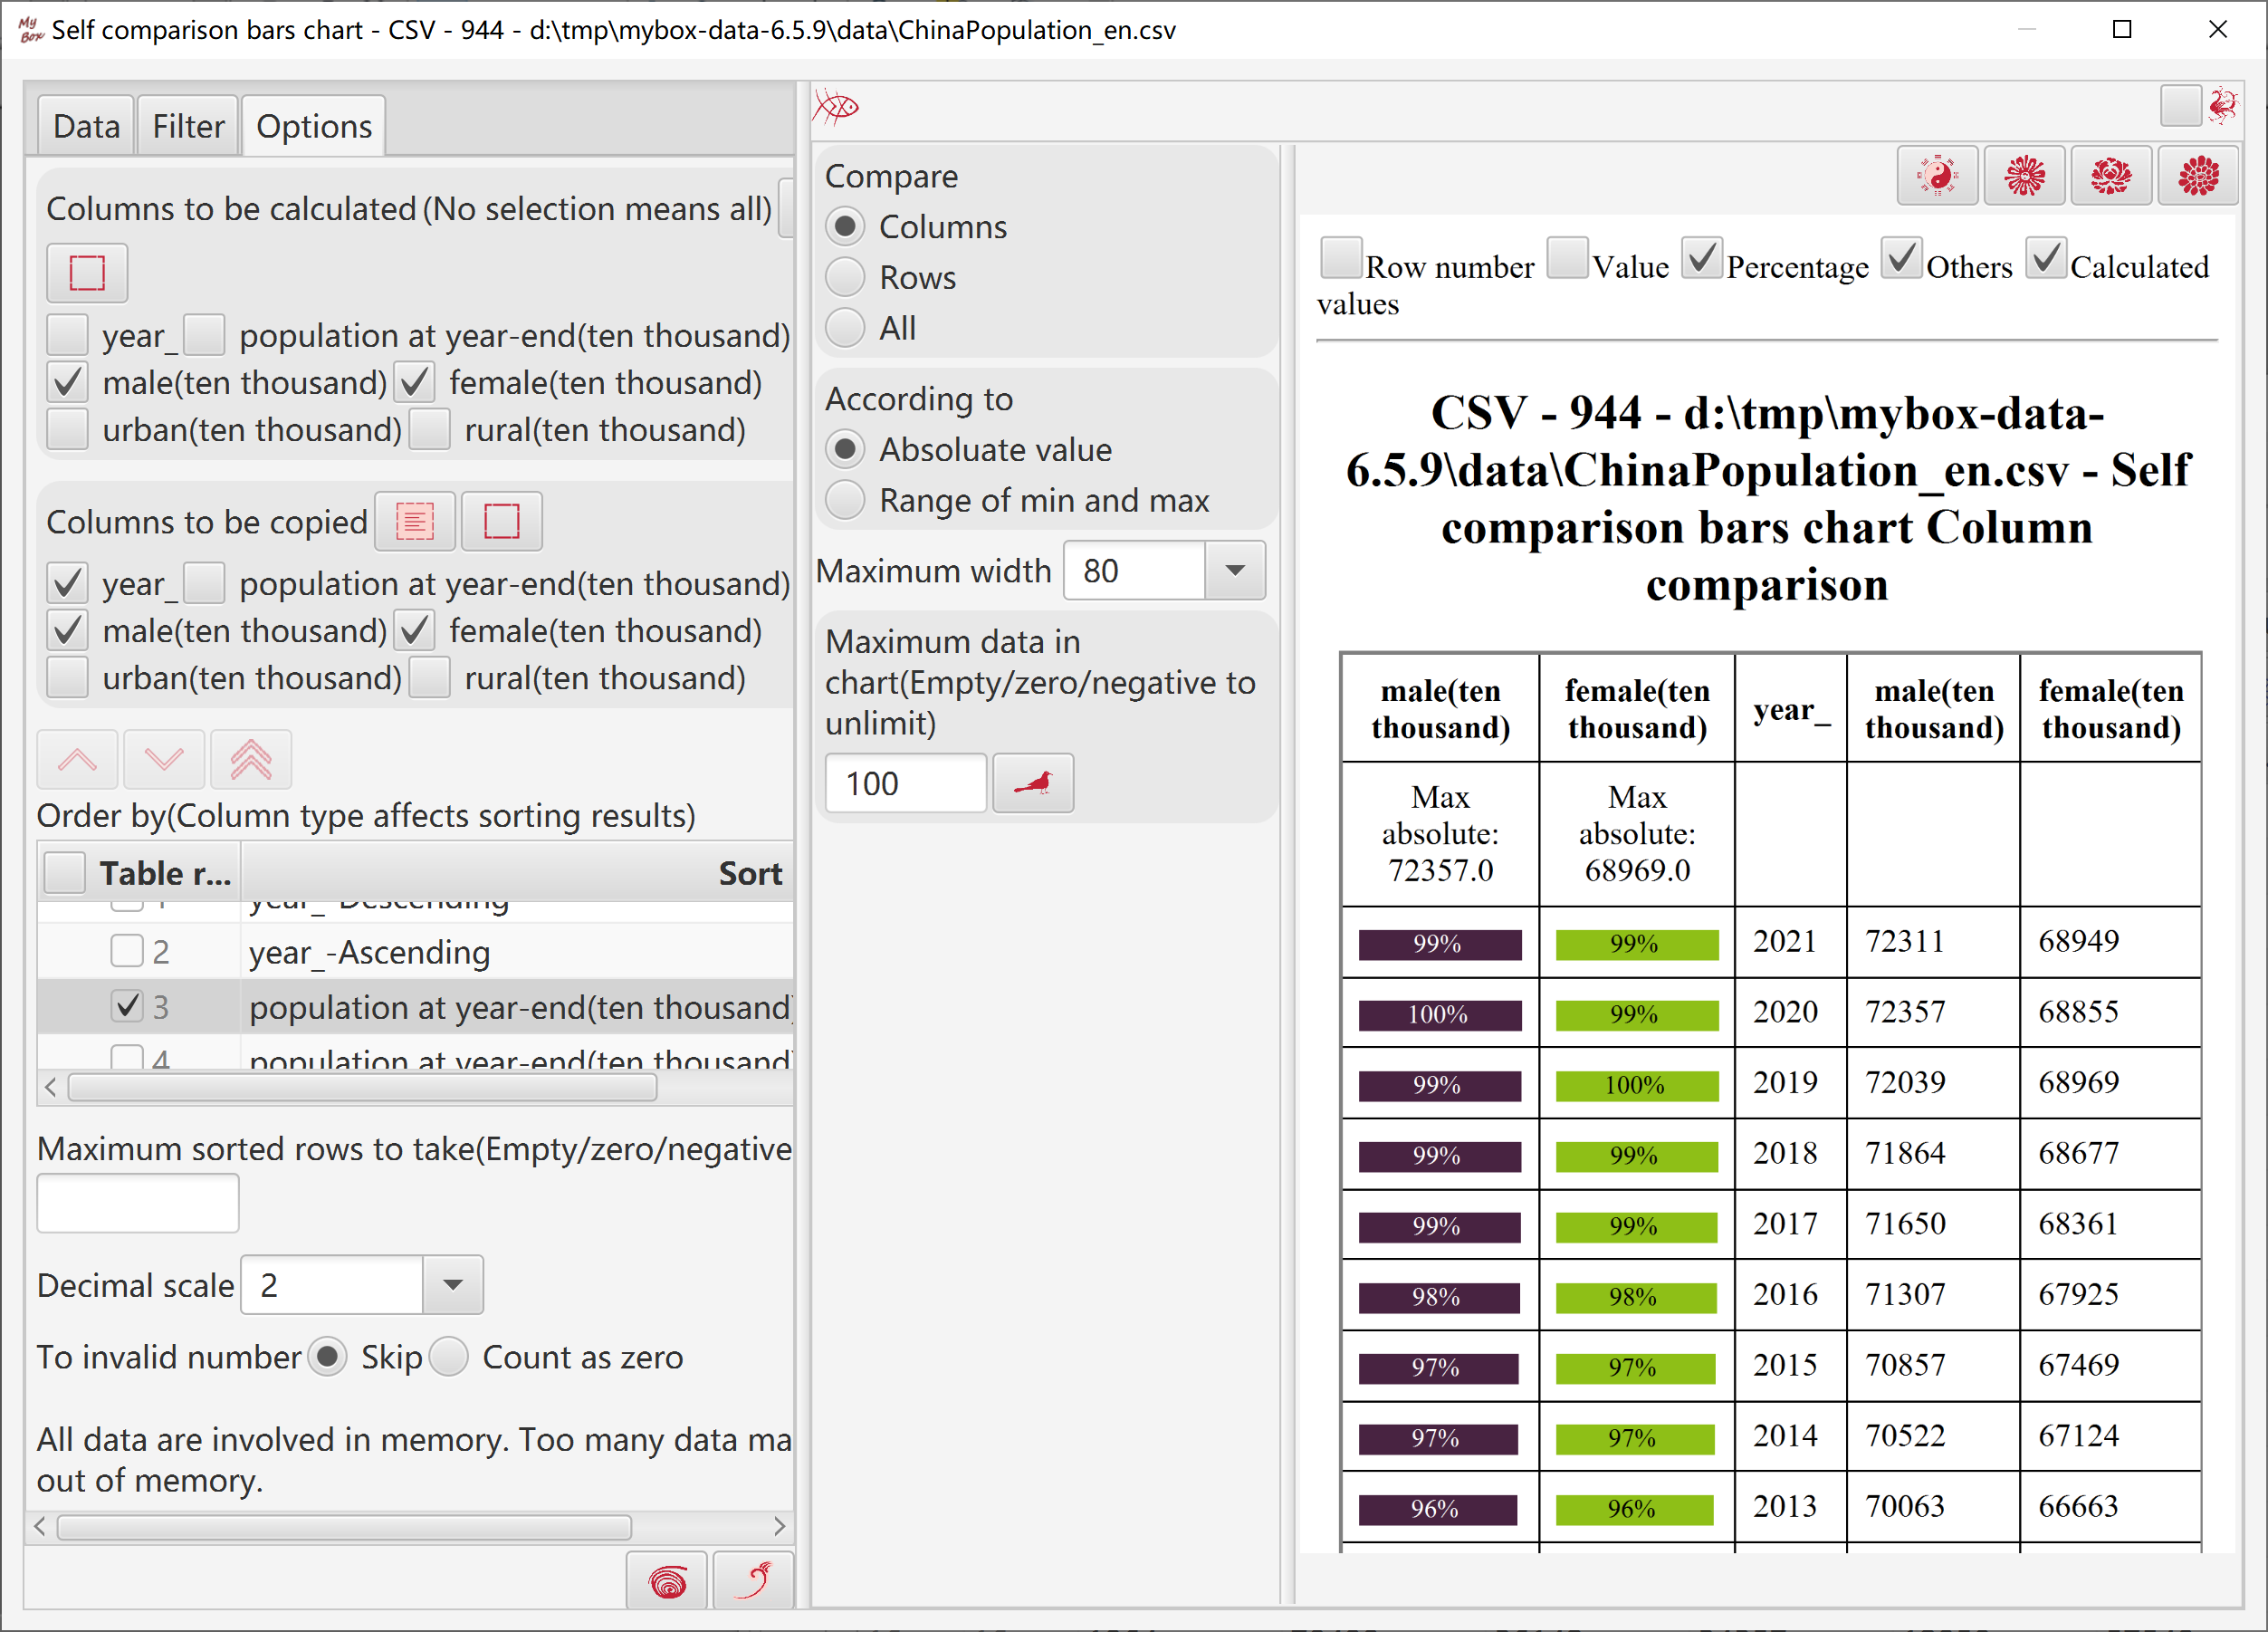
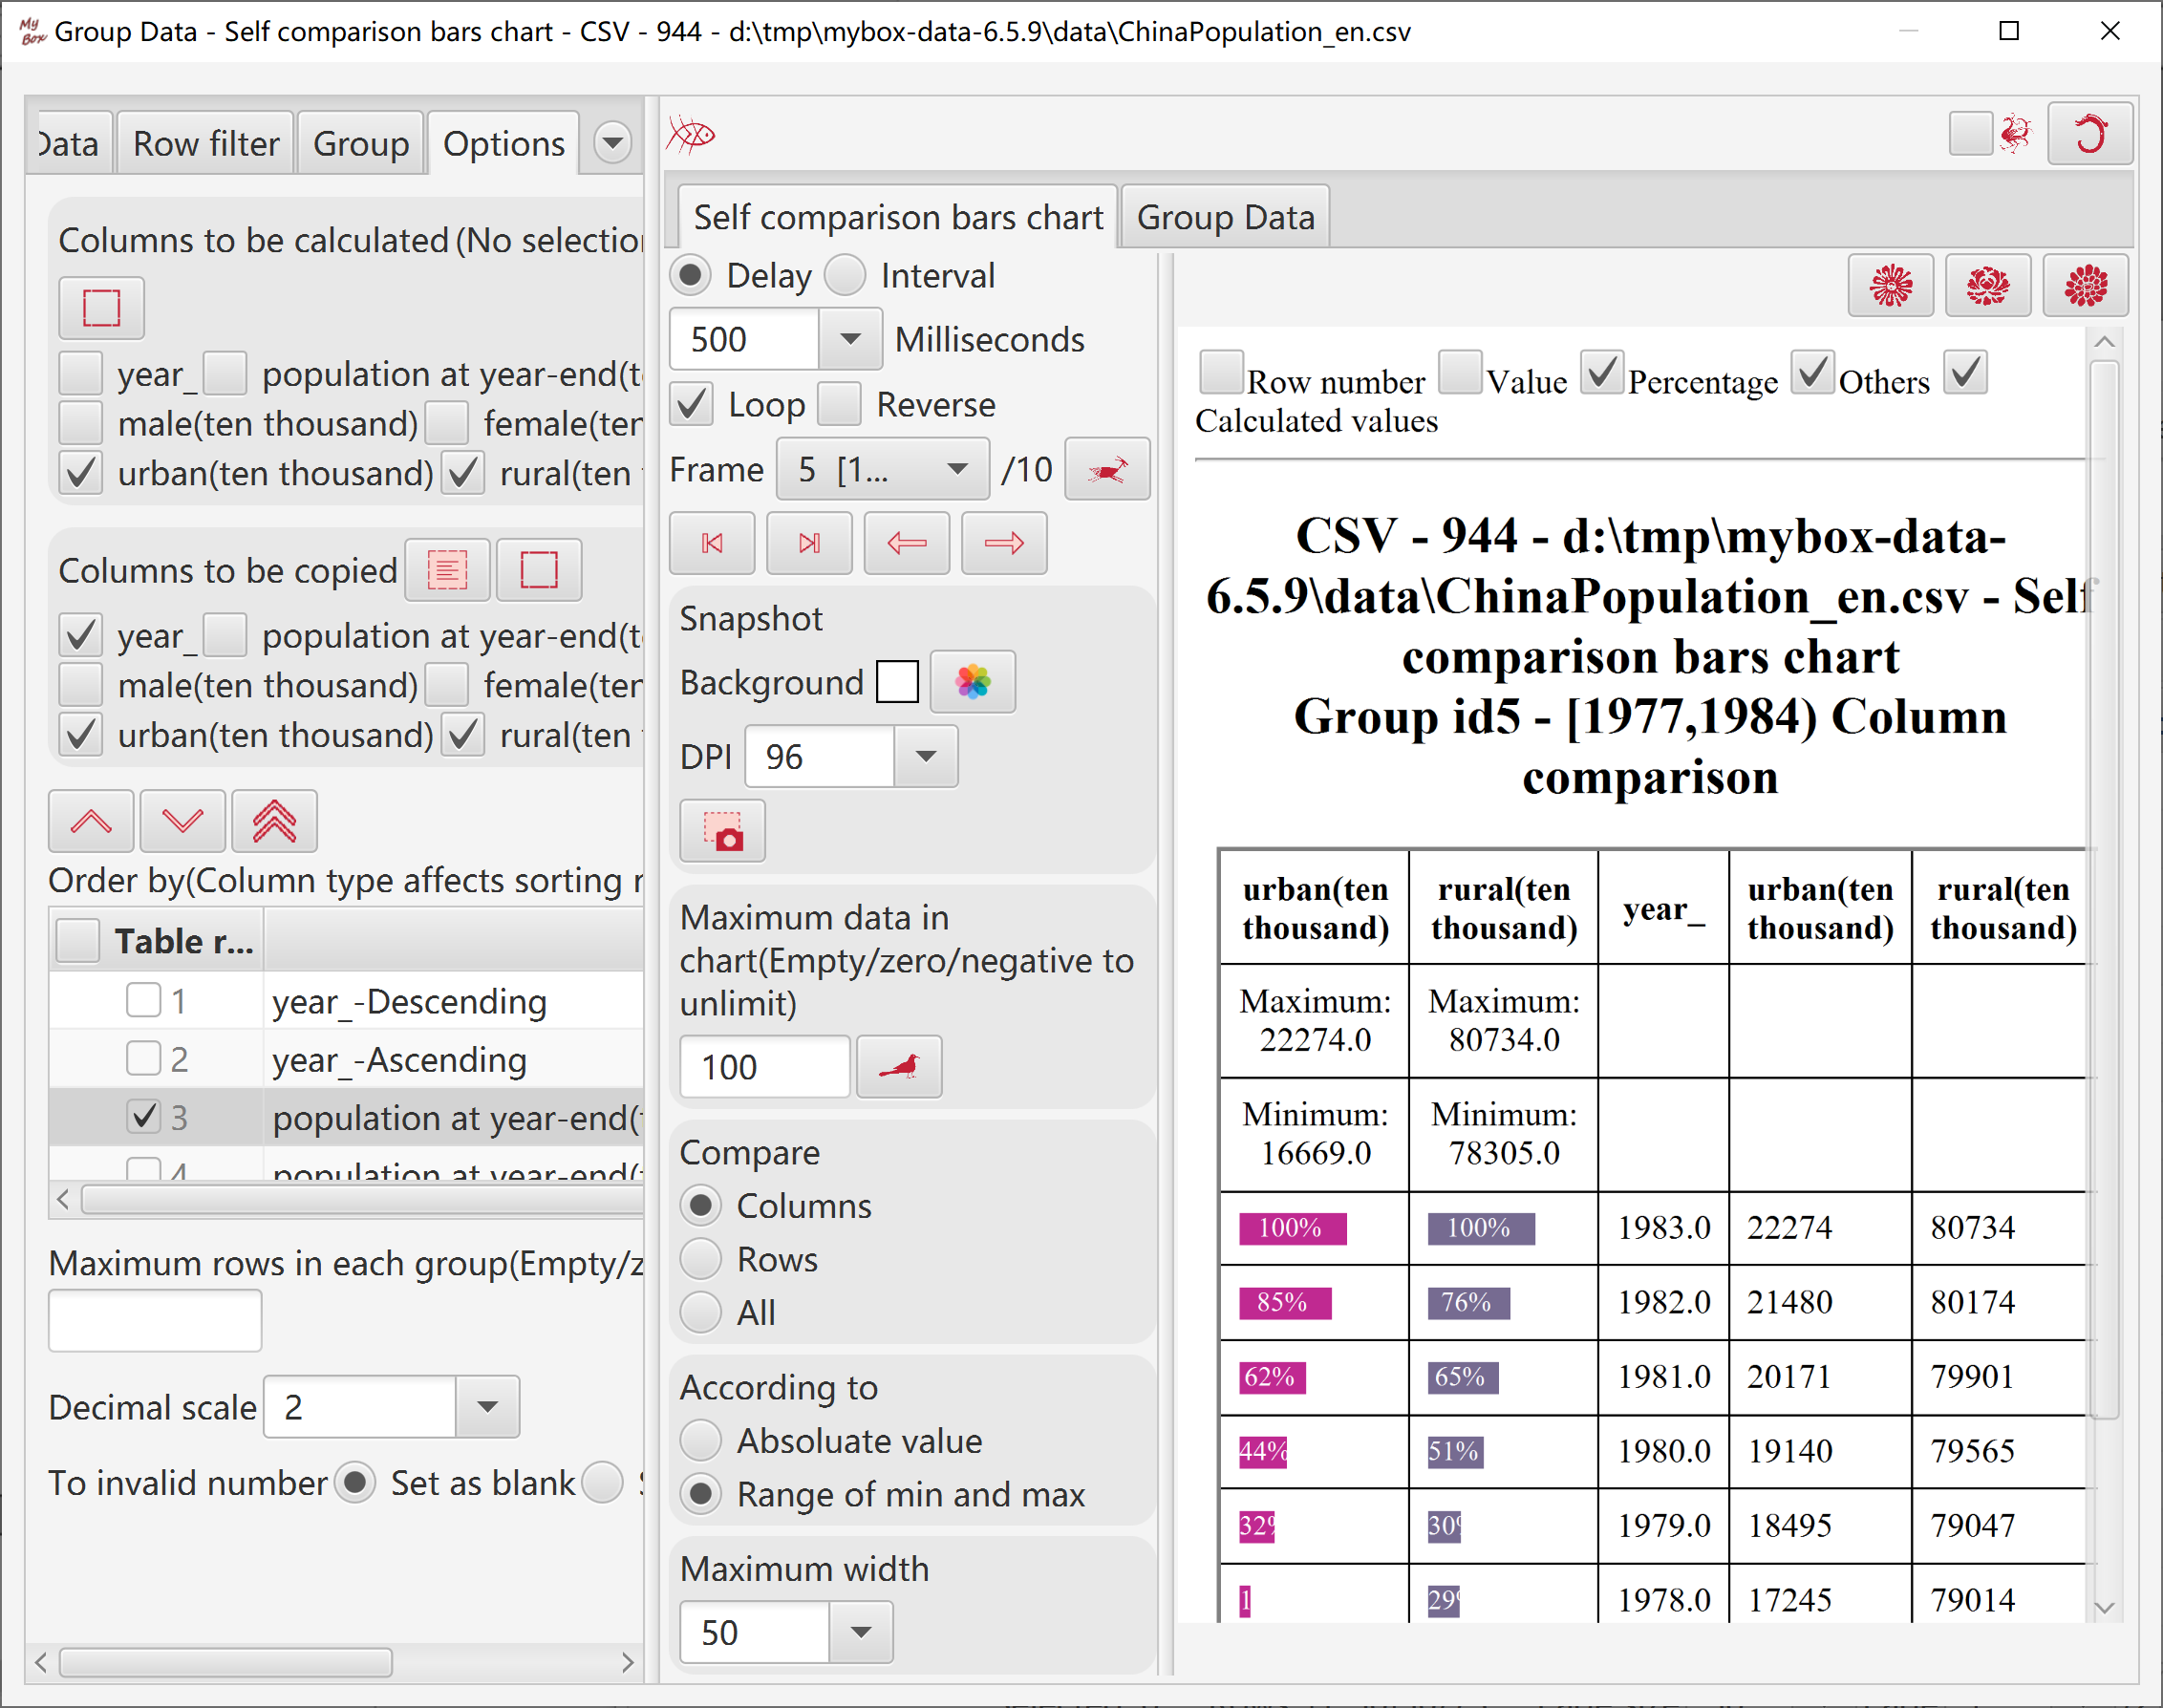
Self comparison bars show difference between data and reference values. Bars are calculated by following rulers:
If value is zero, no bar
When compare as absoluate values:
maximum_value = maximum_absolute_value_of_column/row/all
precentage = absolute_value / maximum_value
width = maximum_width * precentage
color = If value is larger than zero, color_of_column.
If value is less than zero, inverted_color_of_column
When compare as range of minimum and maximum:
maximum_value = maximum_value_of_column/row/all
minimum_value = minimum_value_of_column/row/all
precentage = (value - minimum_value) / (maximum_value - minimum_value)
width = maximum_width * precentage
color = color_of_column
Select data rows. Data filter can be set.
Select columns to be calculated.
Select columns to be copied.
Set conditions of sorting, and maximum data number to take.
Select how to handle invalid data.
Set decimal scale.
When display all data rows(all pages), need concern memory limitation.
Select objects to compare: columns/rows/all.
Select comparison way: absoluate values, or range of minimum and maximum.
Set maximum width of bars.
Set maximum data number in chart.
Select whether display row numbers, values, percentages, categories, calculated values.
Edit data in chart.
Edit html of chart.
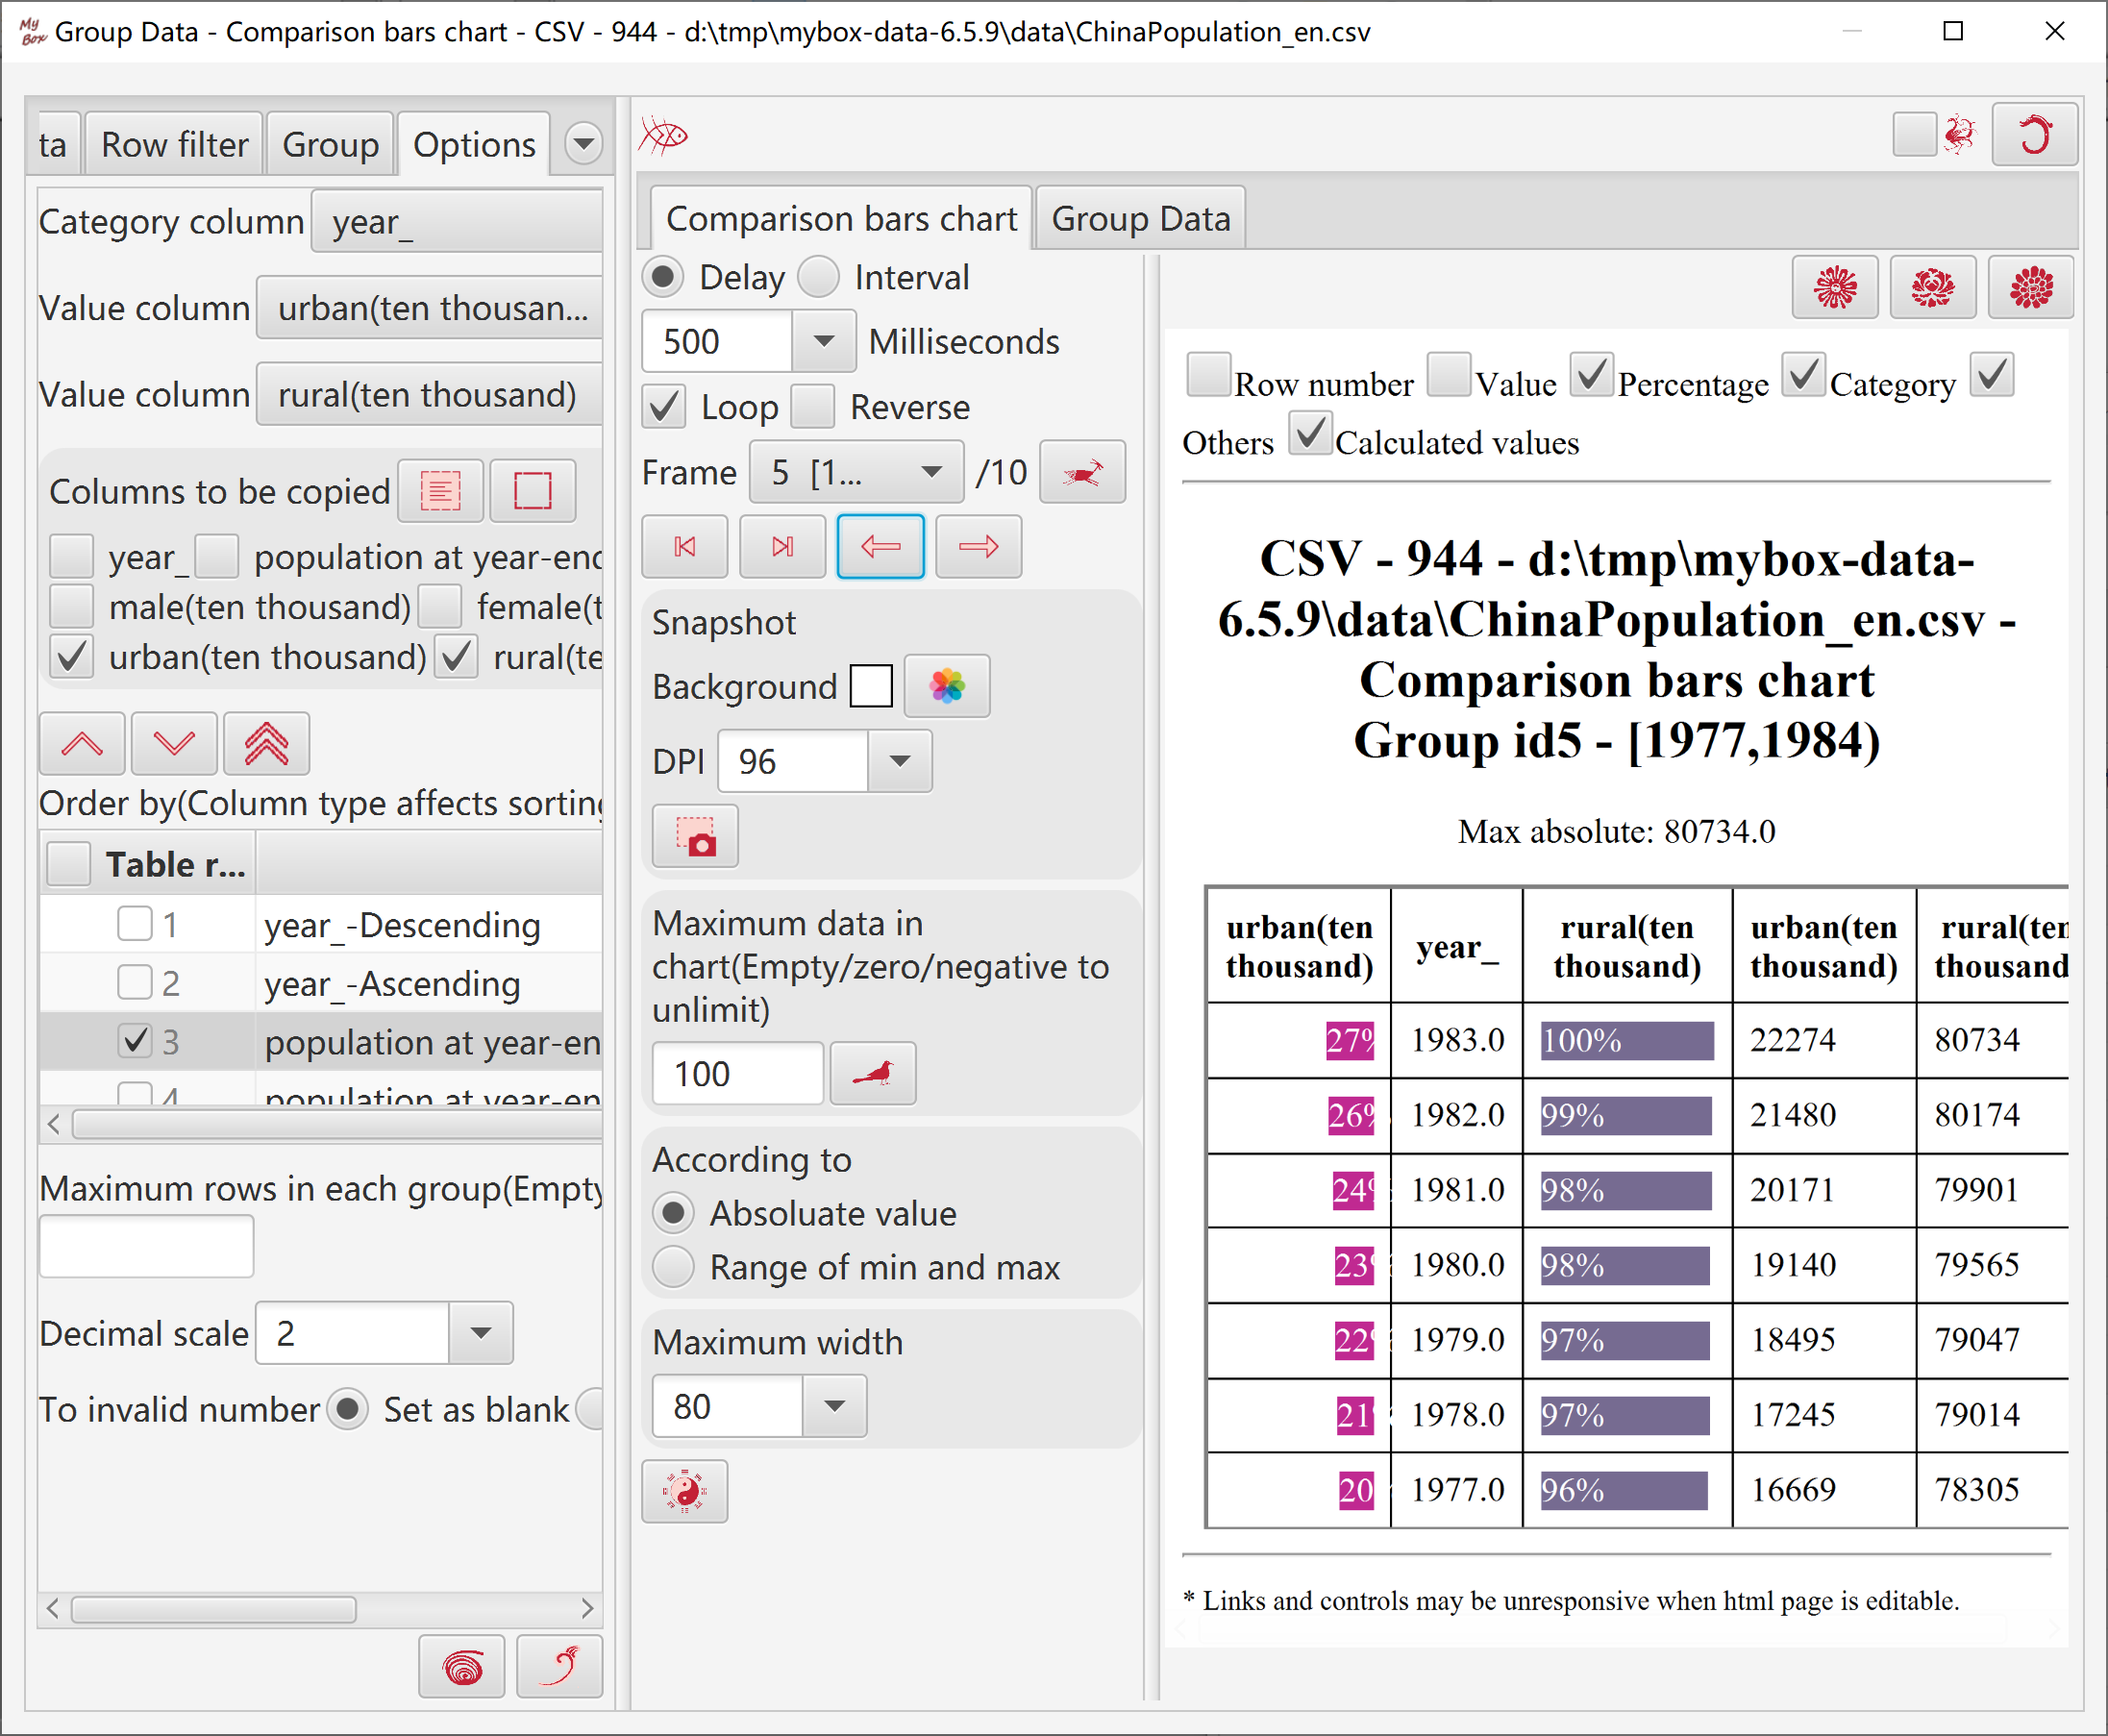
Comparison bars show difference between two series of data. Bars are calculated by following rulers:
If value is zero, no bar
When compare as absoluate values:
maximum_value = maximum_absolute_value_of_value_columns
precentage = absolute_value / maximum_value
width = maximum_width * precentage
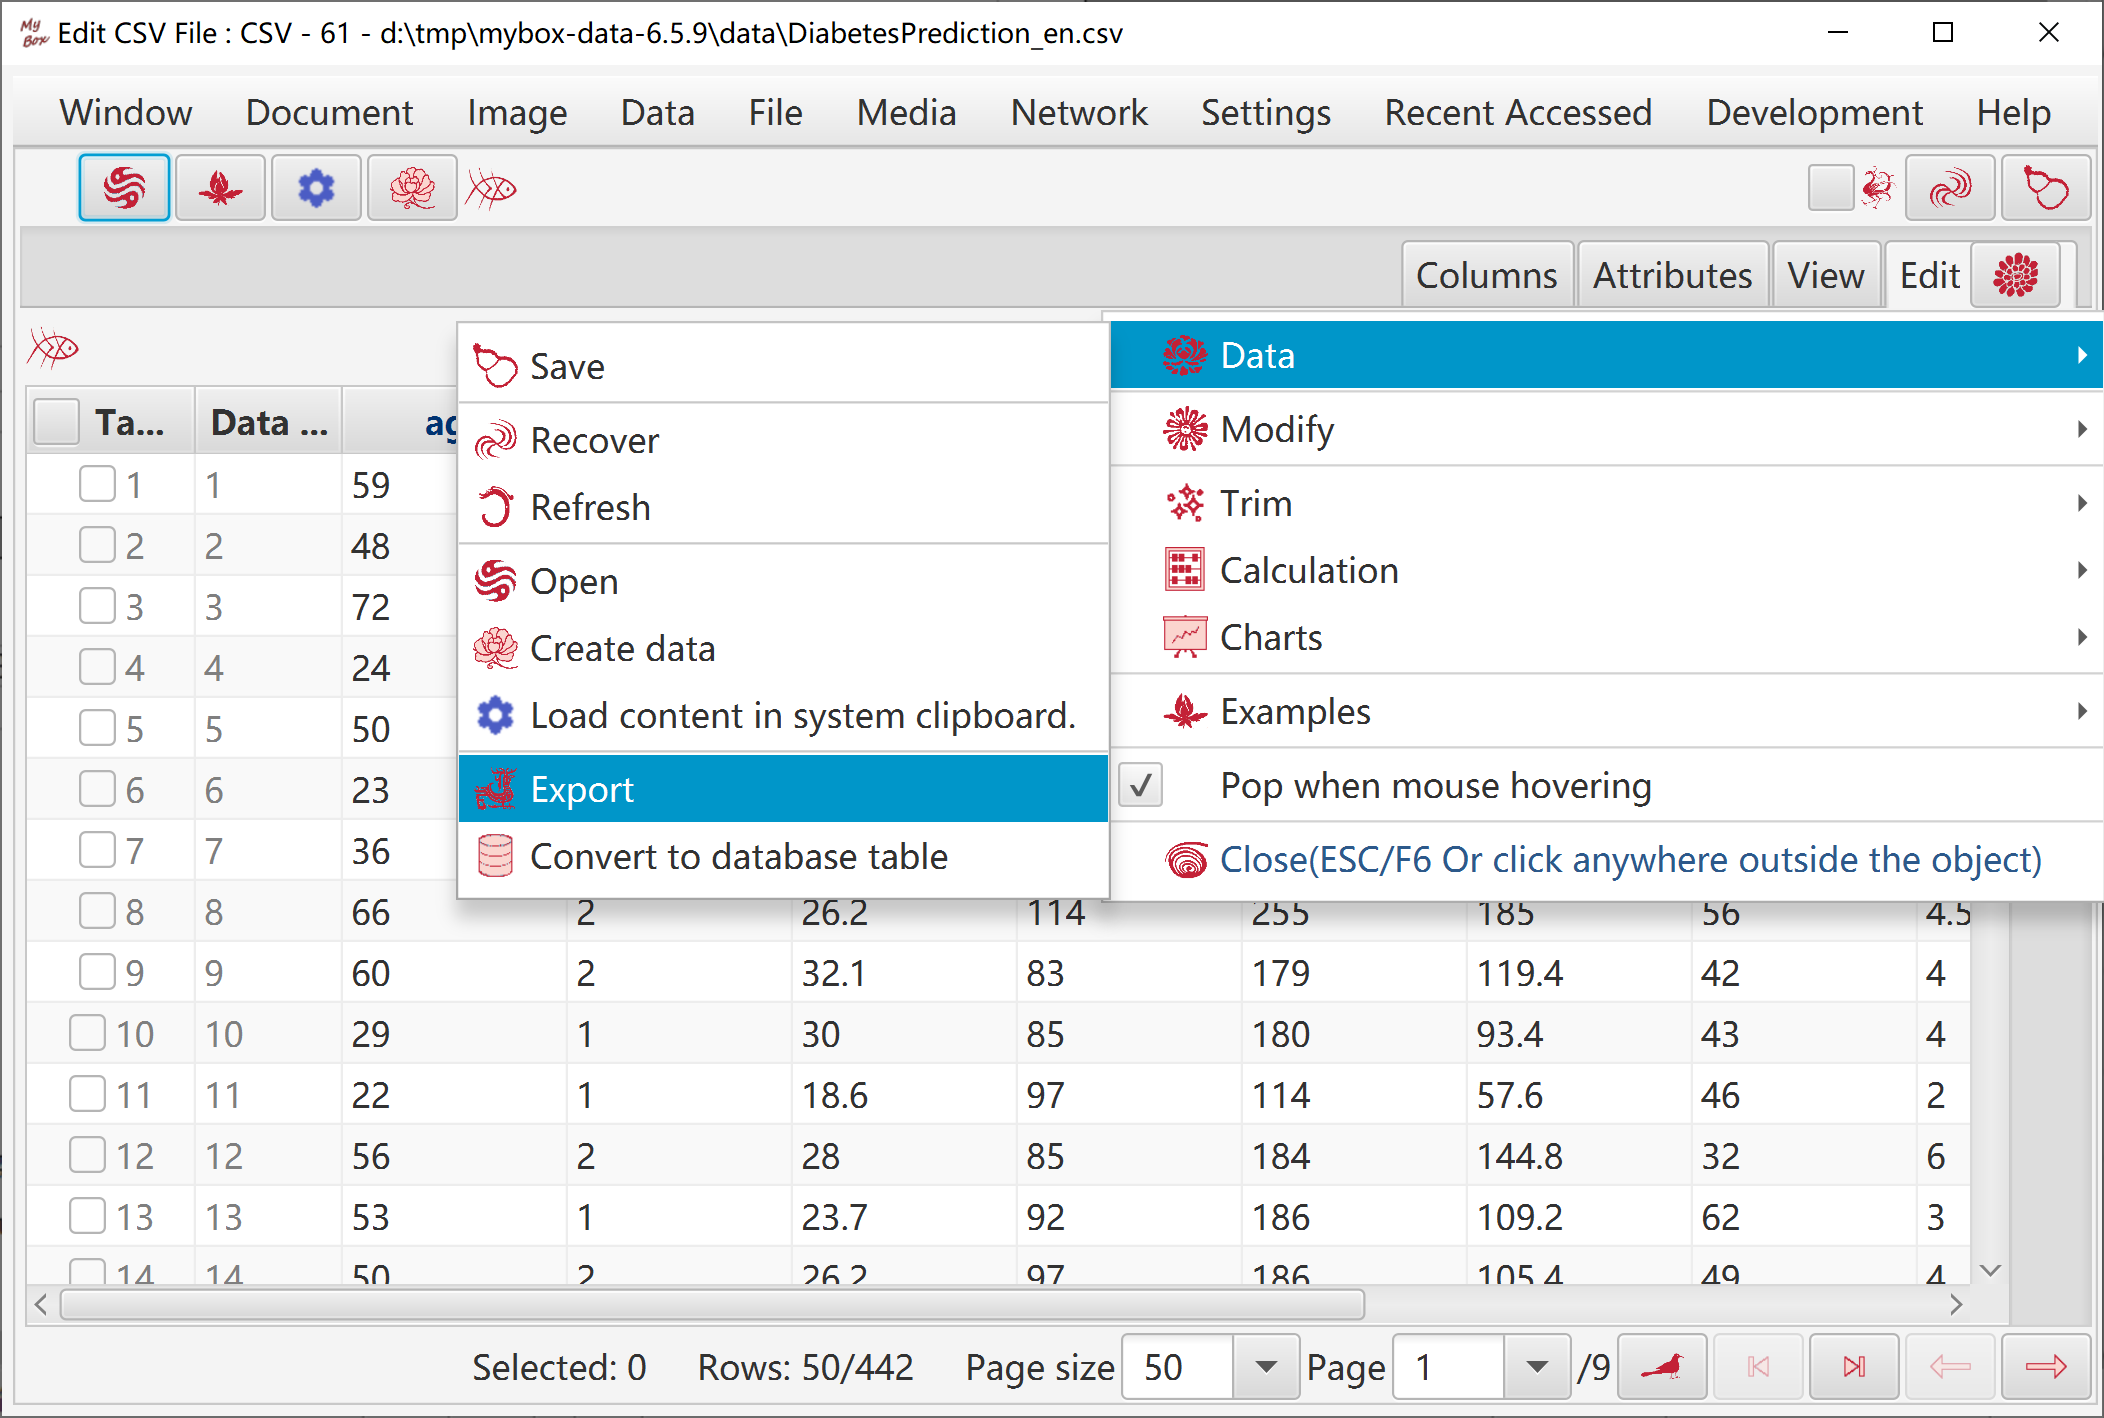
color = If value is larger than zero, color_of_column.
If value is less than zero, inverted_color_of_column
When compare as range of minimum and maximum:
maximum_value = maximum_value_of_value_columns
minimum_value = minimum_value_of_value_columns
precentage = (value - minimum_value) / (maximum_value - minimum_value)
width = maximum_width * precentage
color = color_of_column
Select data rows. Data filter can be set.
Select one column as category column(unnecessary).
Select two columns to be compared.
Select columns to be copied.
Set conditions of sorting, and maximum data number to take.
Set decimal scale.
When display all data rows(all pages), need concern memory limitation.
Select comparison way: absoluate values, or range of minimum and maximum.
Set maximum width of bars.
Set maximum data number in chart.
Select whether display row numbers, values, percentages, categories, calculated values.
Edit data in chart.
Edit html of chart.

Base on echarts-gl, 3D charts can be displayed in html with technic of WebGL.
Webview of JavaFX does not support WebGL, so generated html will be displayed by system web browser.
Pleas make sure your system web browser supports WebGL and does not limit local JavaScript files.
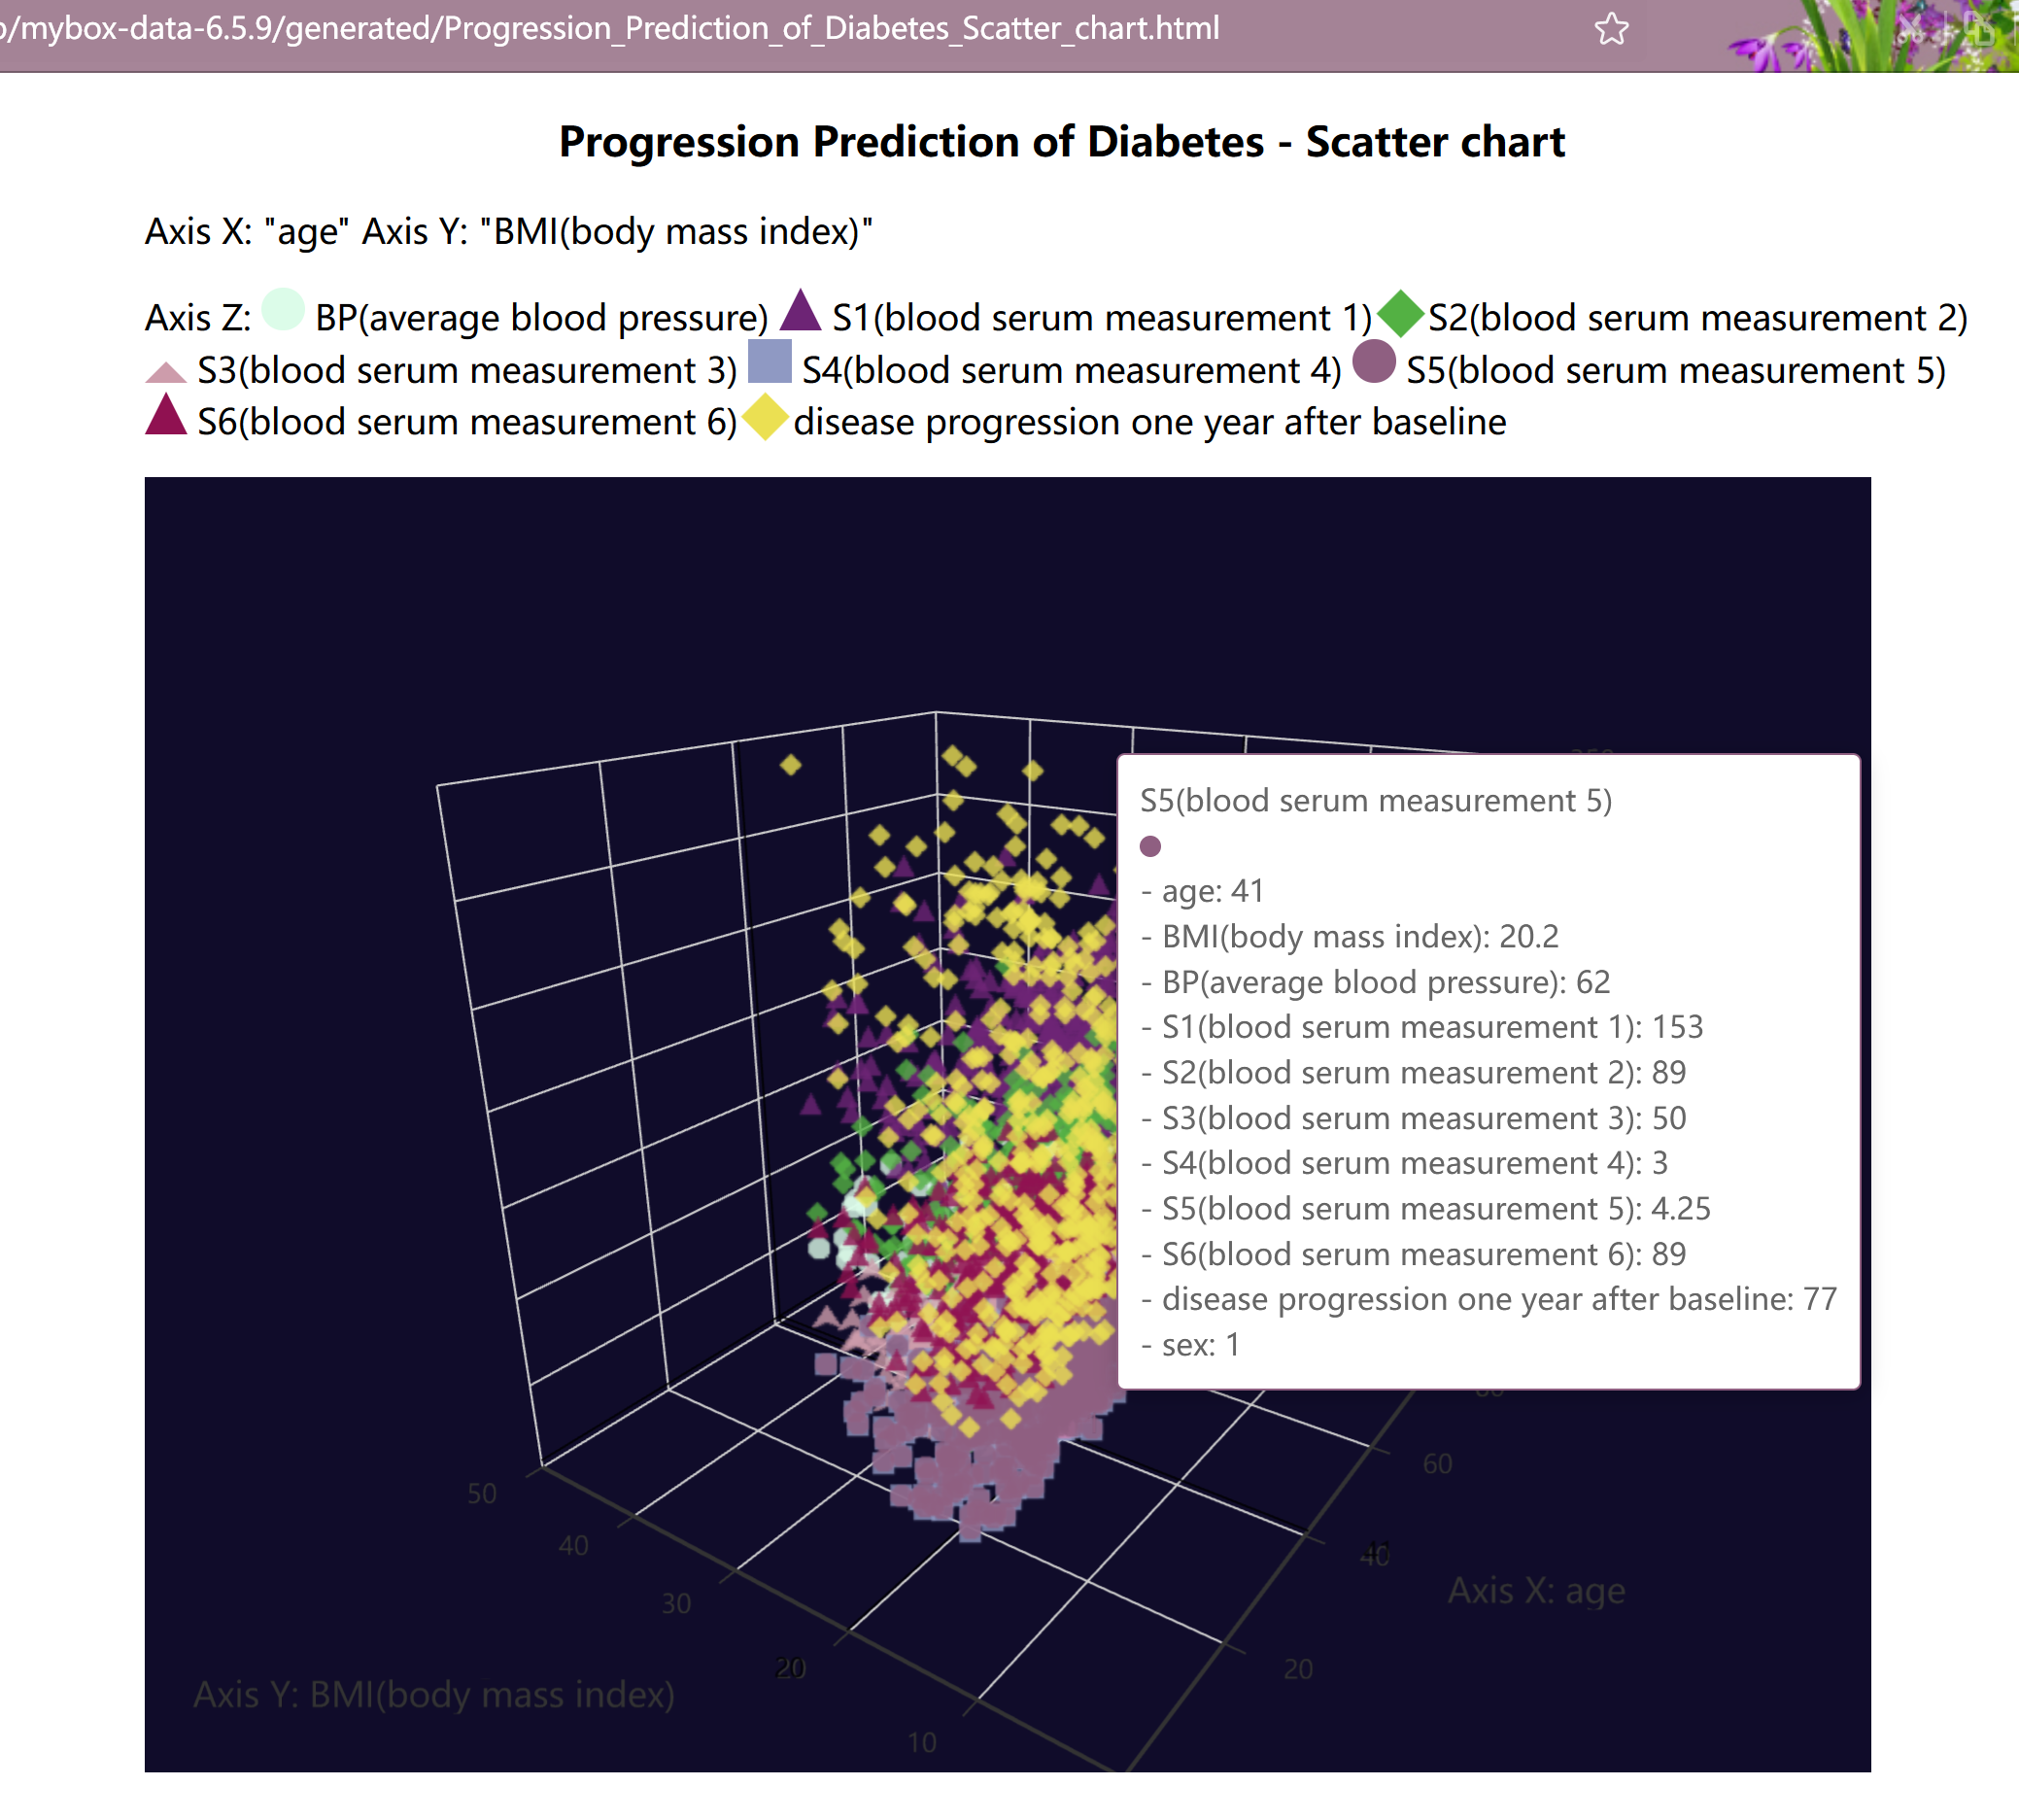
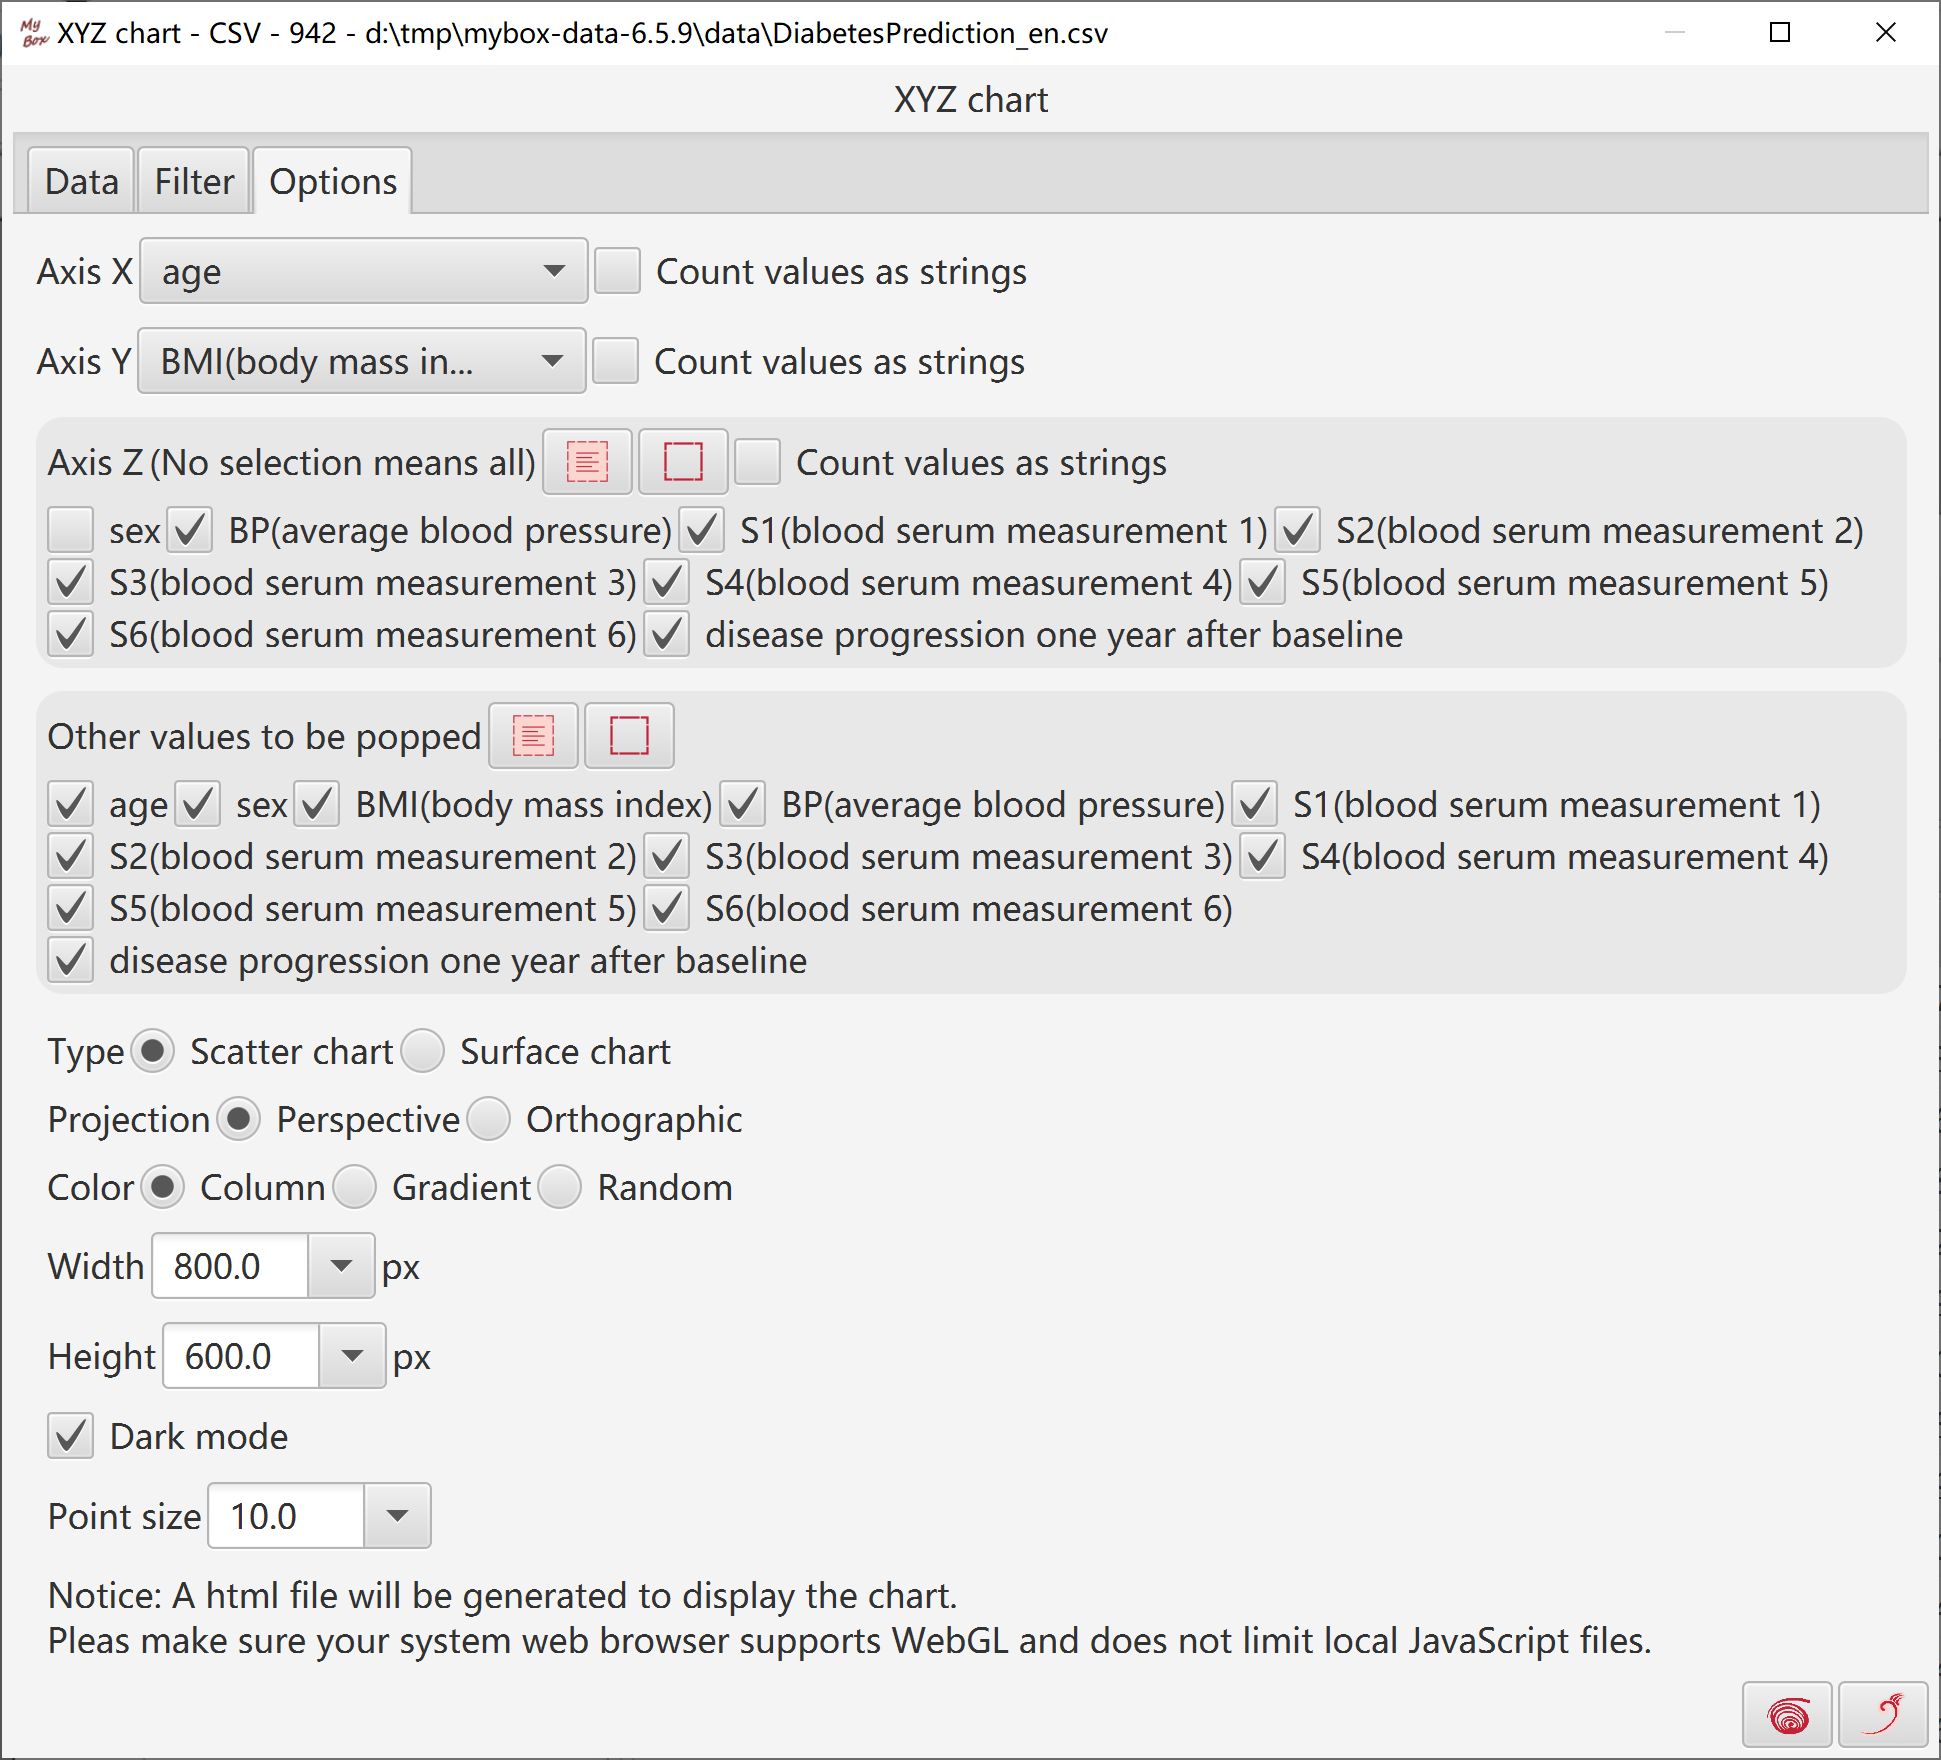
Select data rows. Data filter can be set.
Select data axises:
Select one column as axis X. Select as string or number.
Select one column as axis Y. Select as string or number.
Select several columns as axis Z. Select as string or number.
Select other columns to be popped in labels
Set parameters of the chart: projection, color, width, height, whether dark, point size.
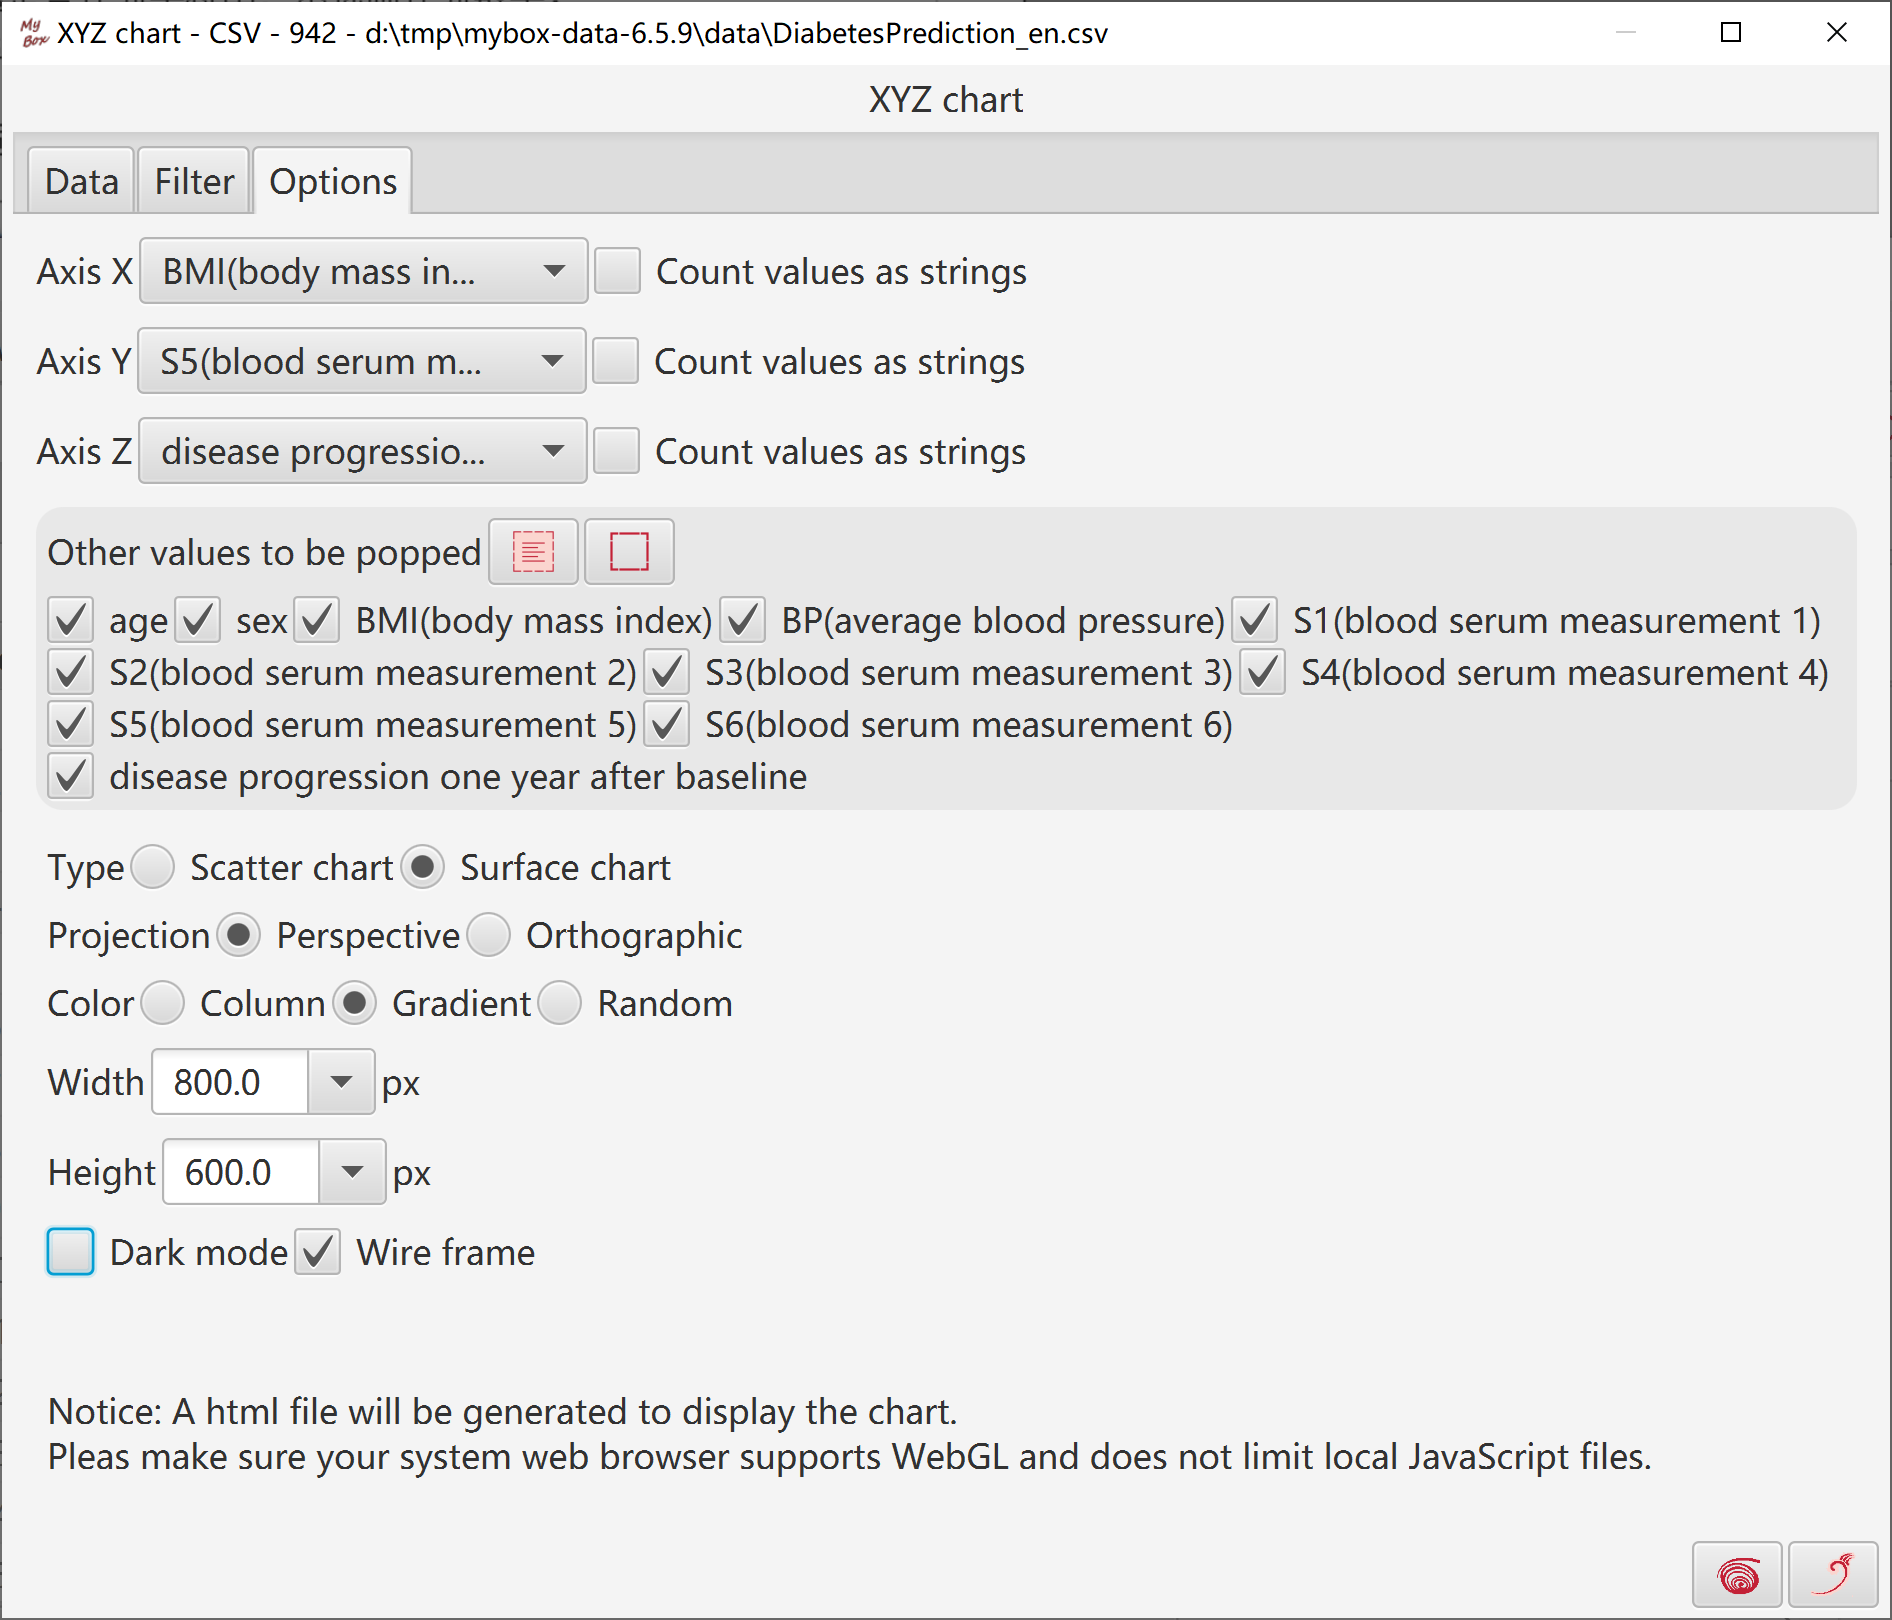
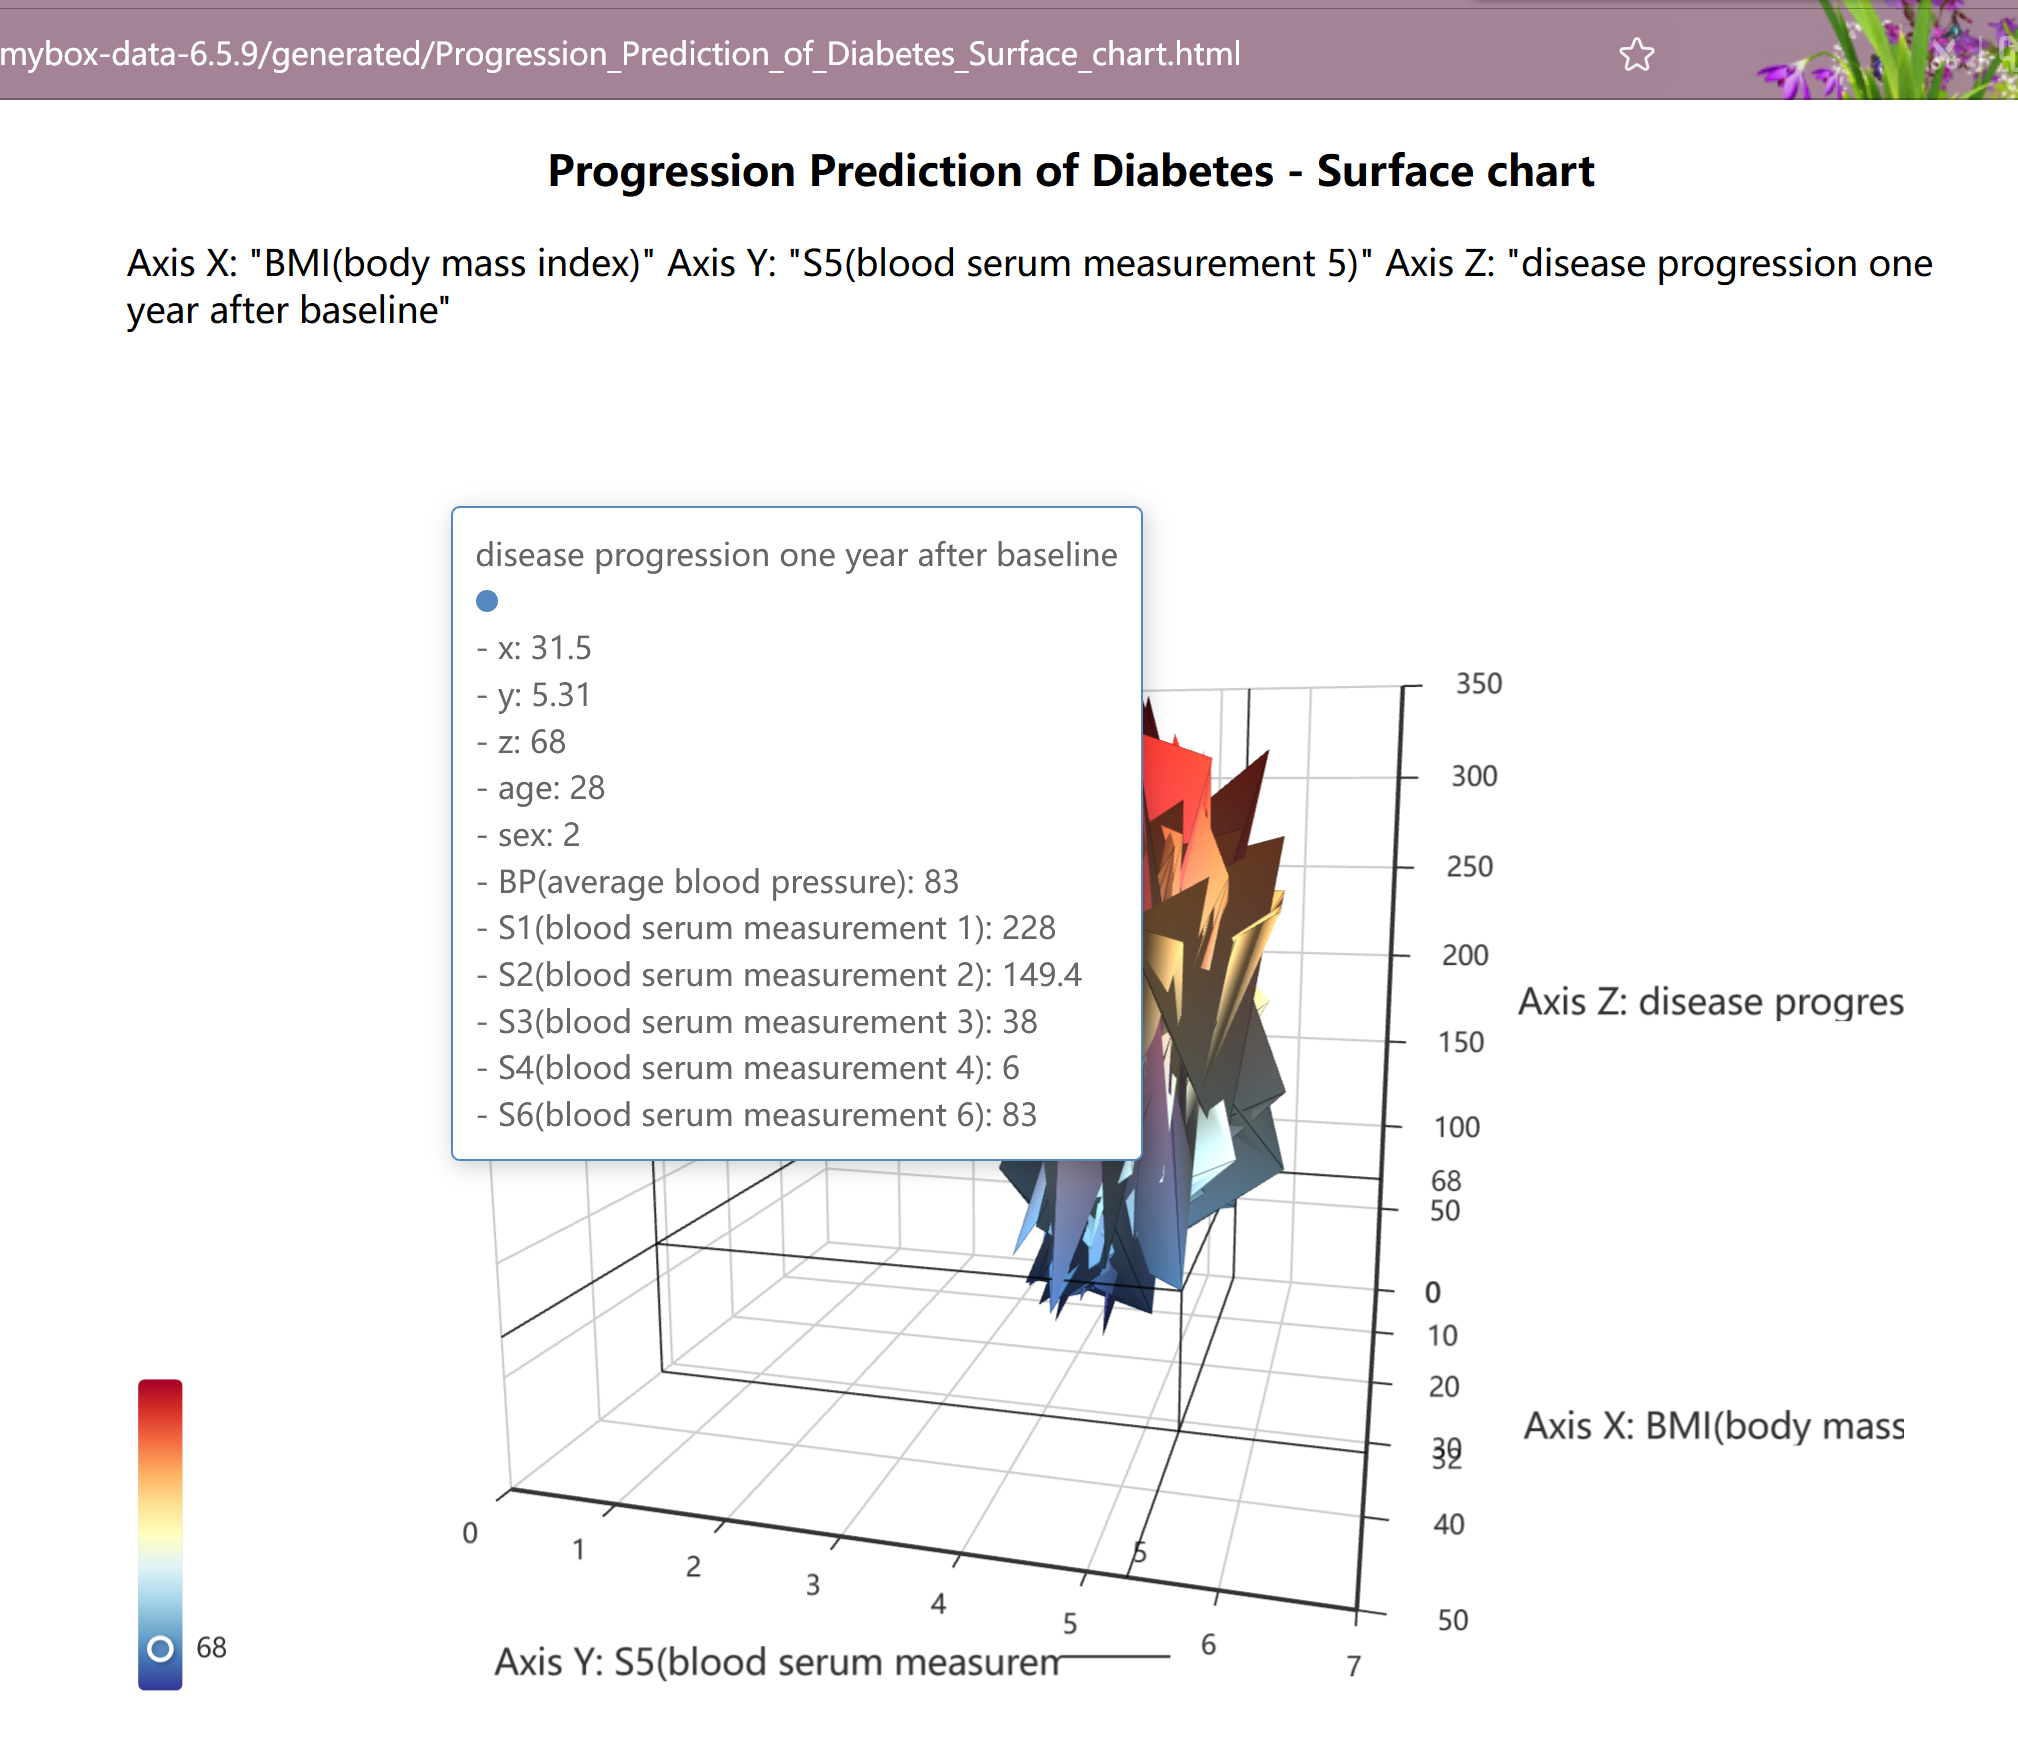
Select data rows. Data filter can be set.
Select data axises:
Select one column as axis X. Select as string or number.
Select one column as axis Y. Select as string or number.
Select one column as axis Z. Select as string or number.
Select other columns to be popped in labels.
Set parameters of the chart: projection, color, width, height, whether dark, wire frame.
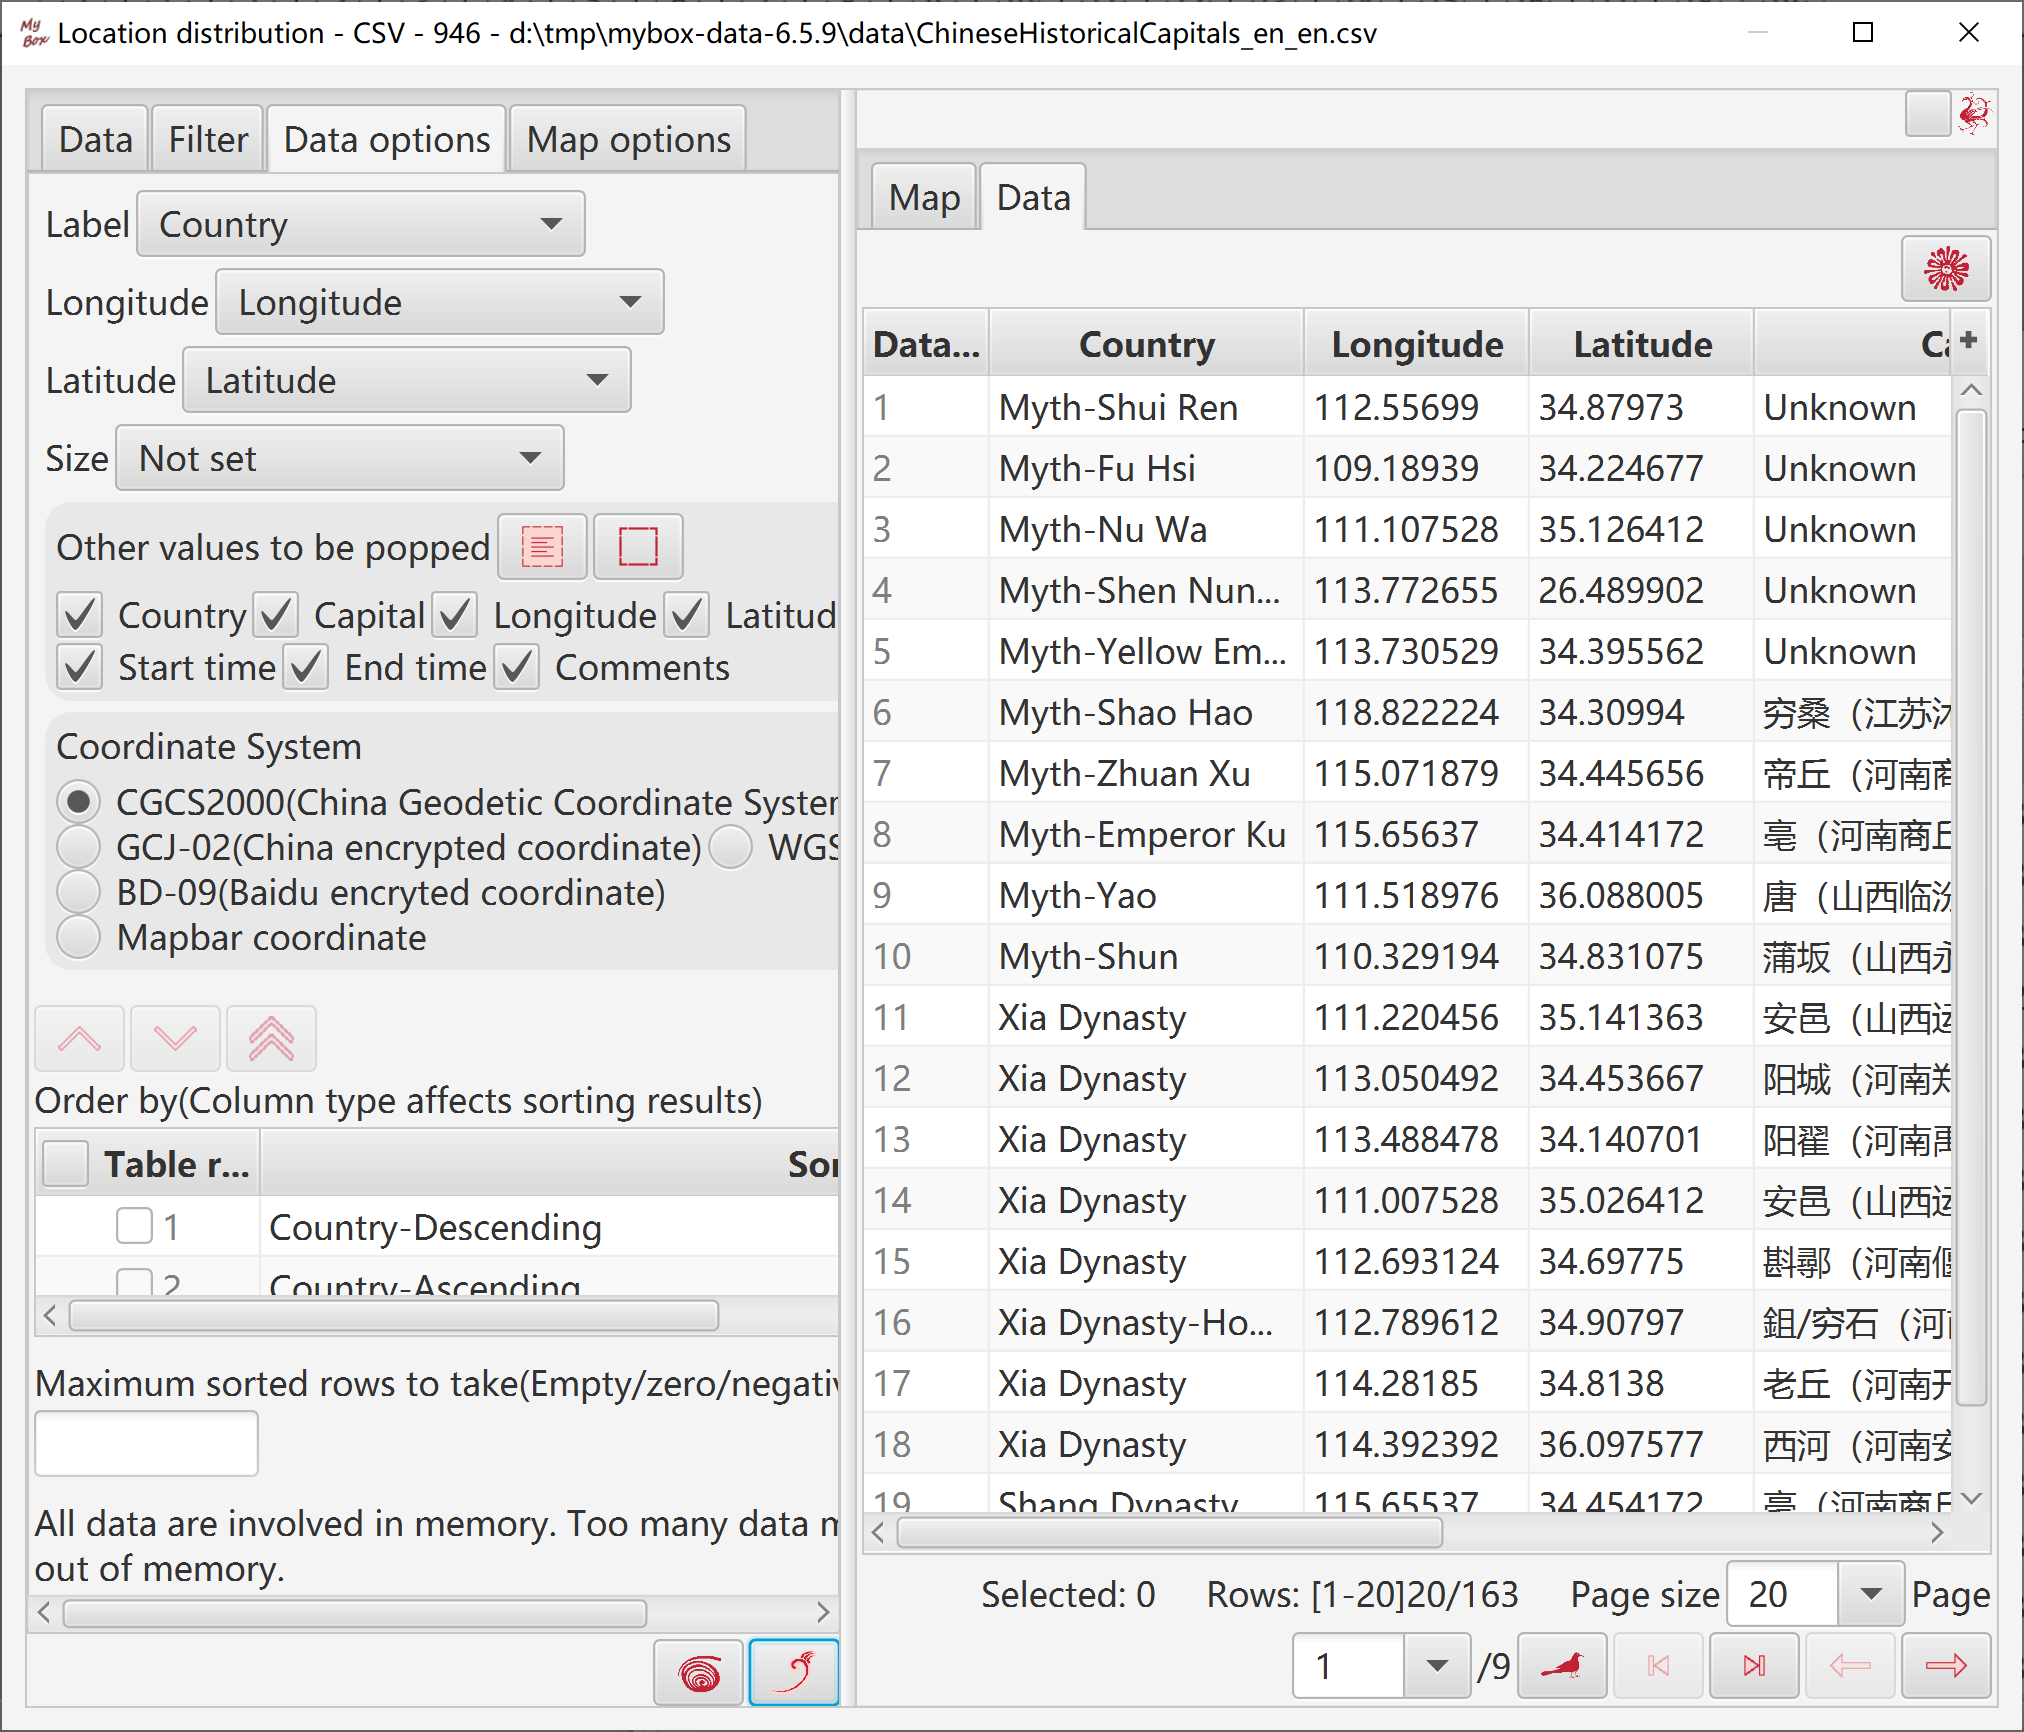
Display location data in map dynamically.
Select data rows. Data filter can be set.
Select one column for each og following: Label, Longtitude, Latitude, and Size.
Select other columns to be displayed in popped labels.
Select coordinate system of data.
Set conditions of sorting, and maximum data number to take.
Data referred by map are displayed in table.
Map type: TianDi map, or GaoDe map.
Select projection and size of map.
Set image and text of markers.
Select whether pop information.
Select controls of map.
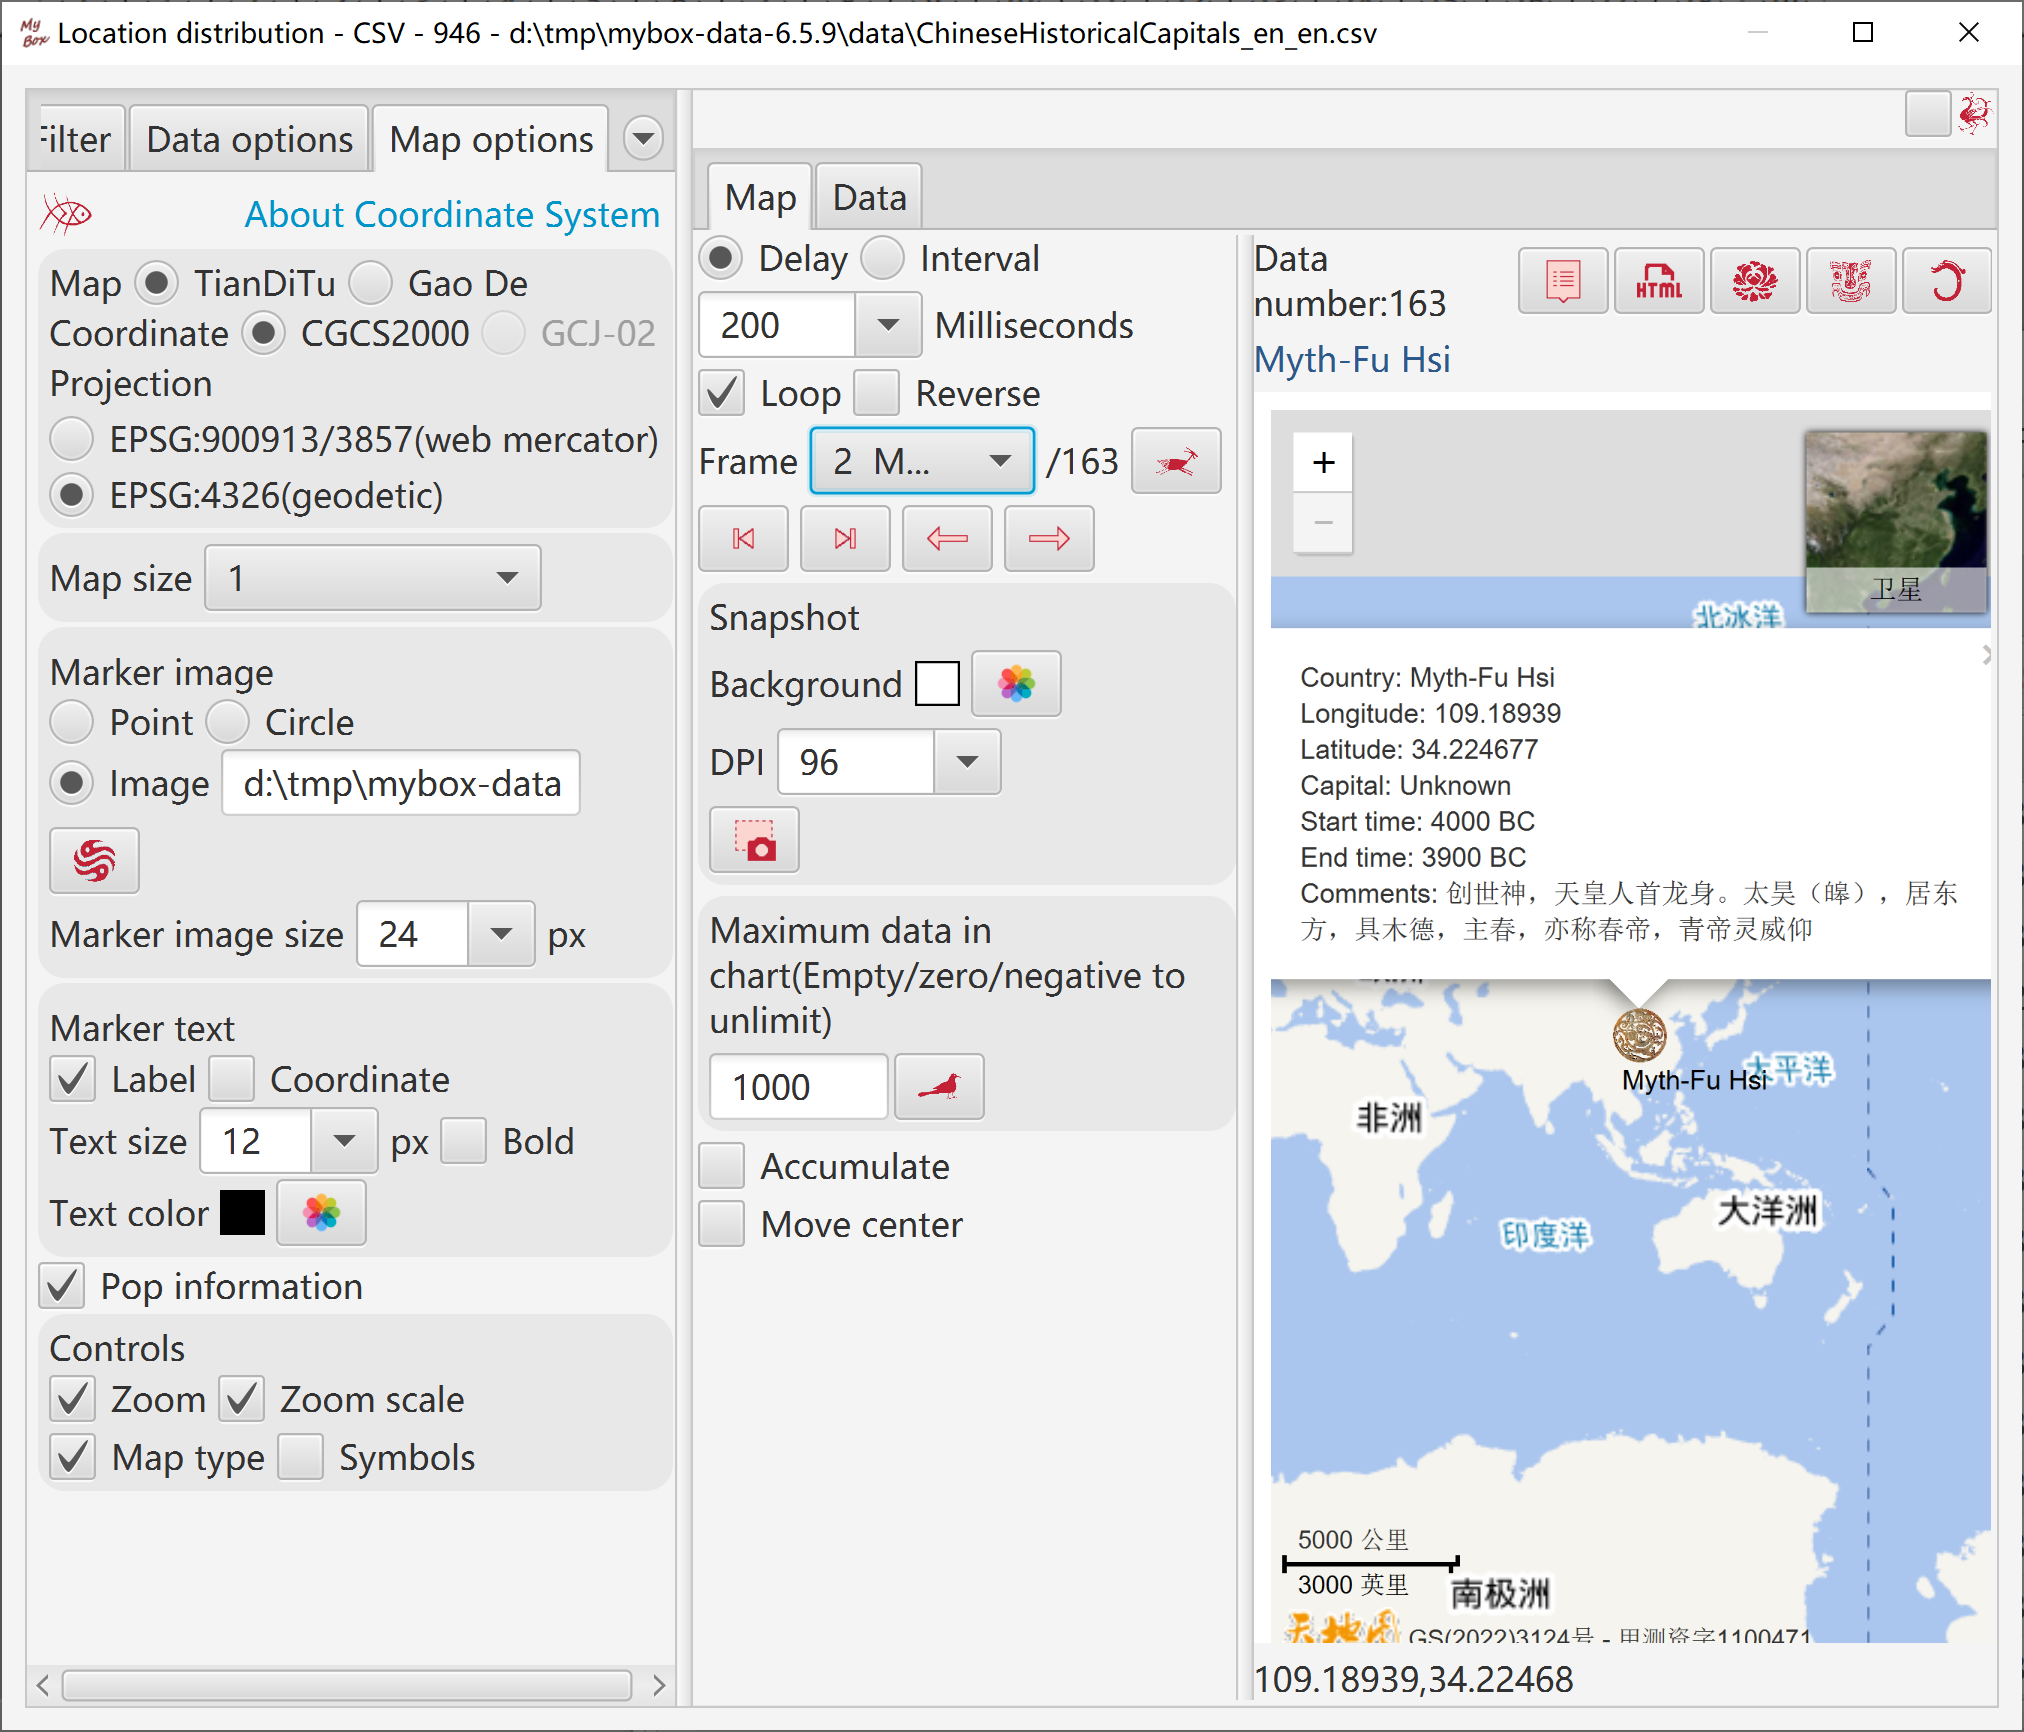
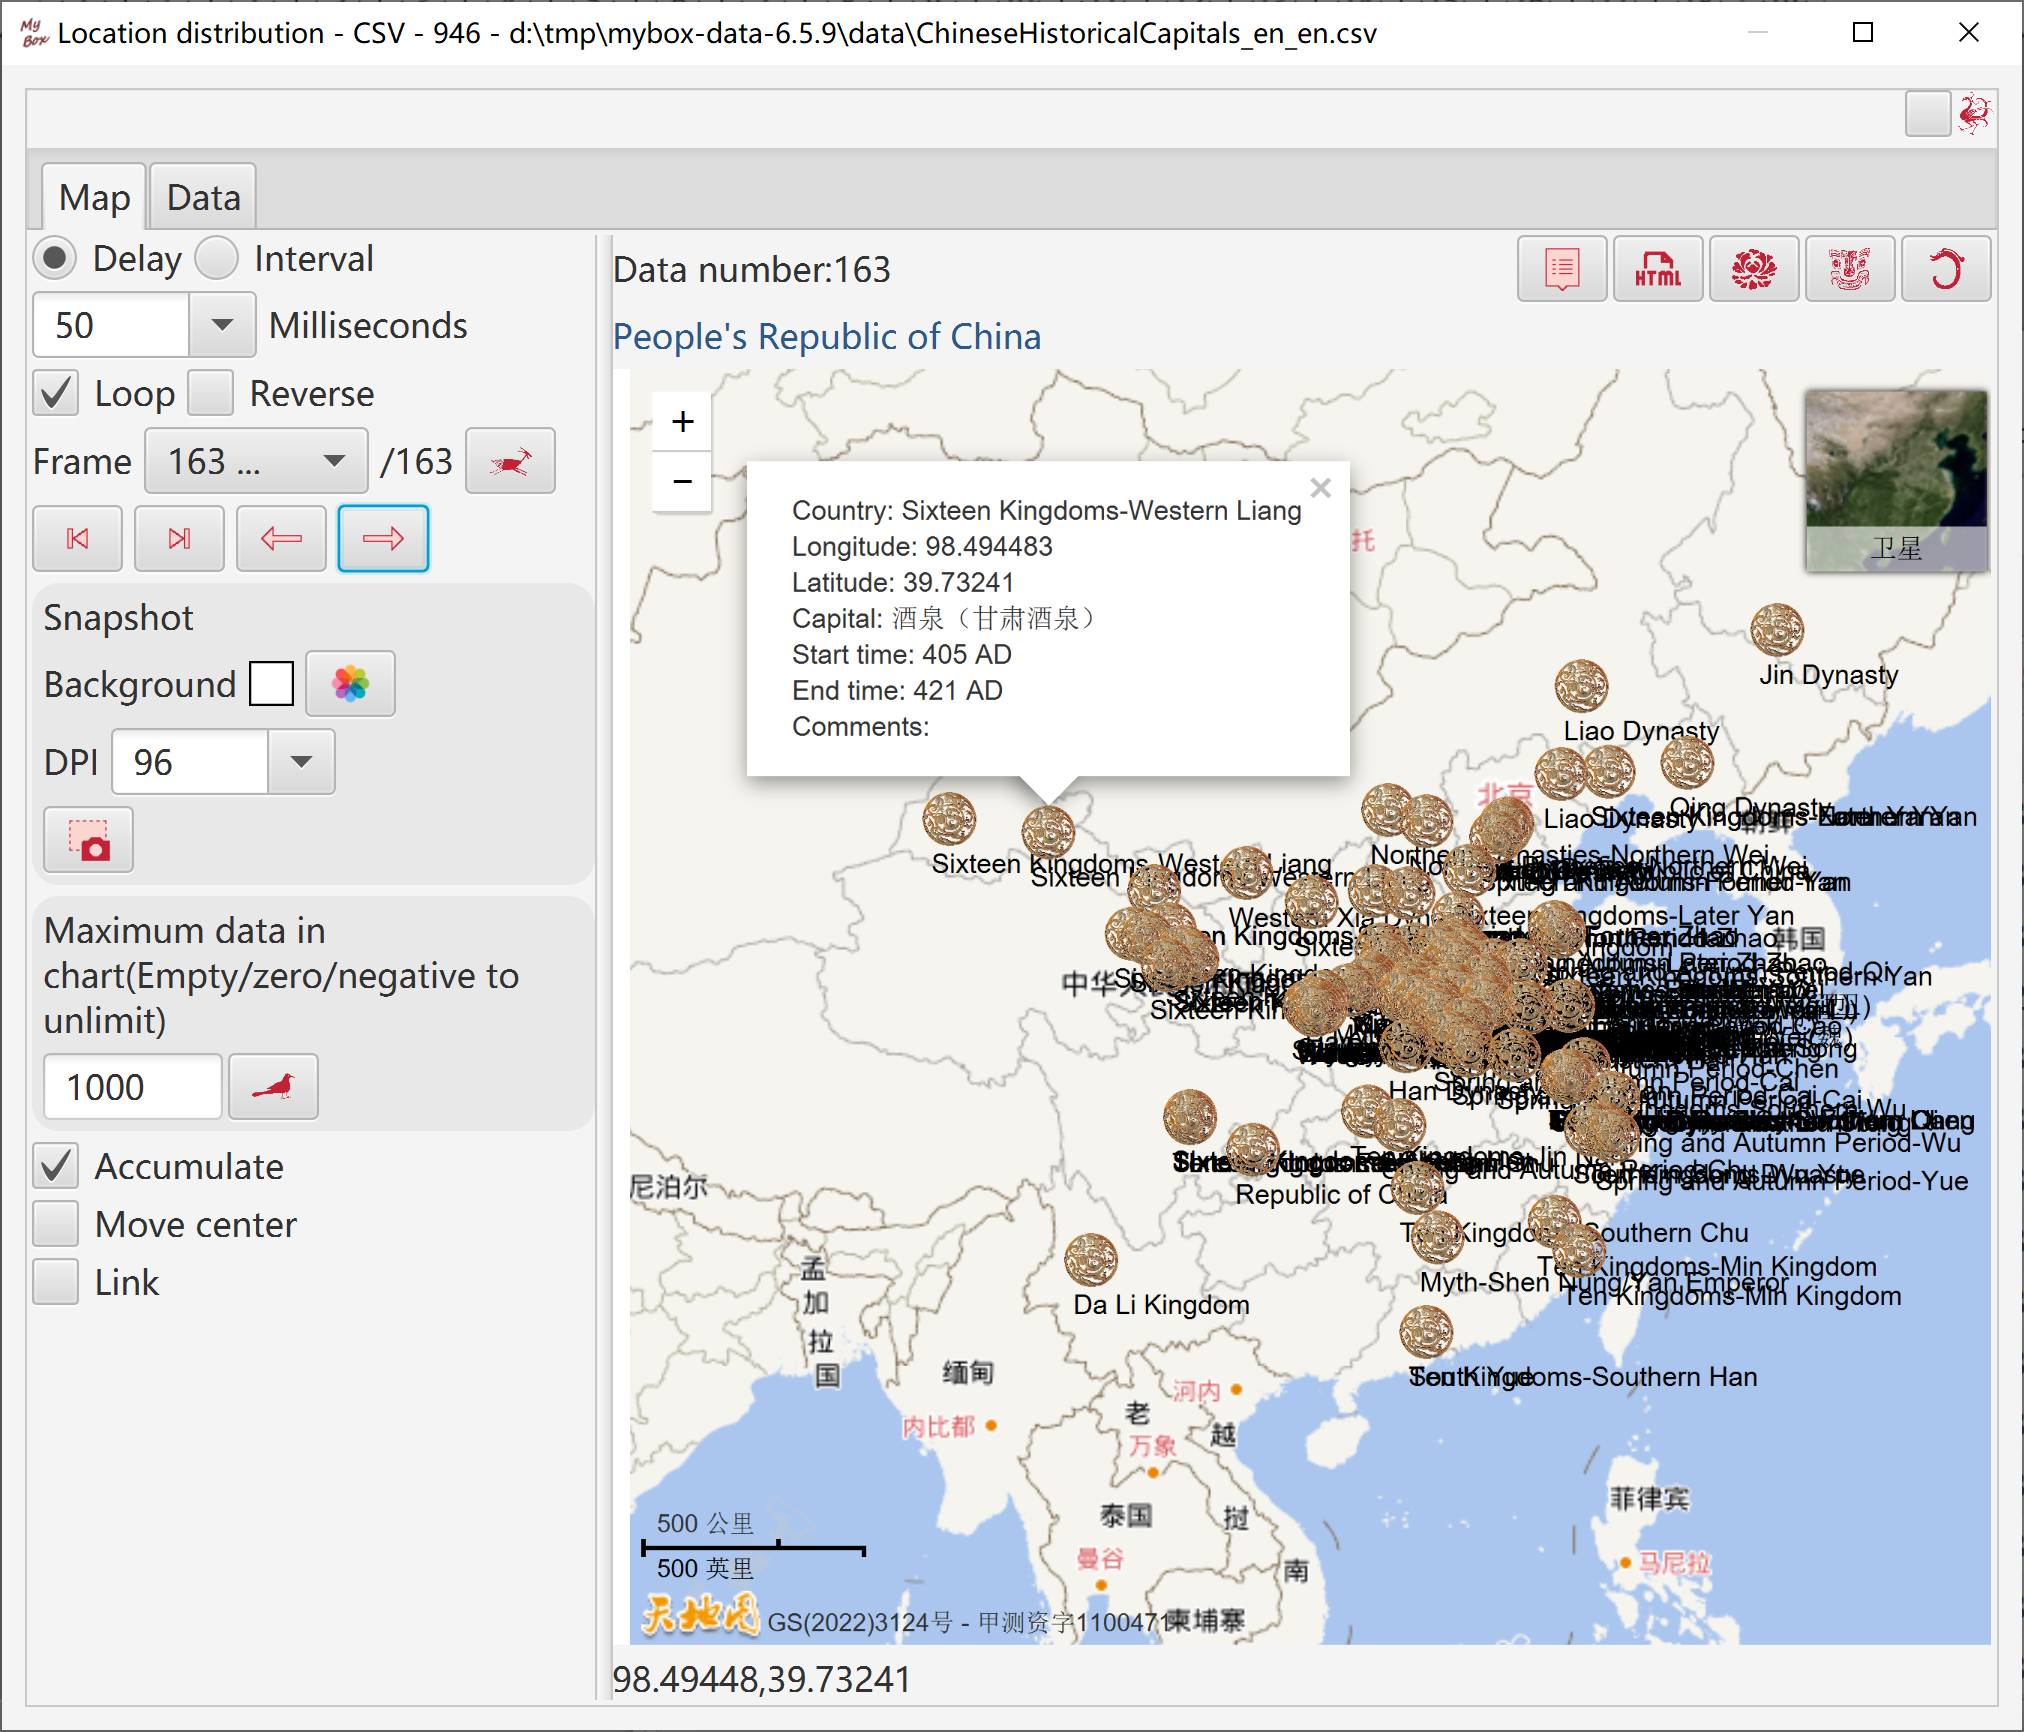
Select timer:
Delay: After display current frame, wait for defined time, and then display next frame.
Interval: Keep defined time between current frame and next frame.
Select whether: Loop, Reverse, Accumulate, Move Center, Link.
Auto-play.
Display specific frame.
Buttons of navigation.
Snapshot:
Select background color and dpi.
Snap frame by frame, and display them in “Edit Images List”.
Set maximum data number in chart.
Hover or click button “Function” to select functions under menu item “Group Charts”.
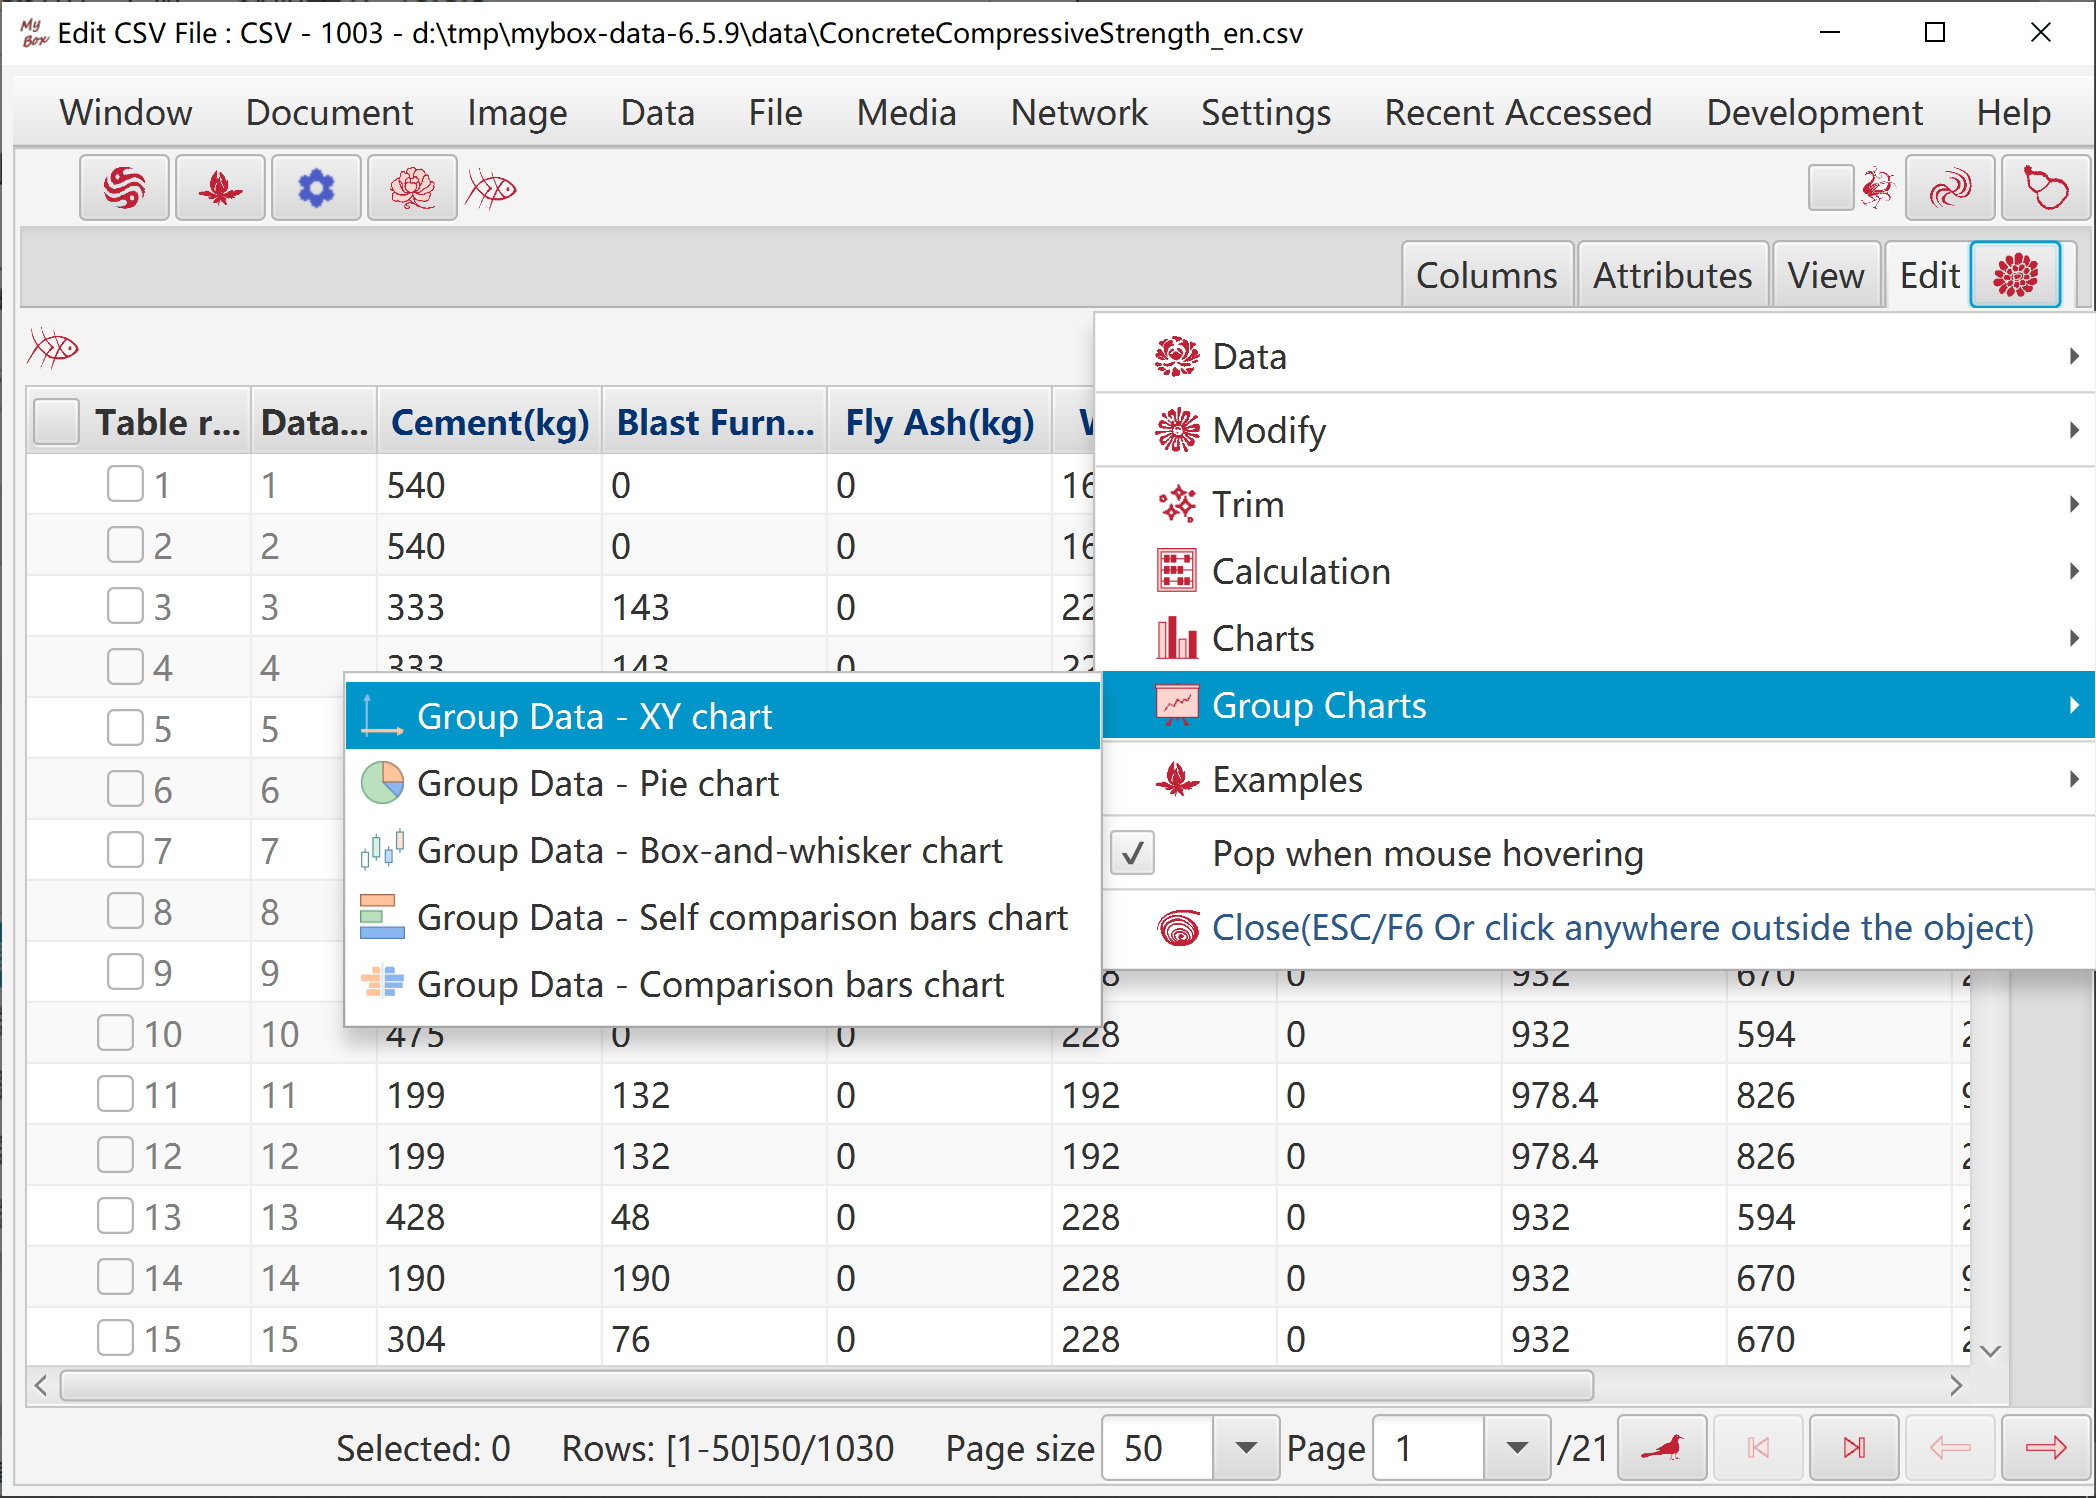
After data are grouped, generate one chart for each group, and display them in sequence dynamically.
Select data rows. Data filter can be set.
Set conditions of grouping.
Set specific options to generate chart.
Set conditions of sorting, and maximum data number to pick.
Set decimal scale, and how to handle invalid values.
After calculation, grouped data are displayed in table.
Specific display options of chart.
Set maximum data number displayed in chart.
Select timer:
Delay: After display current frame, wait for defined time, and then display next frame.
Interval: Keep defined time between current frame and next frame.
Select whether: Loop, Reverse, Accumulate, Move Center, Link.
Auto-play.
Display specific frame.
Buttons of navigation.
Snapshot:
Select background color and dpi.
Snap frame by frame, and display them in “Edit Images List”.
Select one column as category axis.
Select several columns as value axis.
Type of XY chart
Whether transpose
Select one column as category axis.
Select one column as value axis.
Select several columns to be calculated.
Box width
Whether display outliers lines or mean
Whether display connection lines of values, and whether dotted lines
Whether transpose
Maximum data number in chart
Select several columns to be calculated.
Select columns to be copied.
Select objects to compare: columns/rows/all.
Select comparison way: absoluate values, or range of minimum and maximum.
Set maximum width of bars.
Set maximum data number in chart
Select one column as category column(unnecessary).
Select two columns to be compared.
Select columns to be copied.
Select comparison way: absoluate values, or range of minimum and maximum.
Set maximum width of bars.
Set maximum data number in chart
Read contents in System Clipboard.
Guess delimeter and parse data.
User can select a delimeter to parse data.
Select how to parse:
CSV parser: Values can contain delimeter and line break. But not support parsing “Blanks” and “Regular Expression”.
Text parser: Values can not contain delimeter and line break. Support parsing “Blanks” and “Regular Expression”.
Select whether first line defines column names.
Based on parsed data, select rows and columns to load. Data filter can be set.
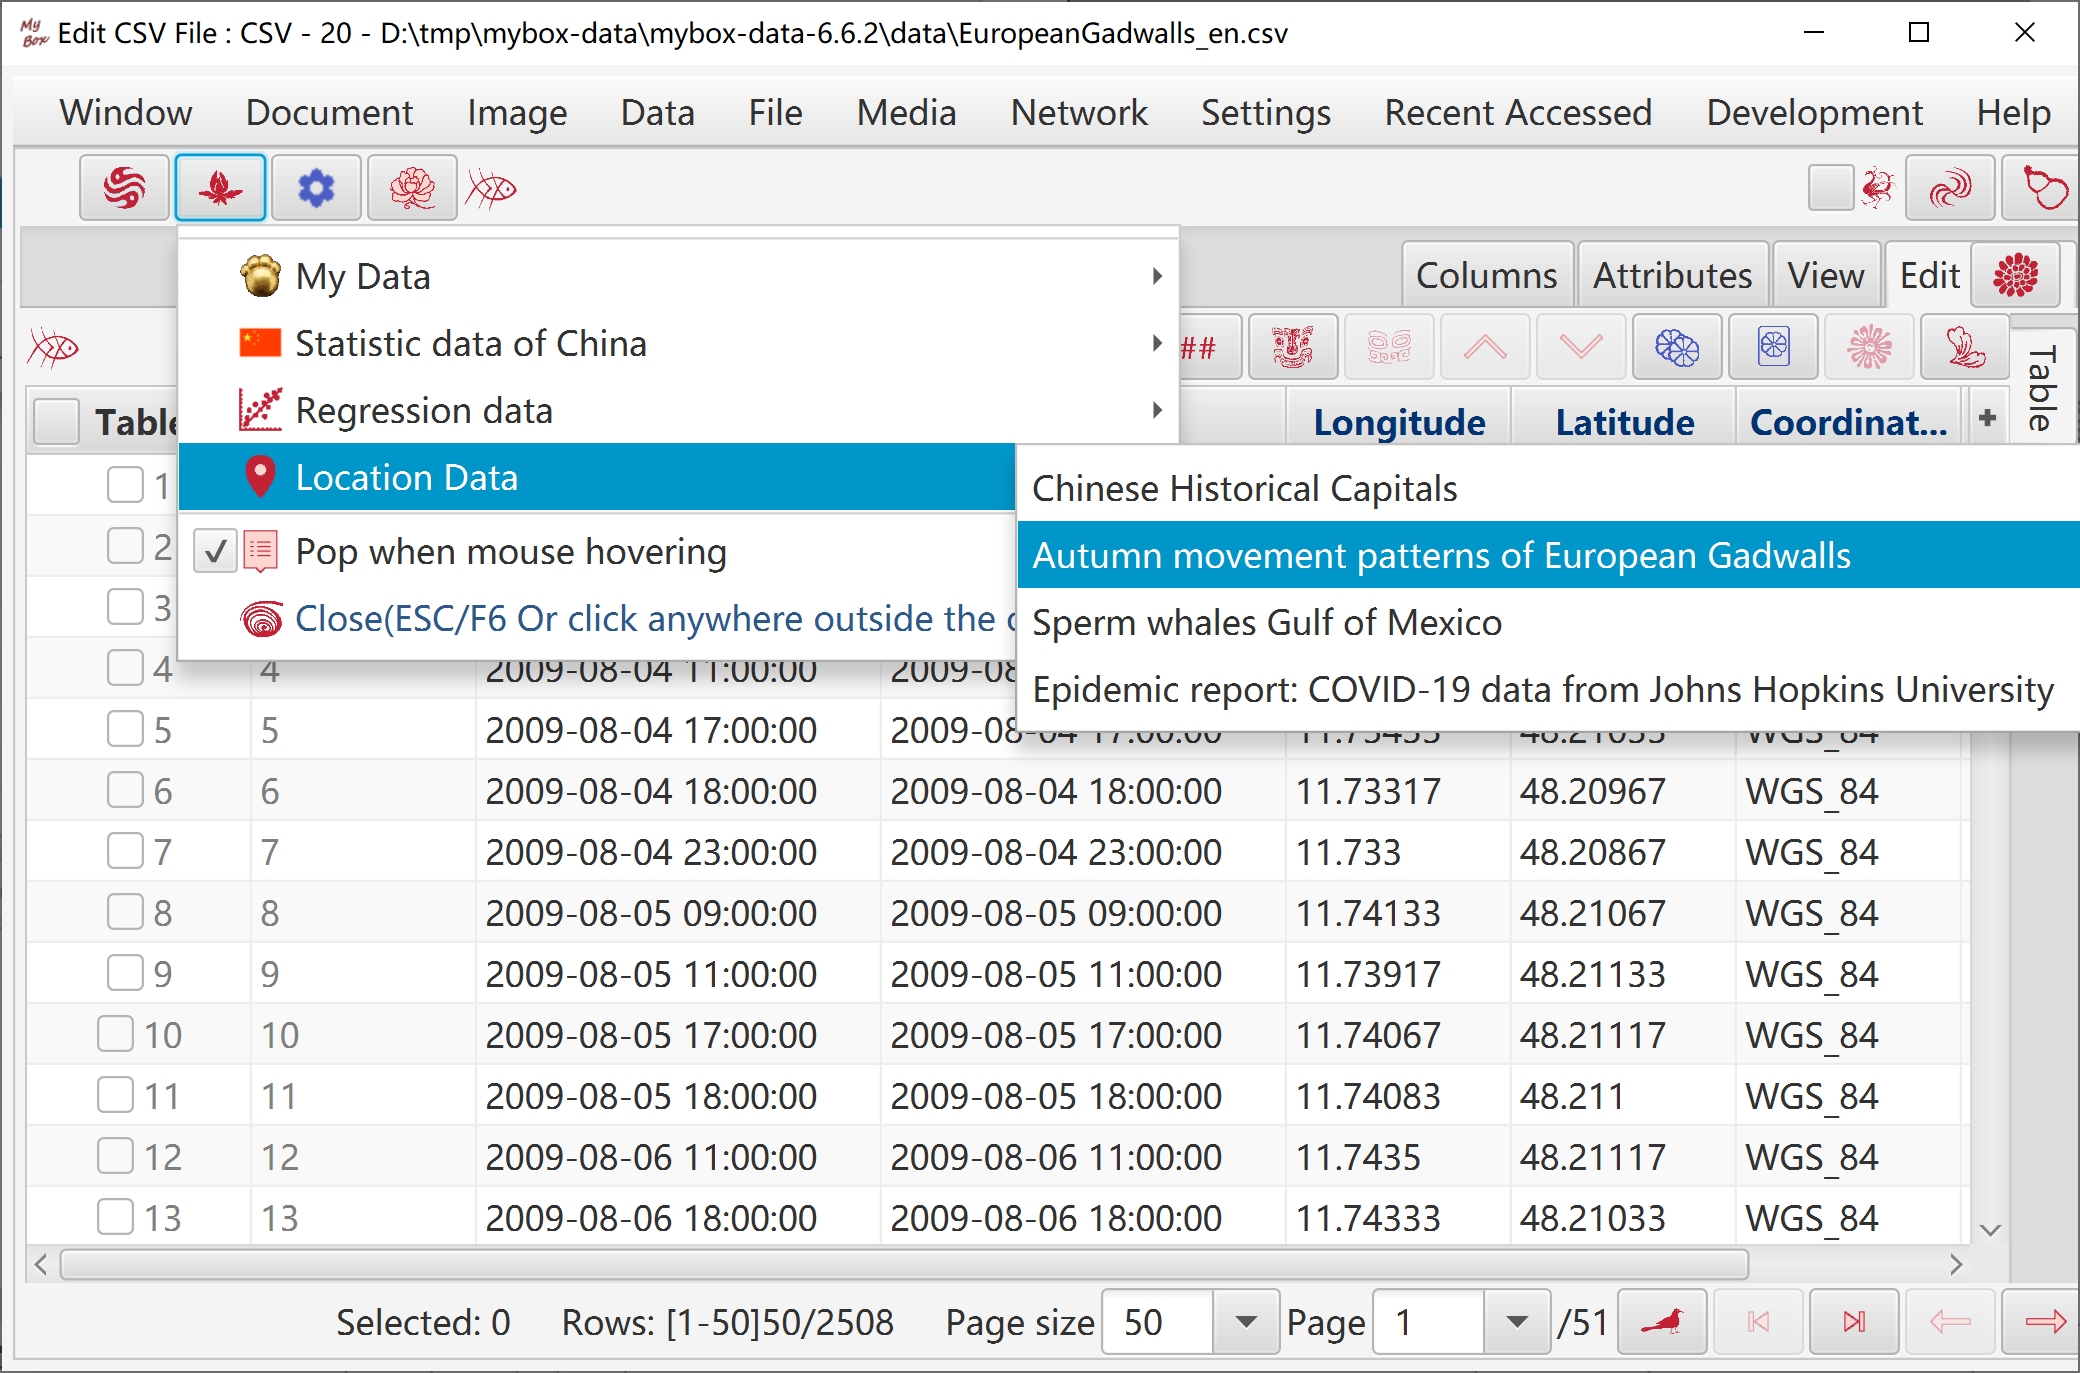
Hover or click button “Examples” and item in popped menu.
Record private data.
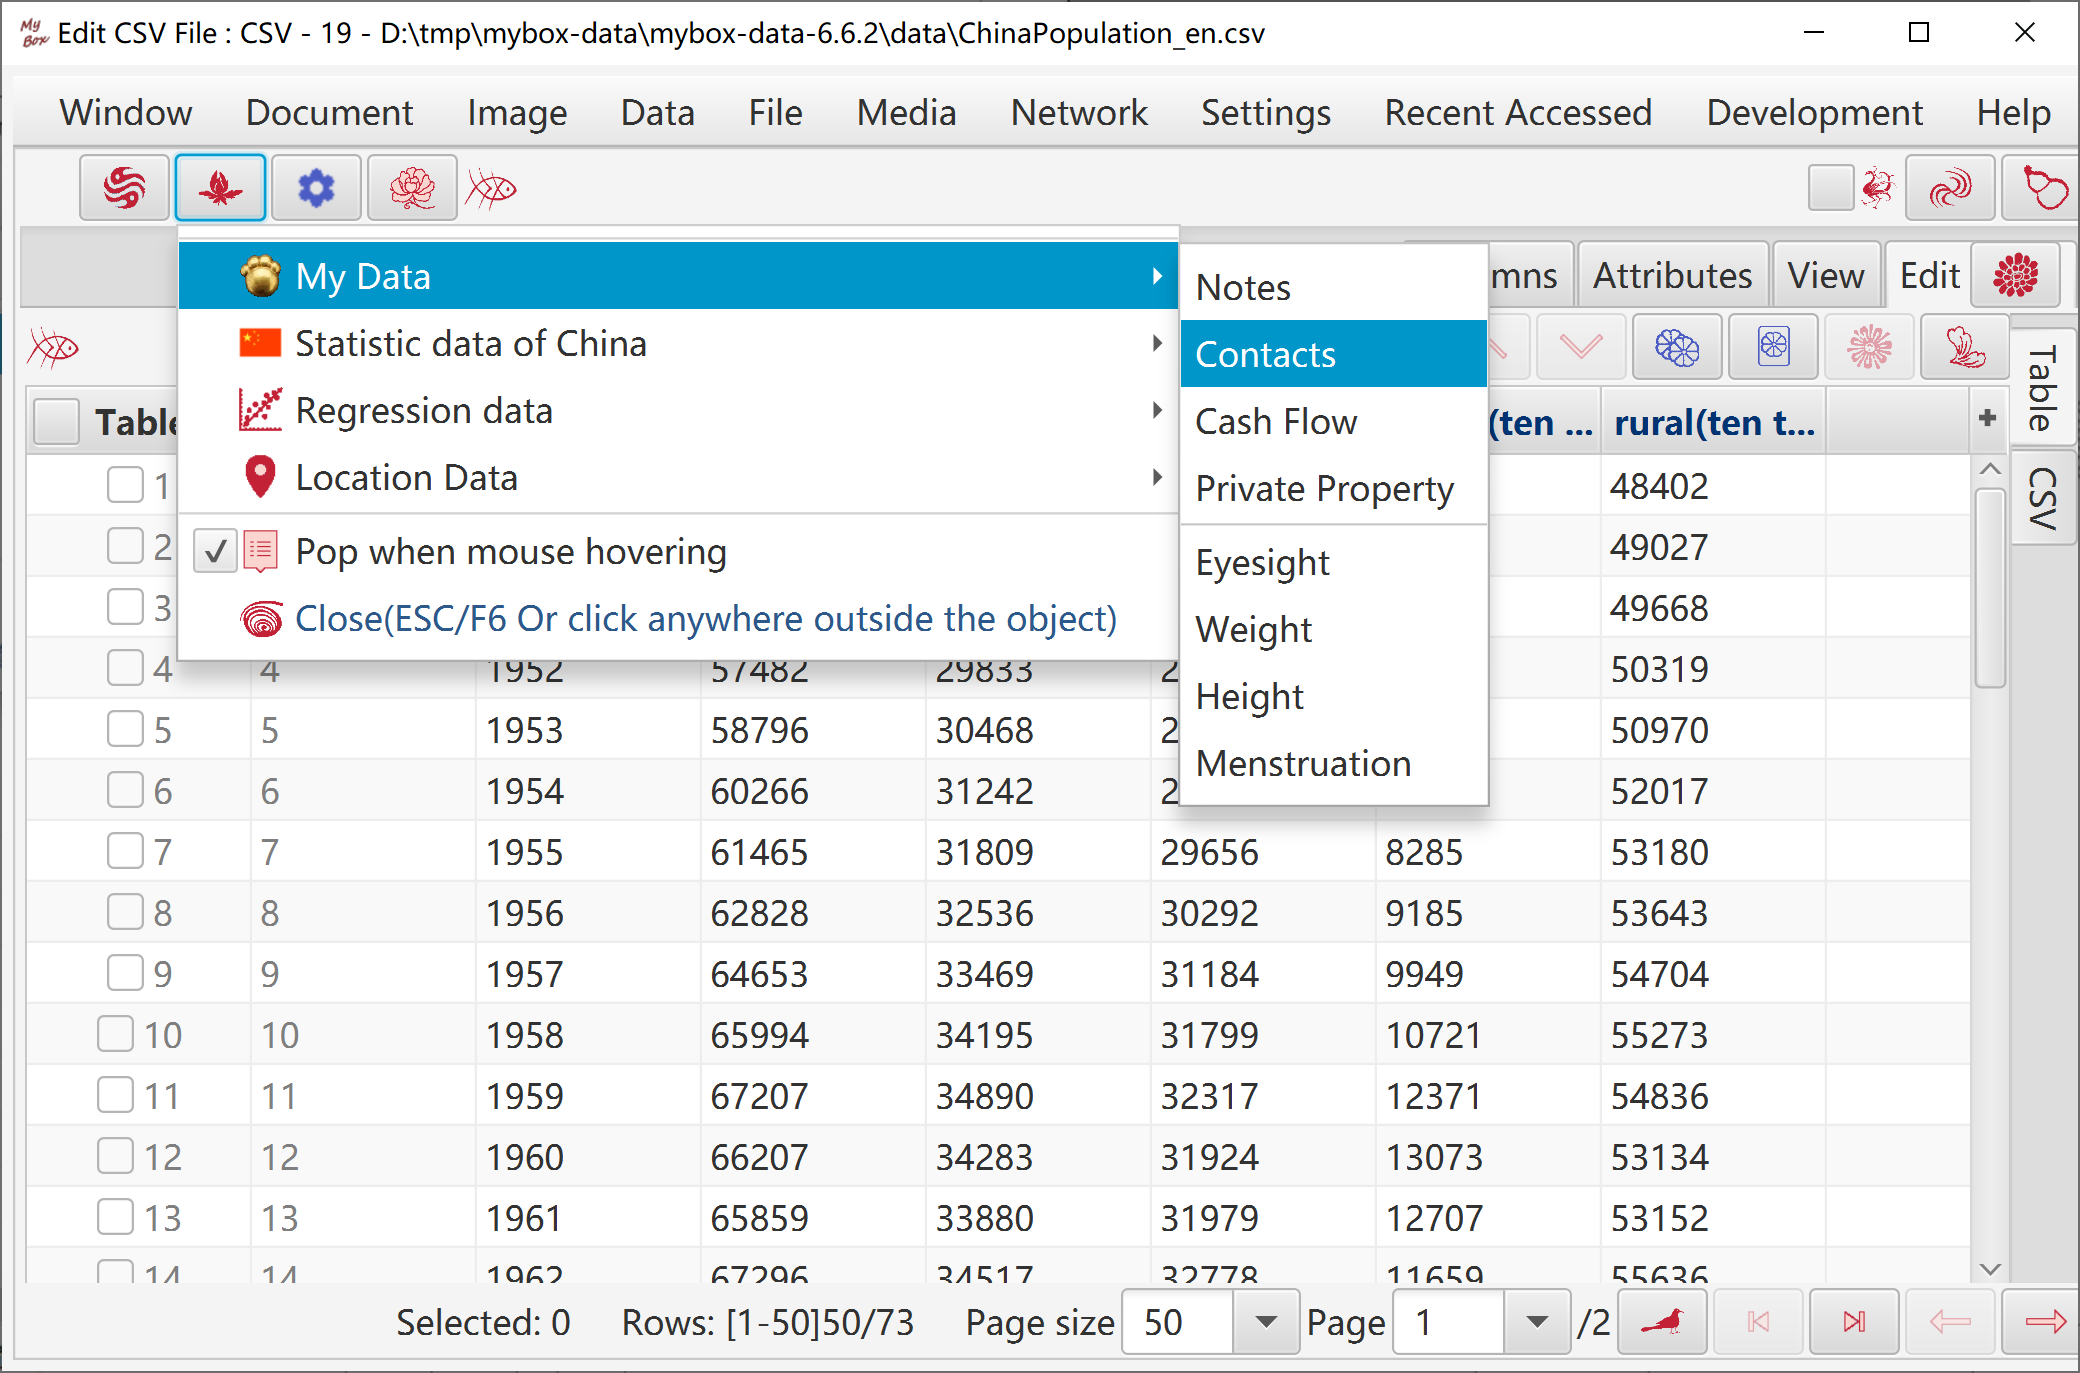
Data from China National Bureau of Statistics.
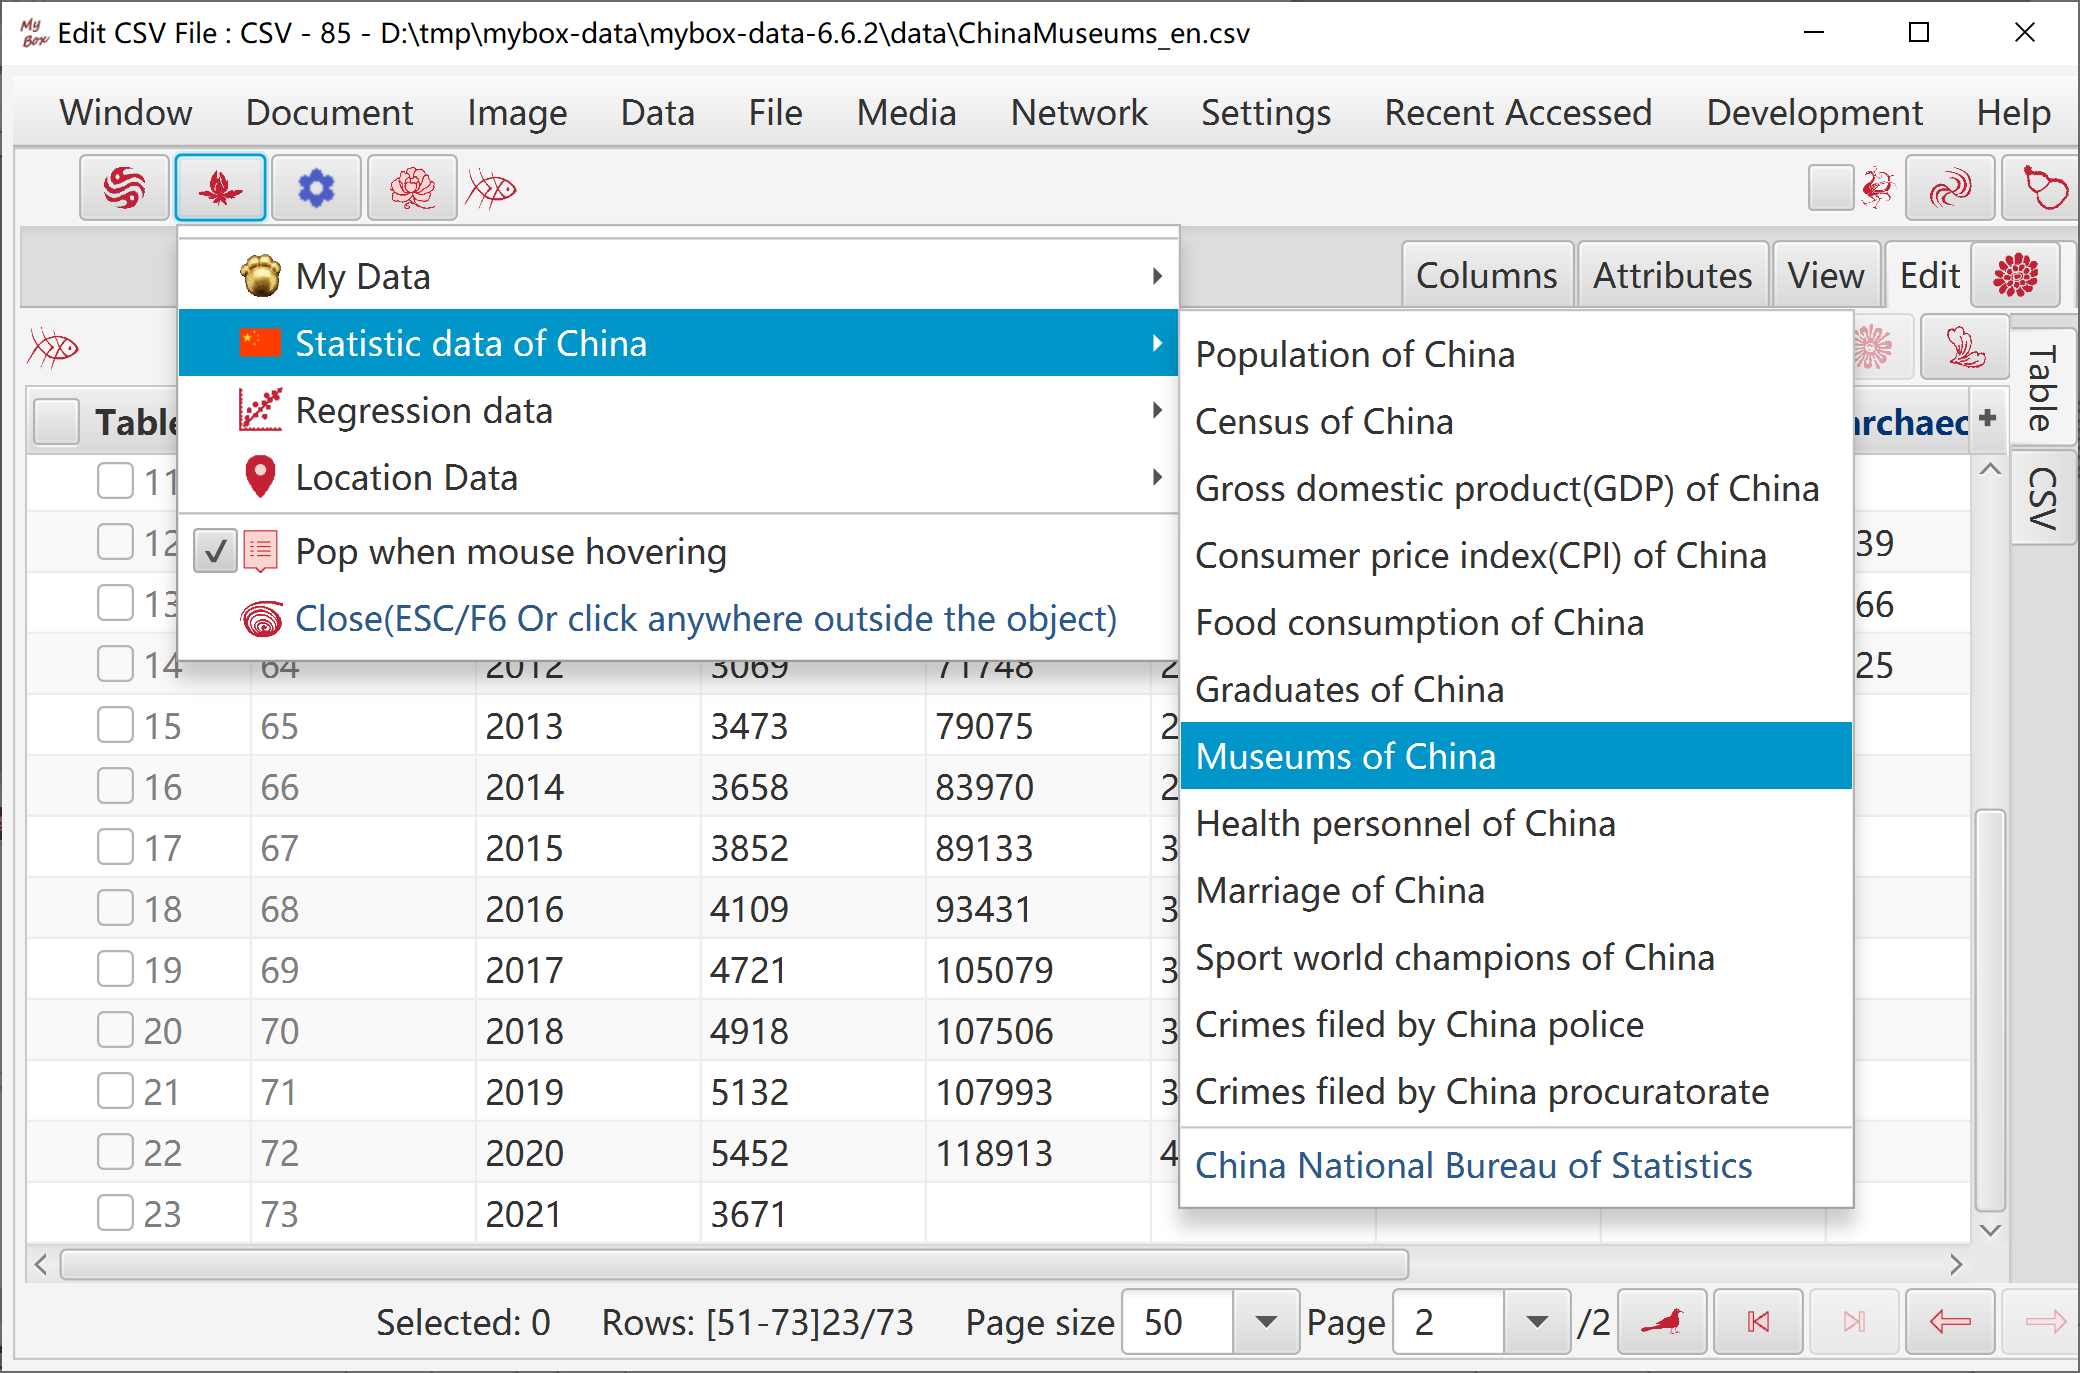
Data can be used to analyse models of regression.
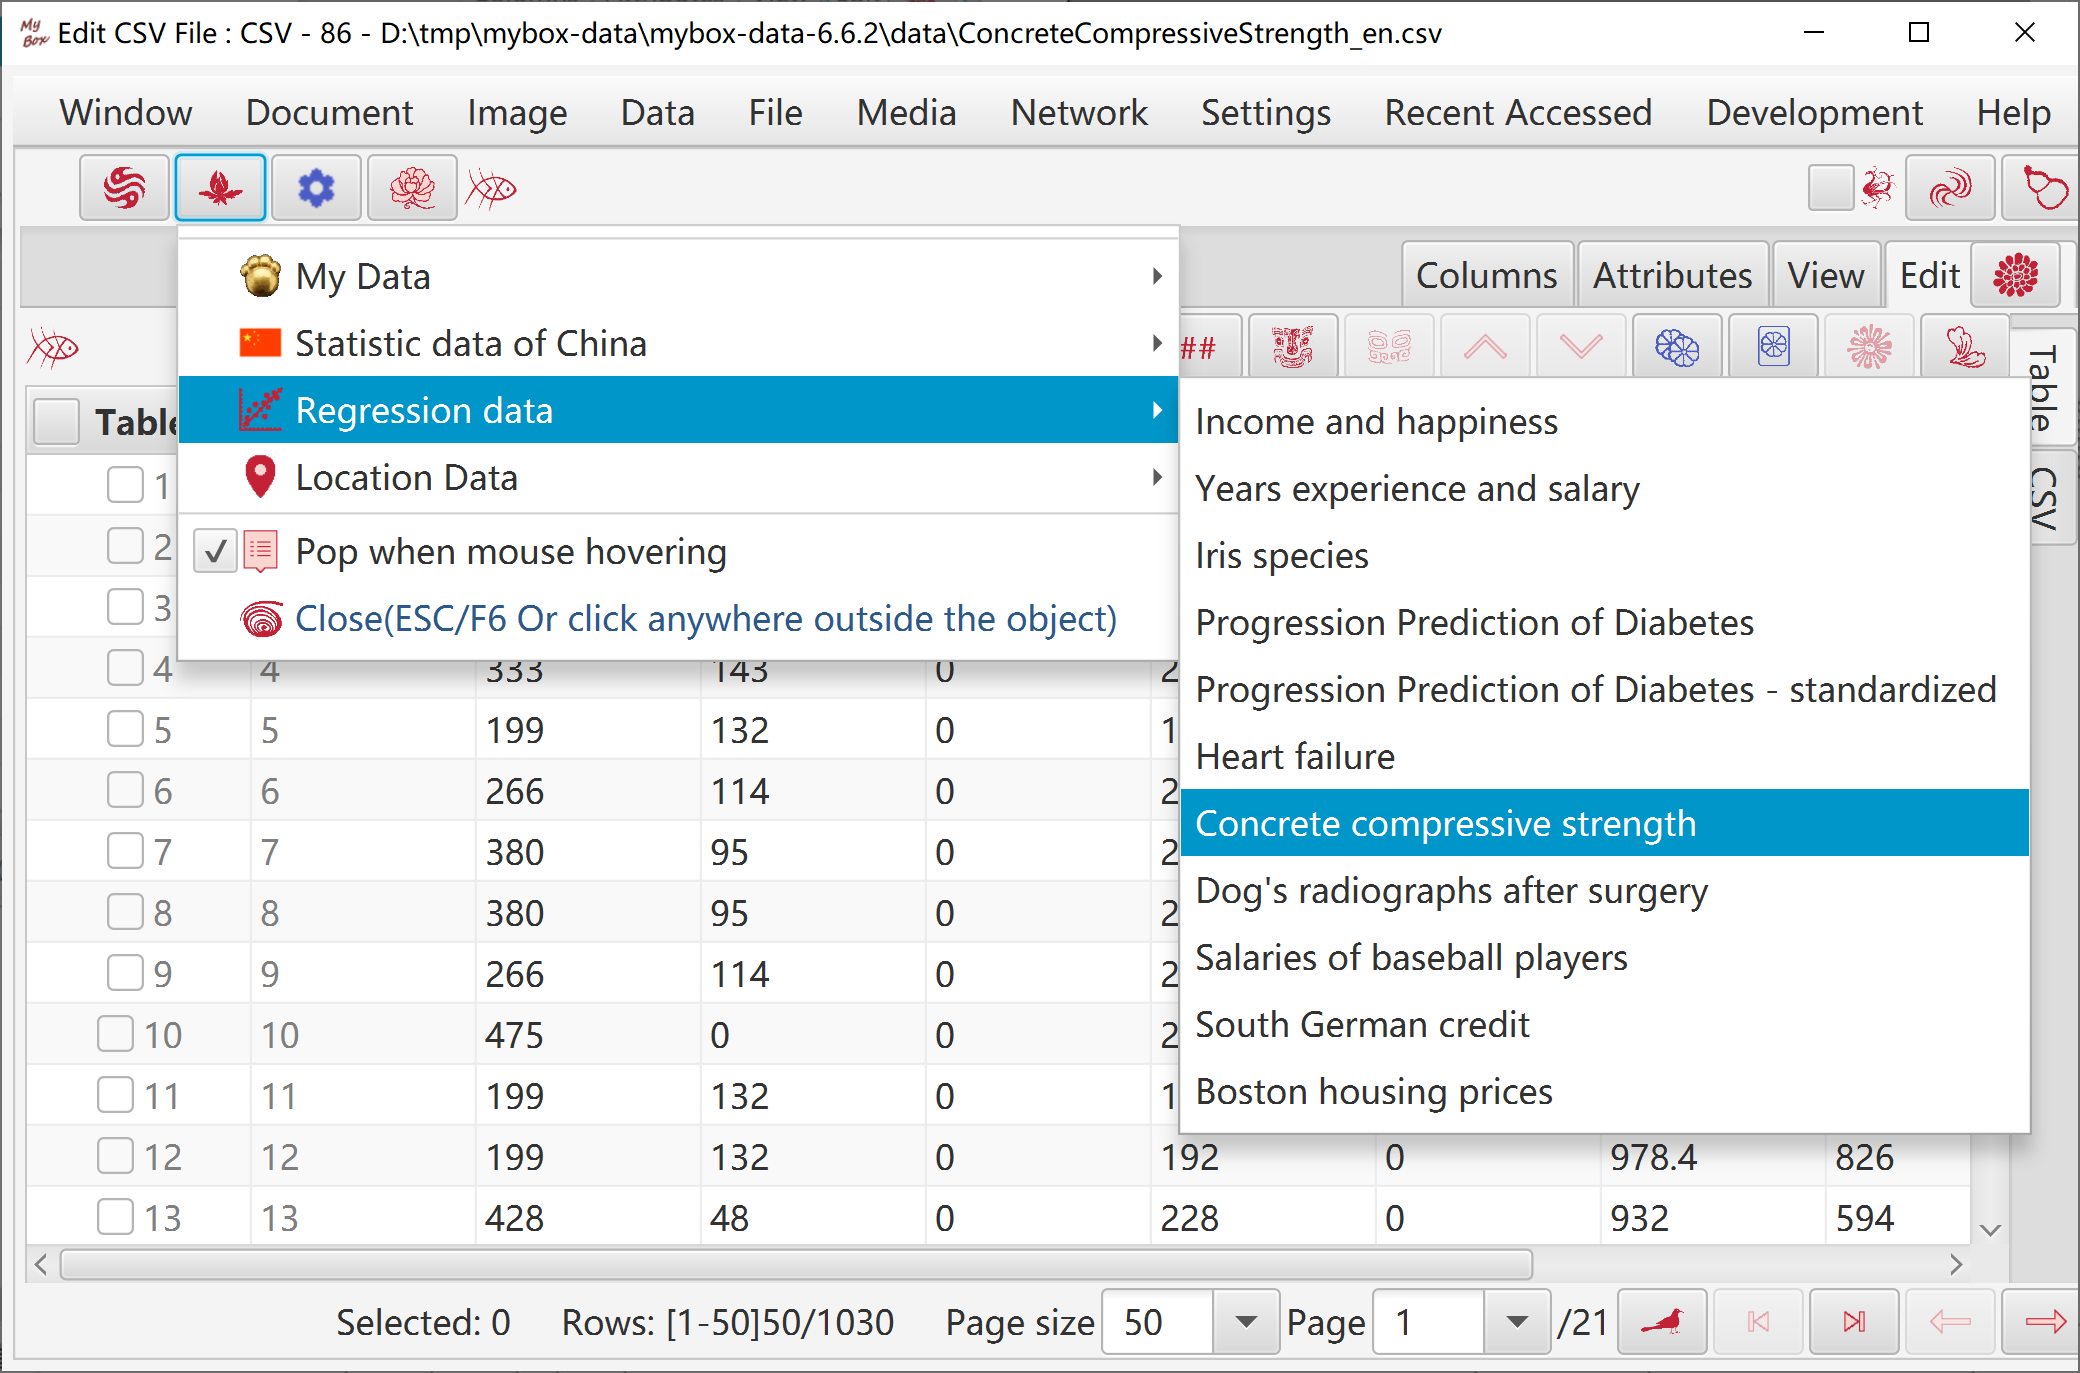
Data can be used to generate “Location Distribution”.
Hover or click button “Function” to select functions under menu item “Data”.
Select data rows and columns.
Data filter can be set.
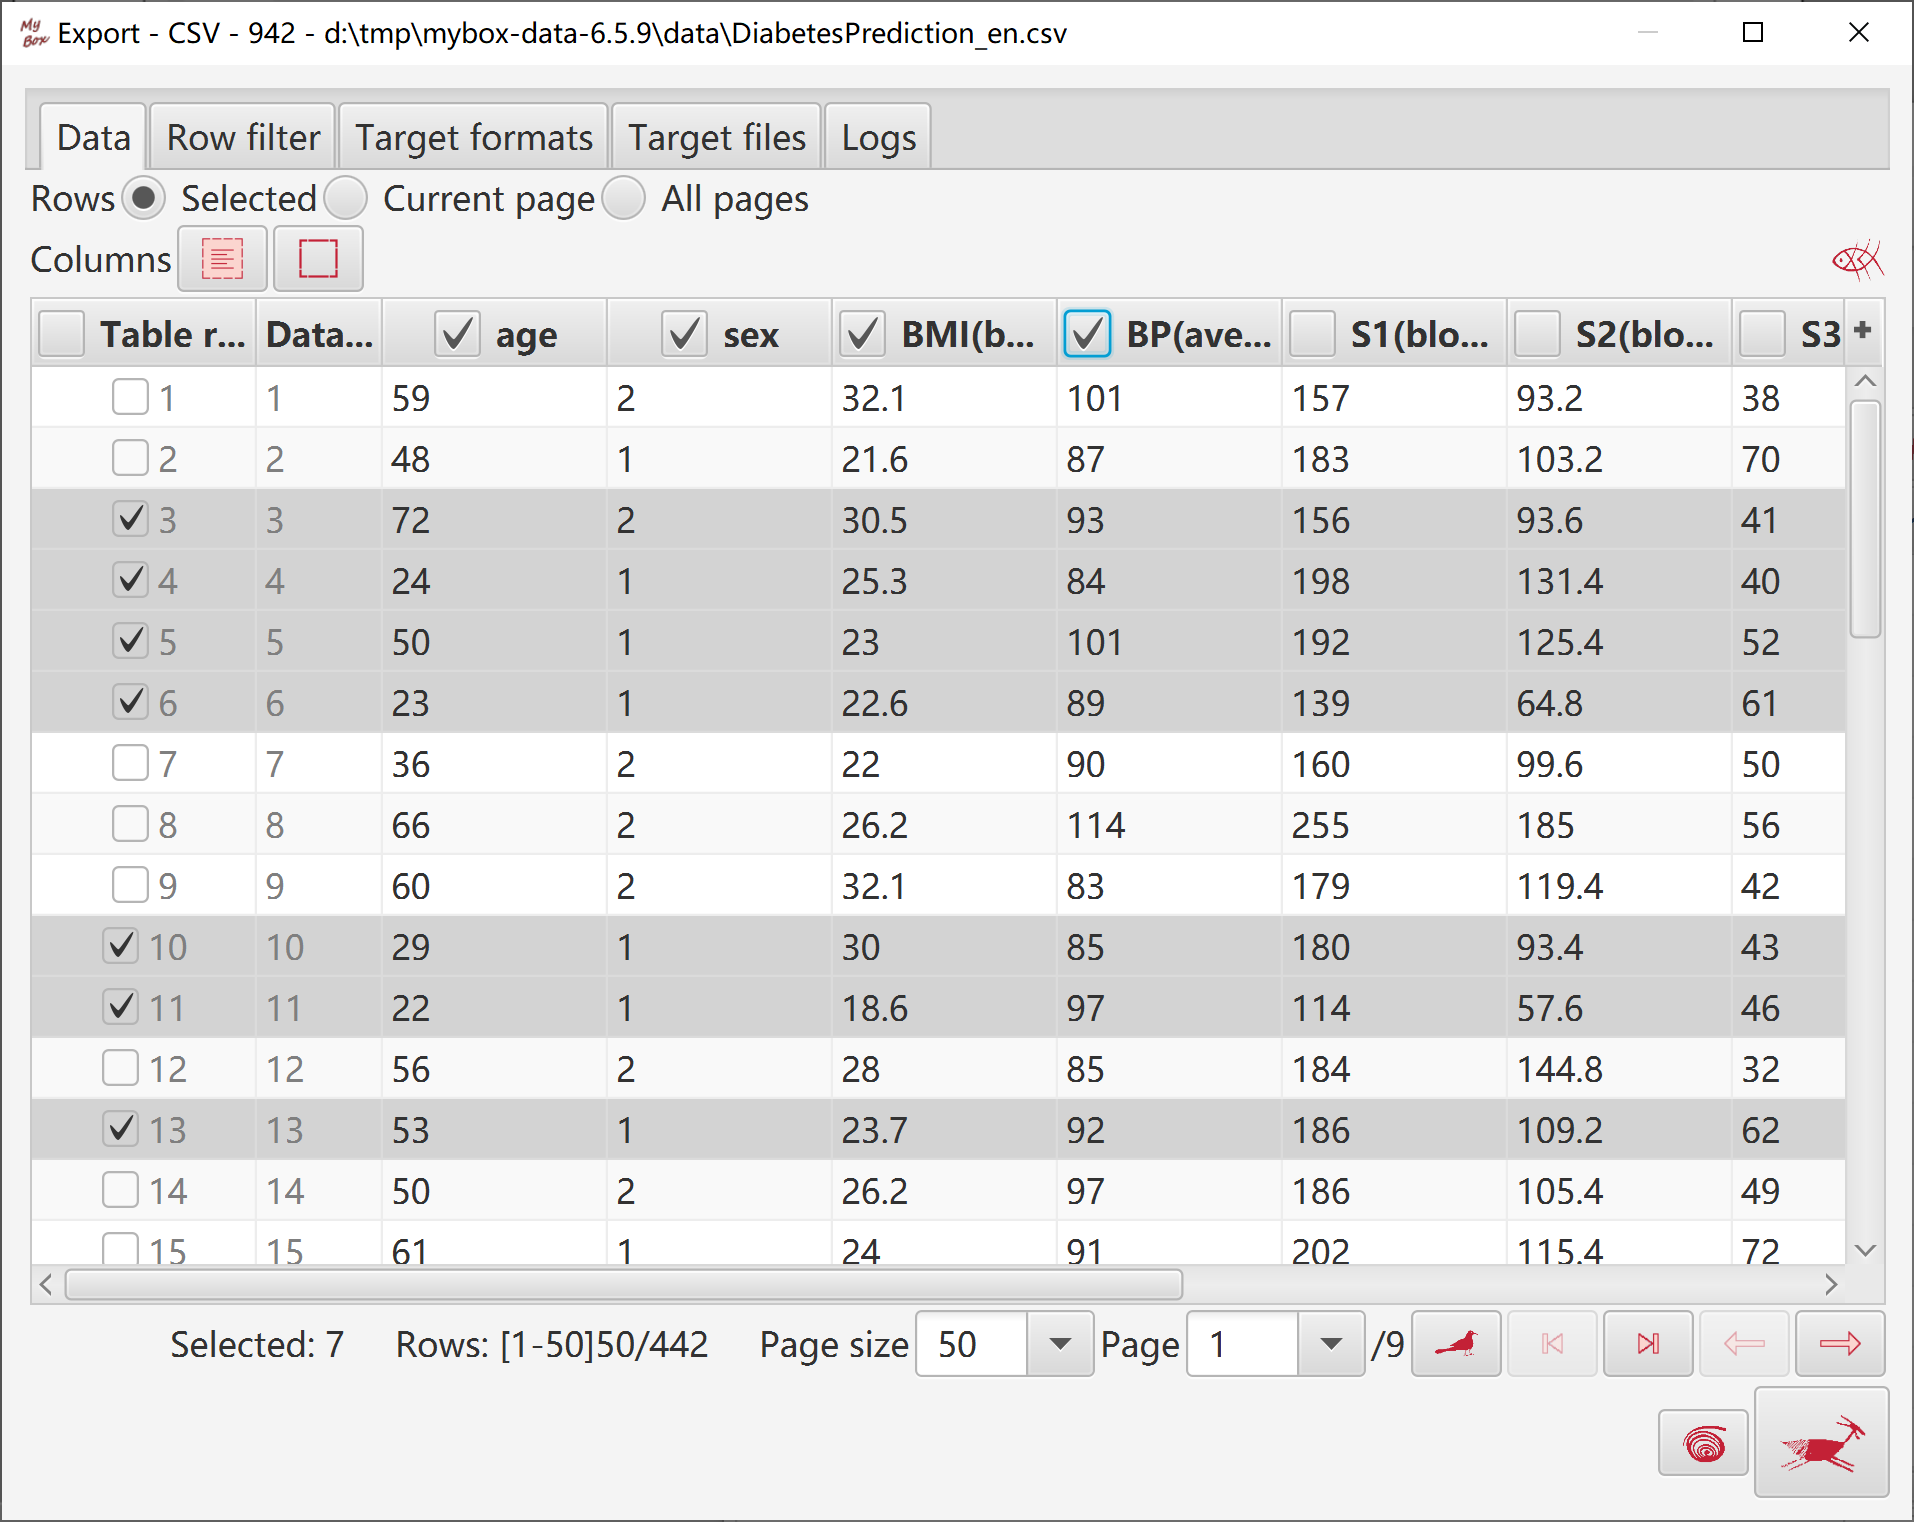
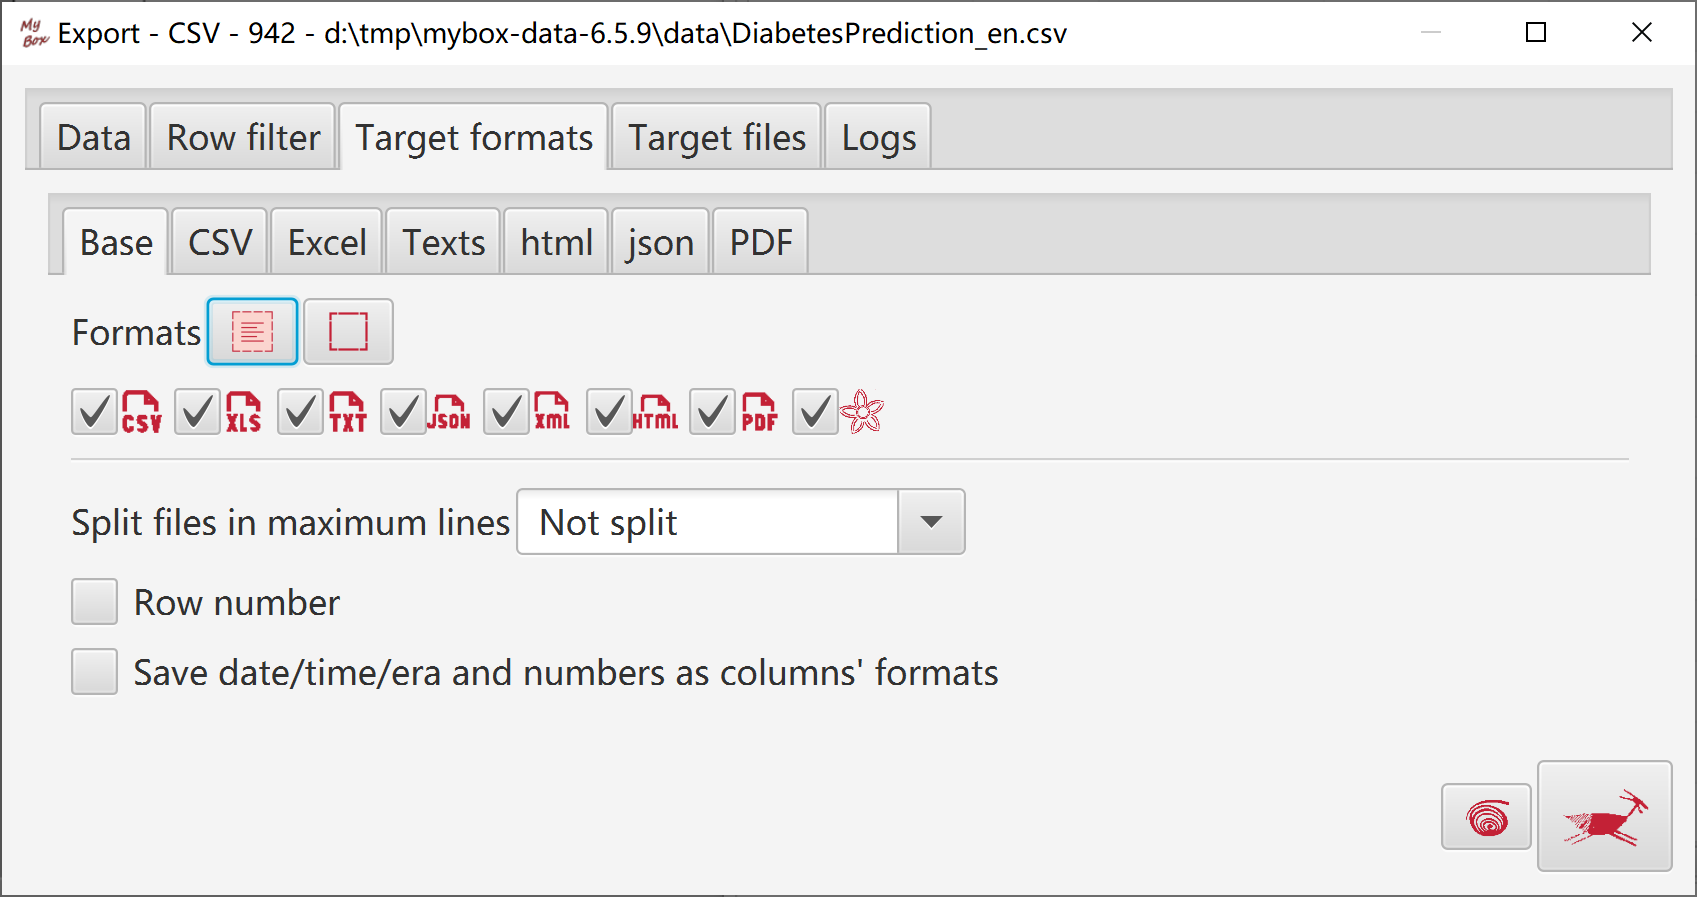
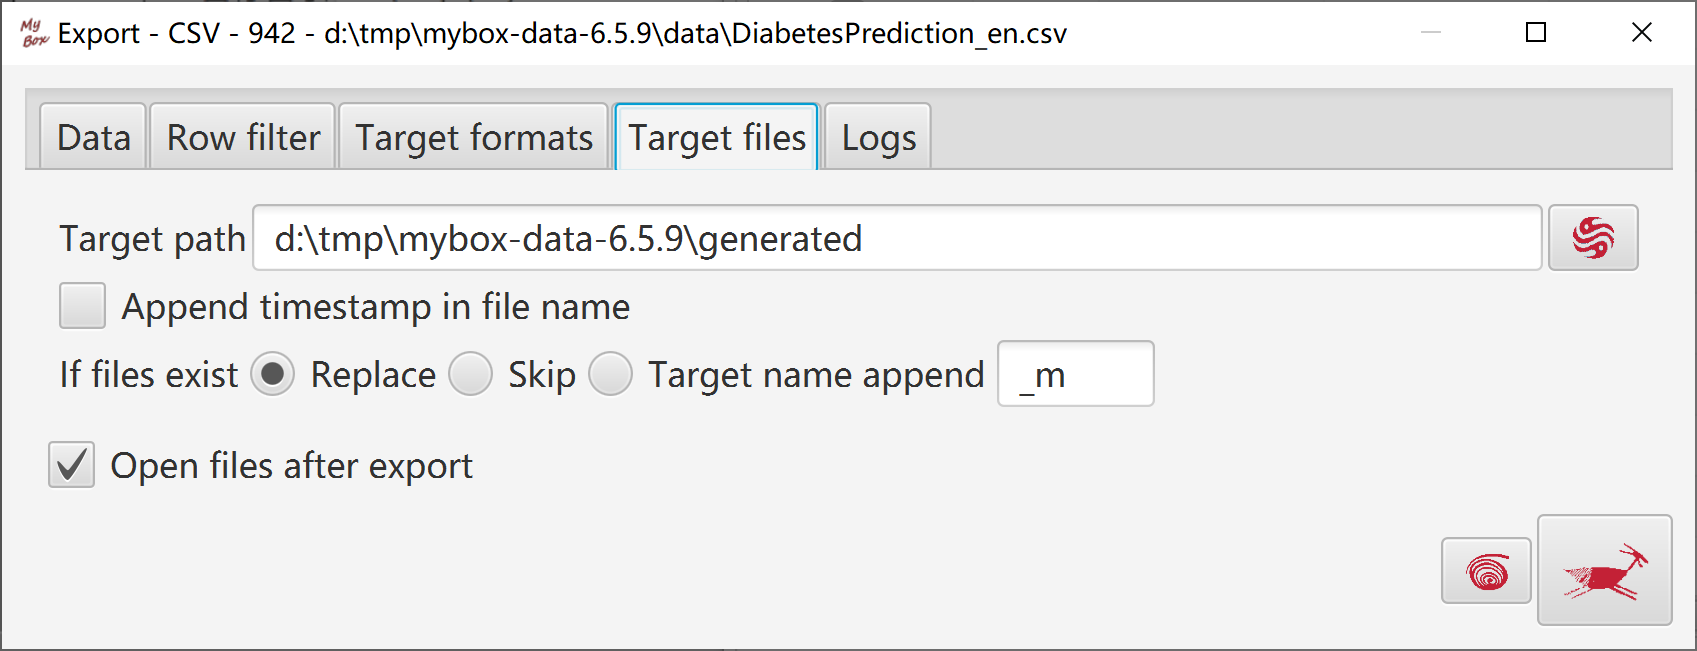
Select targets and their formats: csv, texts, excel, xml, json, html, pdf, MyBox Clipboard.
Set options of target files.
Split files in maximum lines.
Select whether include row numbers.
Select whether save date/time/era and numbers as columns' formats.
Set target path.
Select whether open files after export.
Select data rows. Data filter can be set.
Select columns to be copied.
Select whether import data.
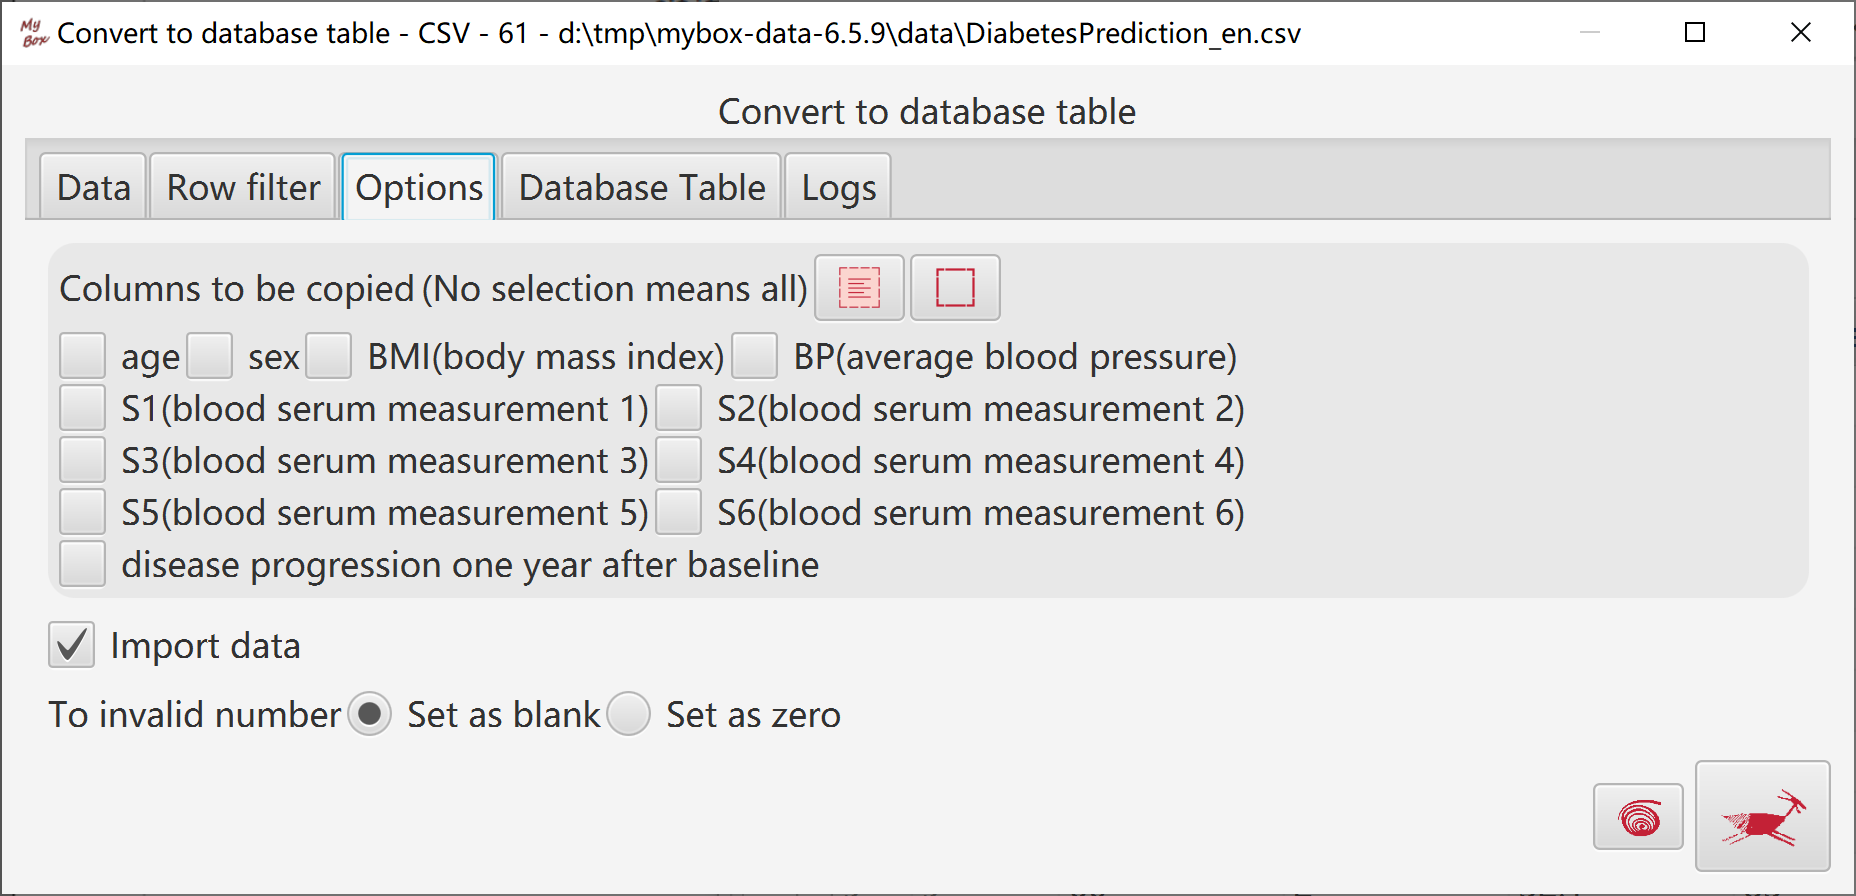
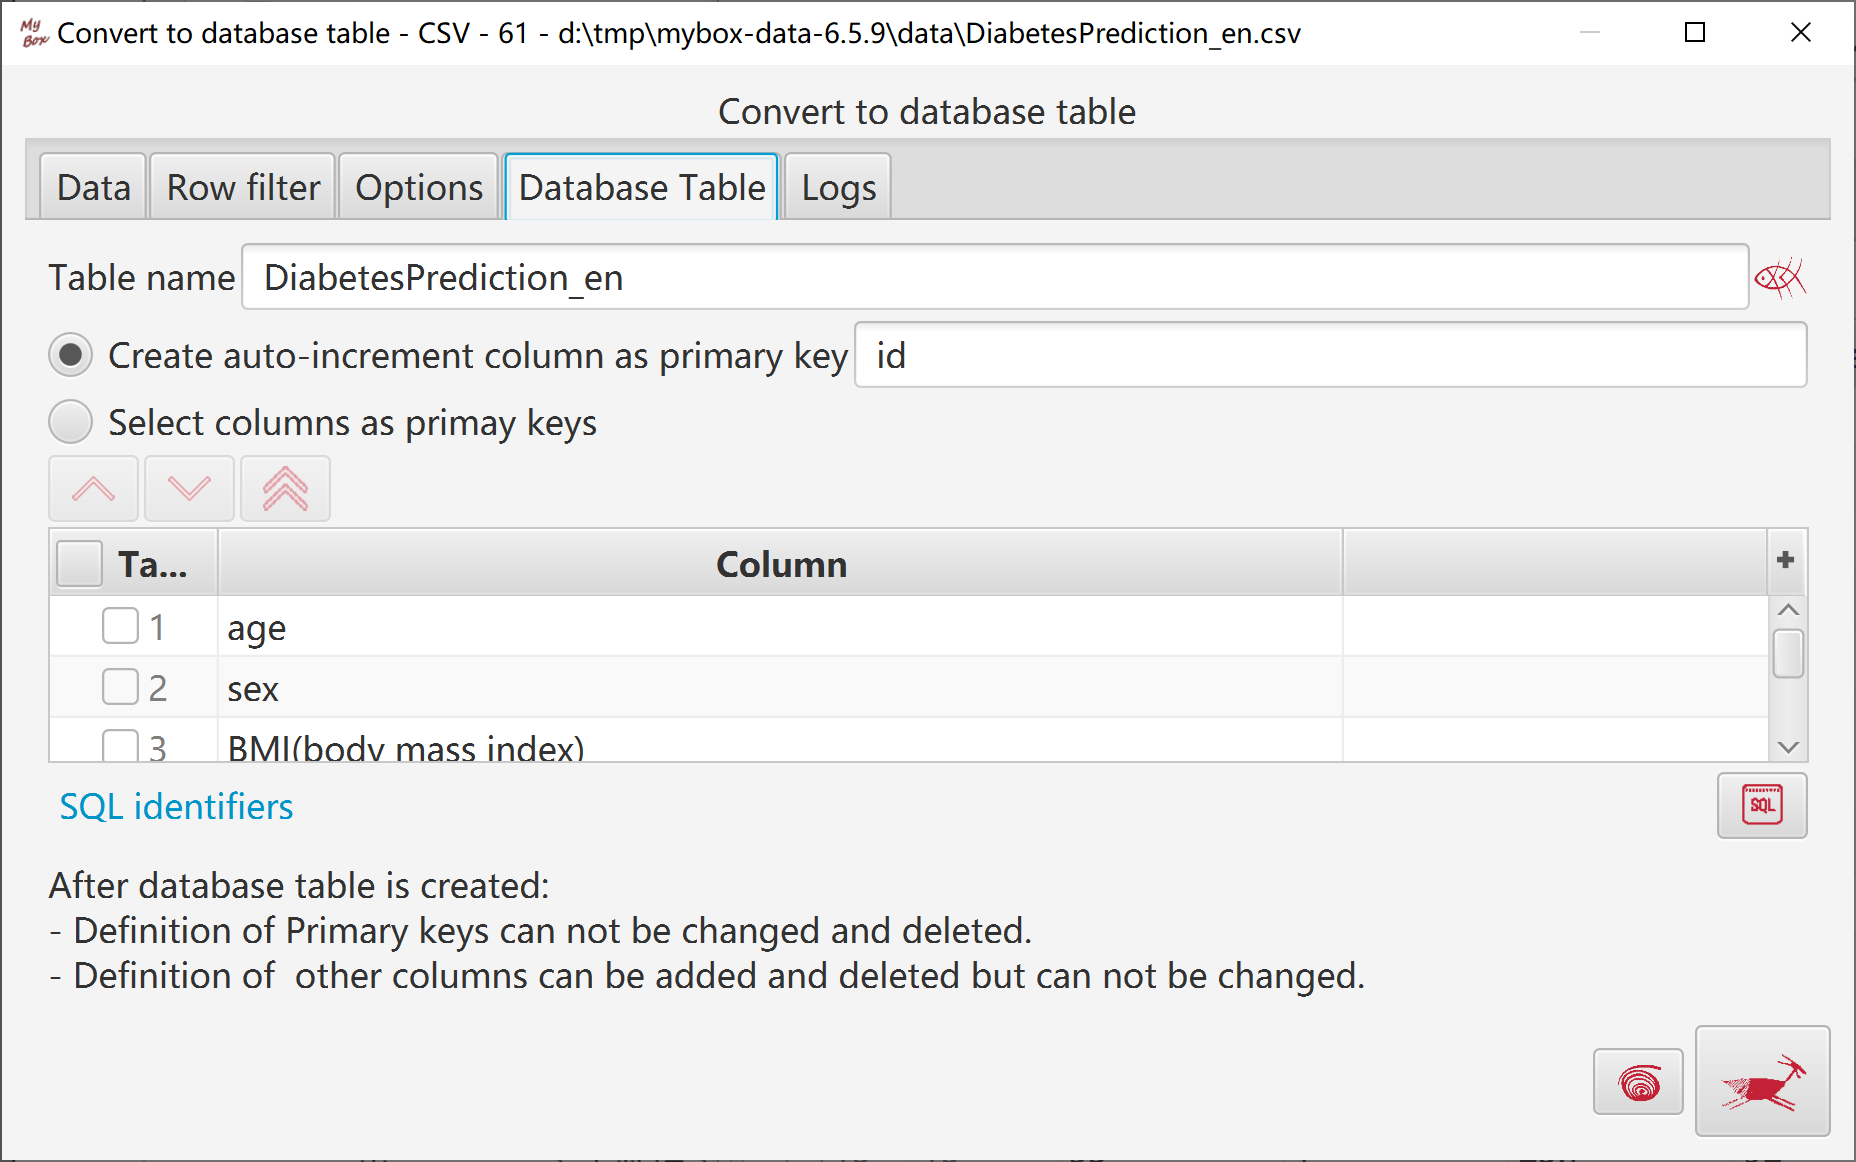
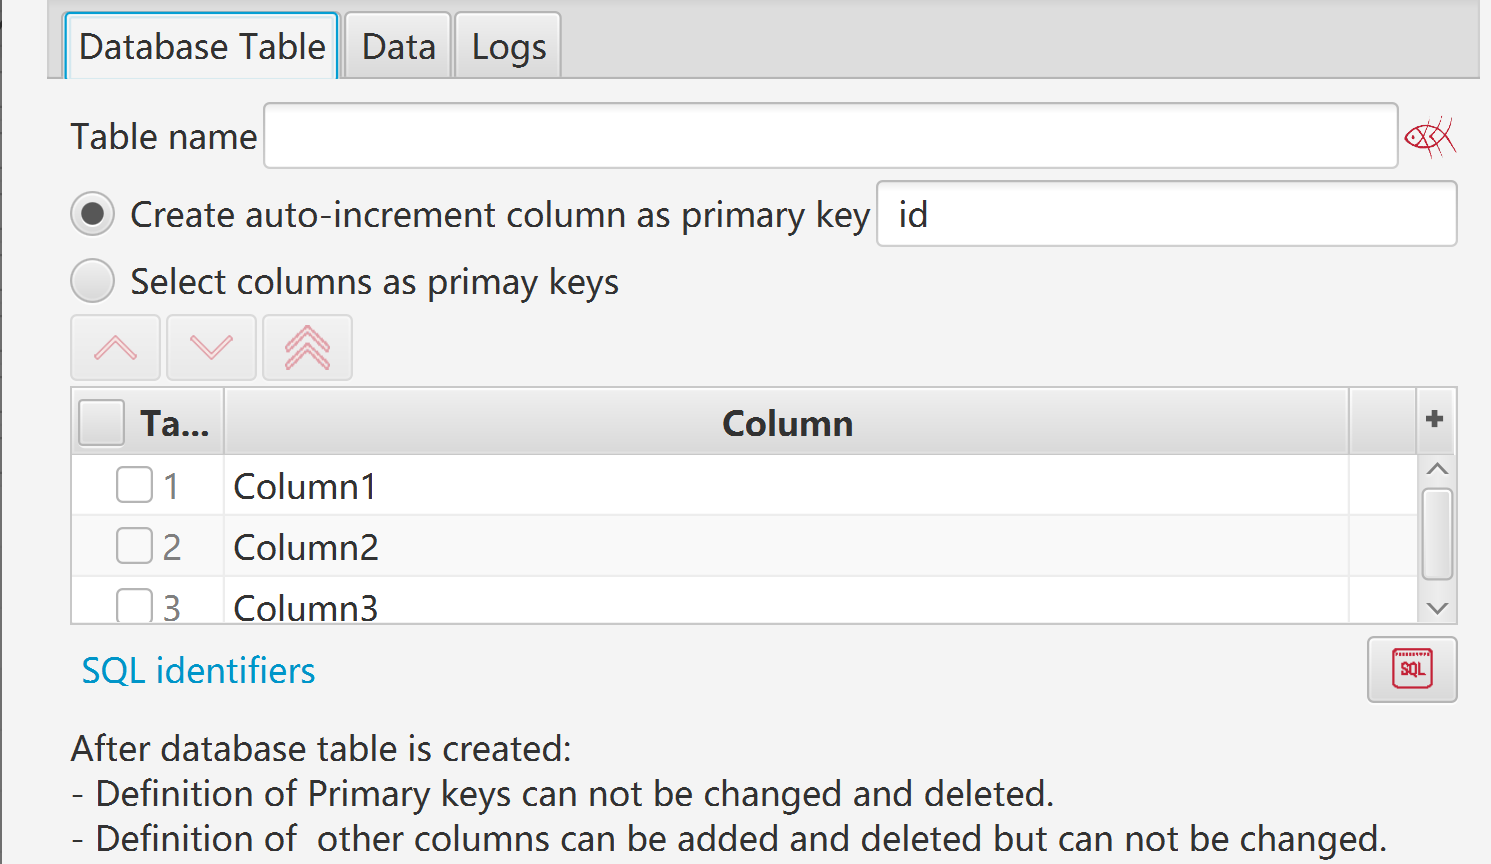
Create auto-increment column, or select some columns as primary key.
MyBox records definition of data objects in its internal table:
|
|
csv/excel/text files |
MyBox Clipboard |
Matrice |
Database tables |
|
Time to create data definition |
When data file is opened for the first time |
When data are copied in MyBox Clipboard |
When new matrix is saved in Matrices Manager |
When new table is saved in Database Table Manager |
|
Storage location of data |
Data file |
Files under MyBox internal path. |
Database table of MyBox |
Database tables of MyBox |
|
When delete data definition |
Data file is not affected |
Internal file is deleted |
Data of matrix are cleared |
Database table is dropped |
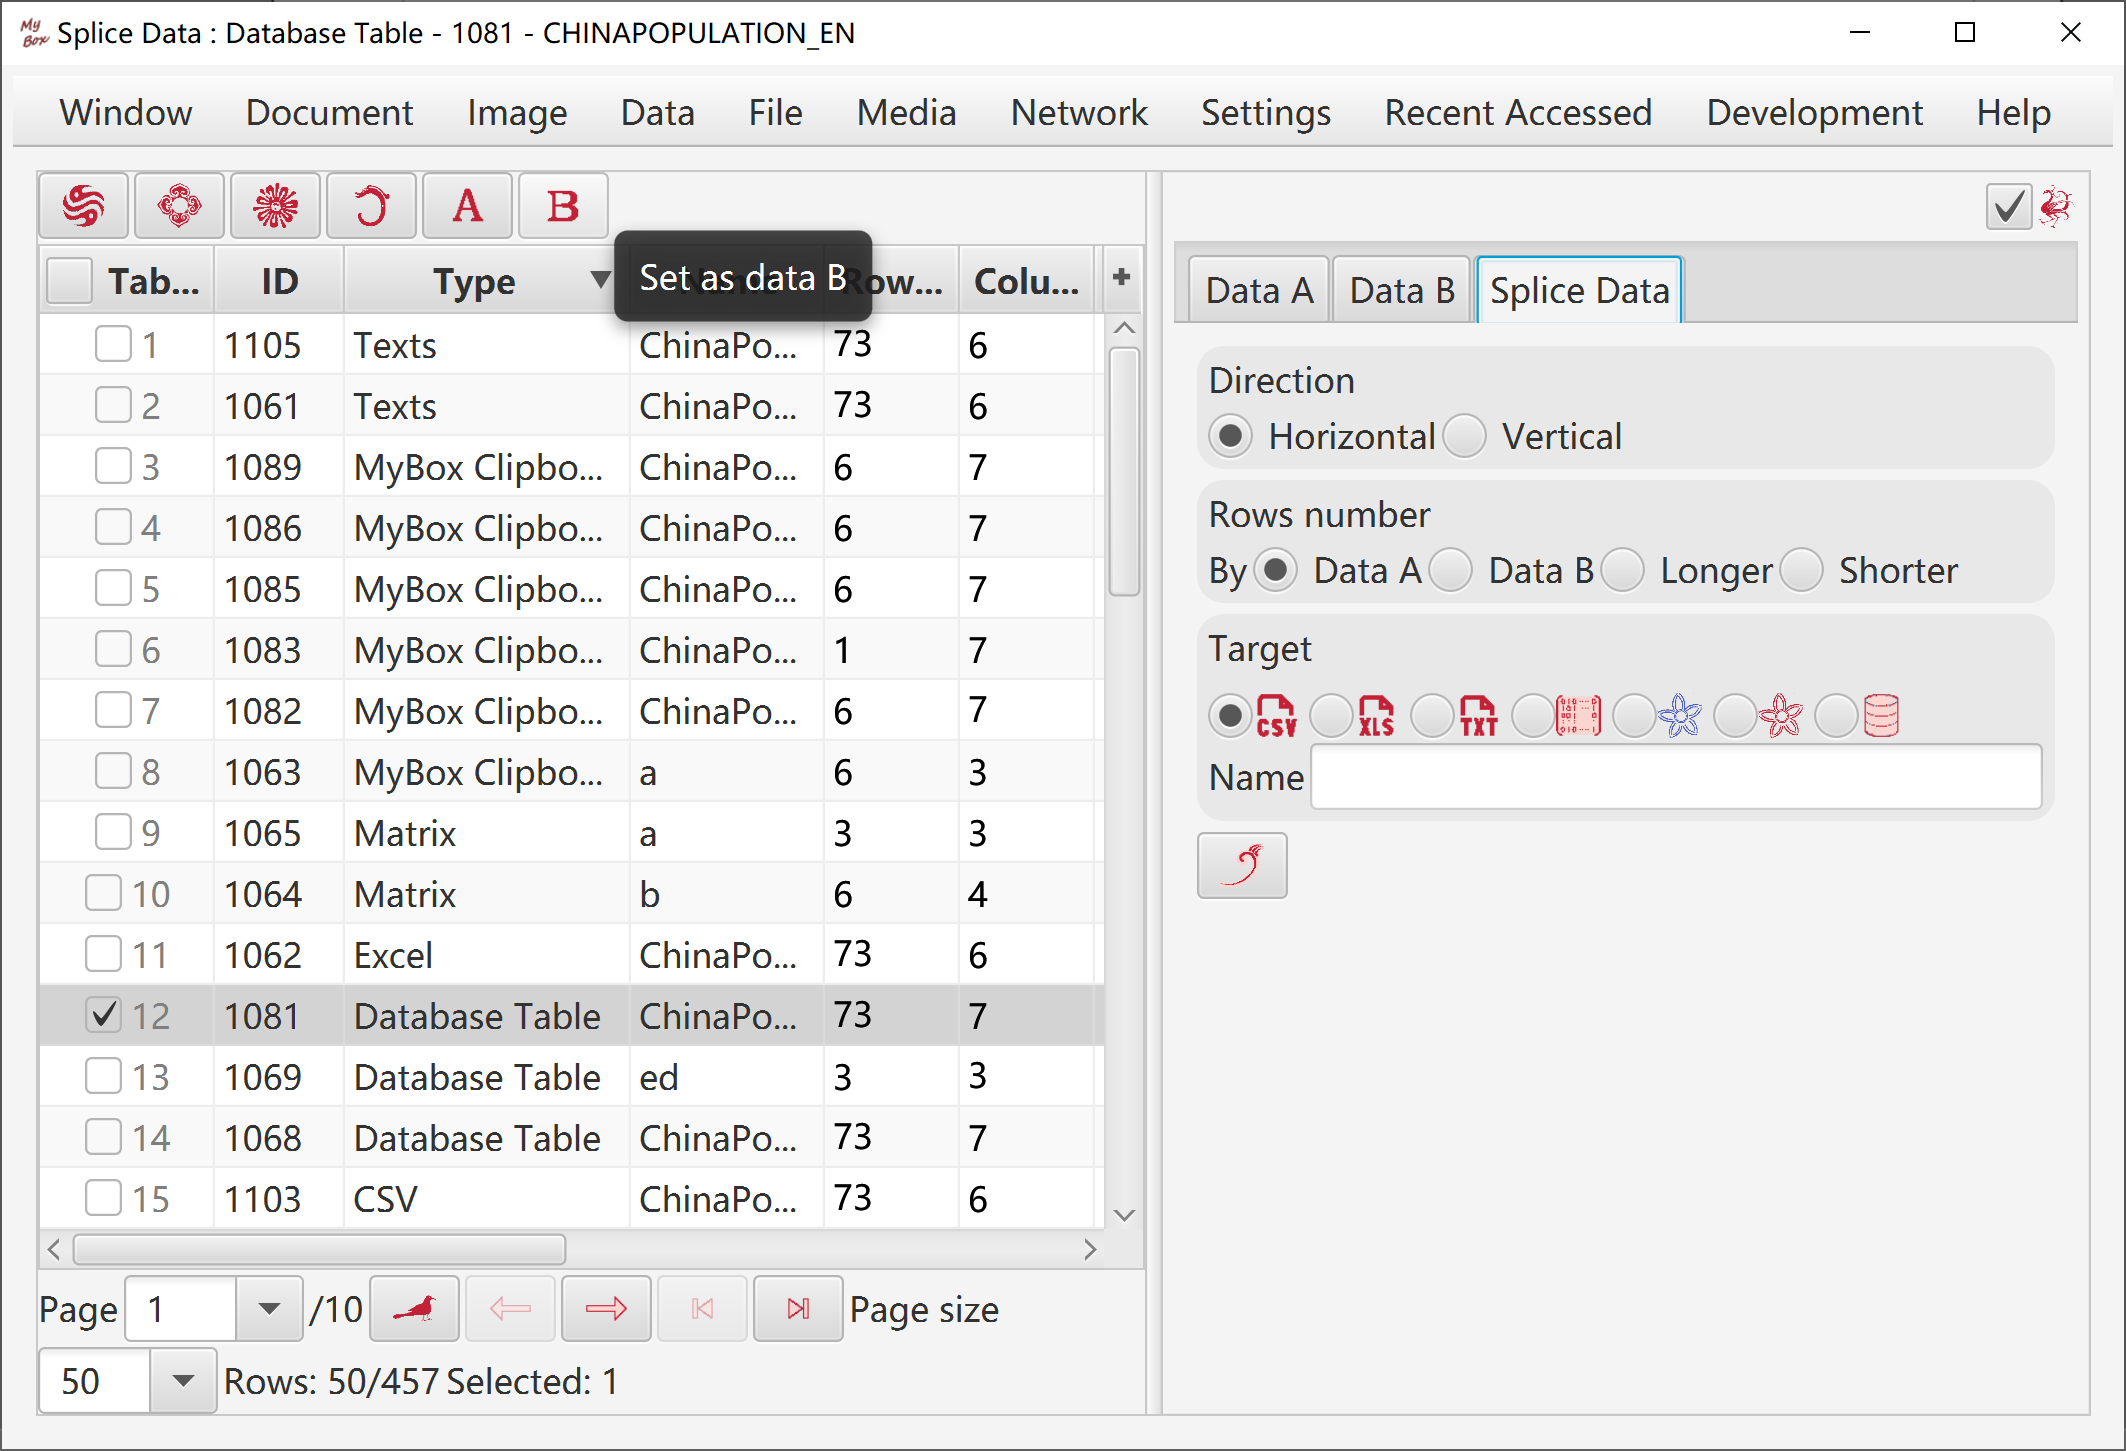
Select or open two data.
Select rows and columns from the two data:
Rows can be: current page, selected rows, or all pages.
Select columns. If no column is selected, then all columns are taken.
Set row filter.
Options:
Direction: vertical, horizontal
Rows/Columns number by: Data A, Data B, longer, shorter.
Target can be following: new csv/excel/text file, matrix, system clipboard, MyBox clipboard, database table.
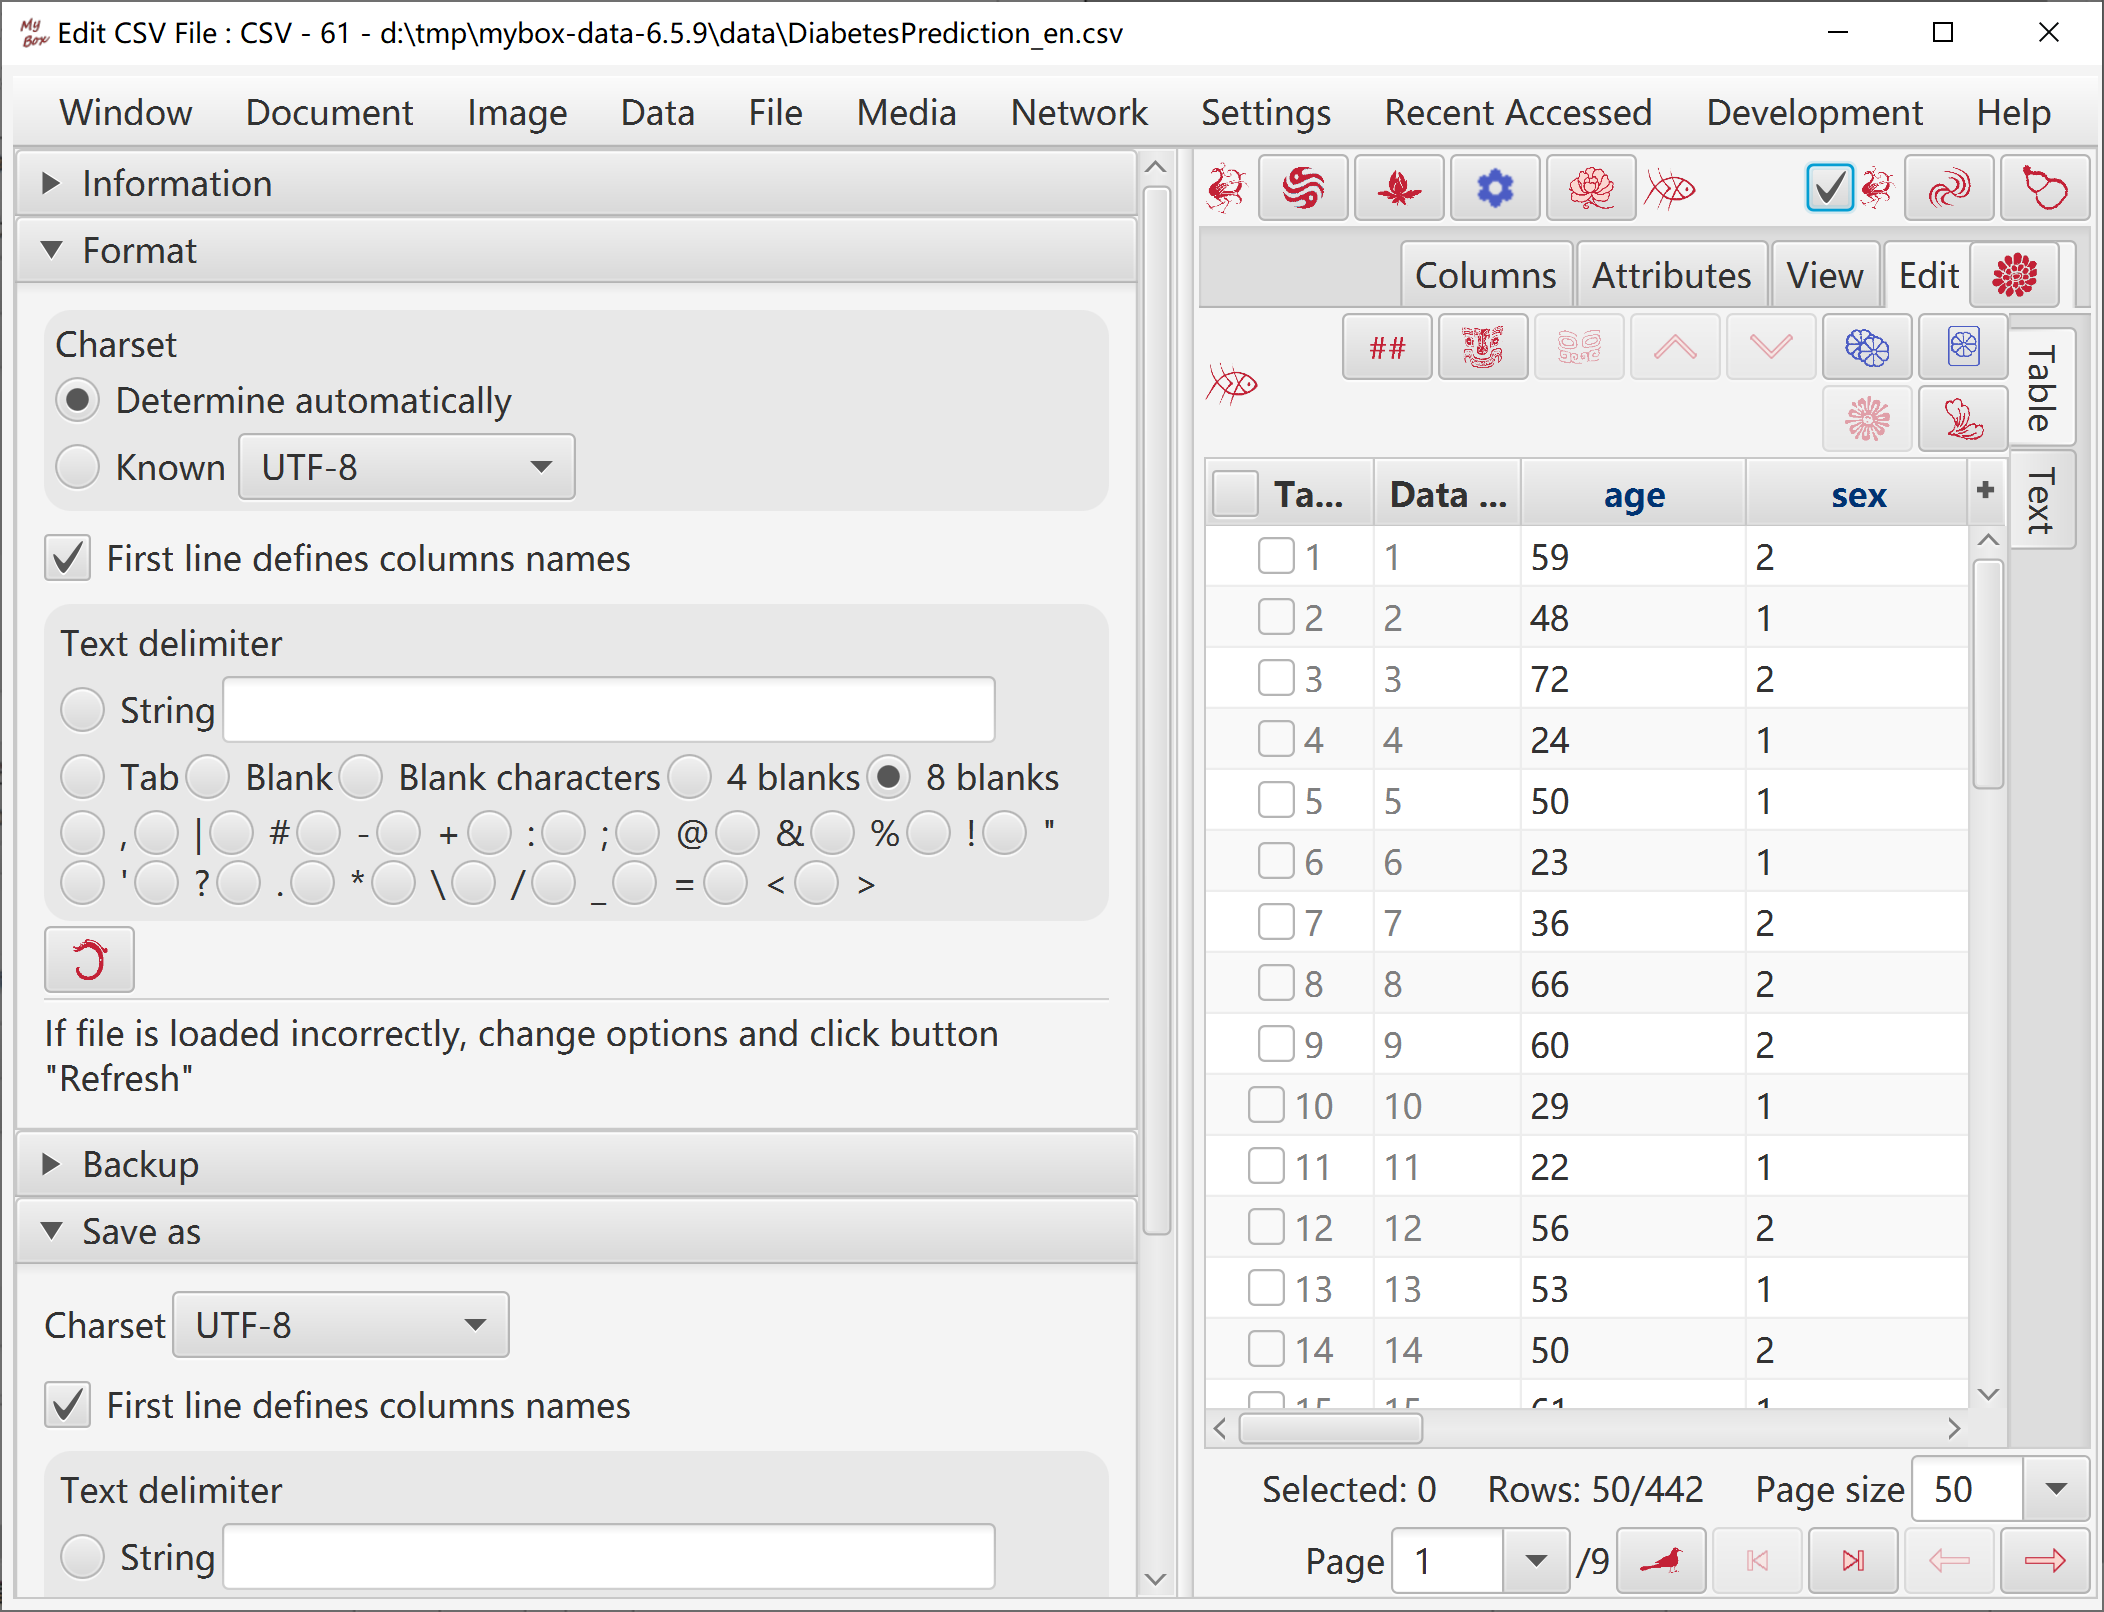
In the file:
In general, the first line(header) defines column names, and each of followed lines defines a row of data.
Values are separated by "delimiter" which can be string.
If a value contains delimiter or line break, it should be surrounded by quotes.
If delimeter is “#”, lines started with "#" are skipped and treated as comments.
When the file is opened for the first time, the tool guesses its delimiter and charset.
When file is loaded abnormally, change options and click Refresh button.
Data are paginated. When pages number is larger than 1, changes should be saved before run some functions.
Options: charset, whether has first line as field names, and delimiter of data.
To string values, multiple lines can be edited and saved.
Data can be saved as different charsets and delimiters.
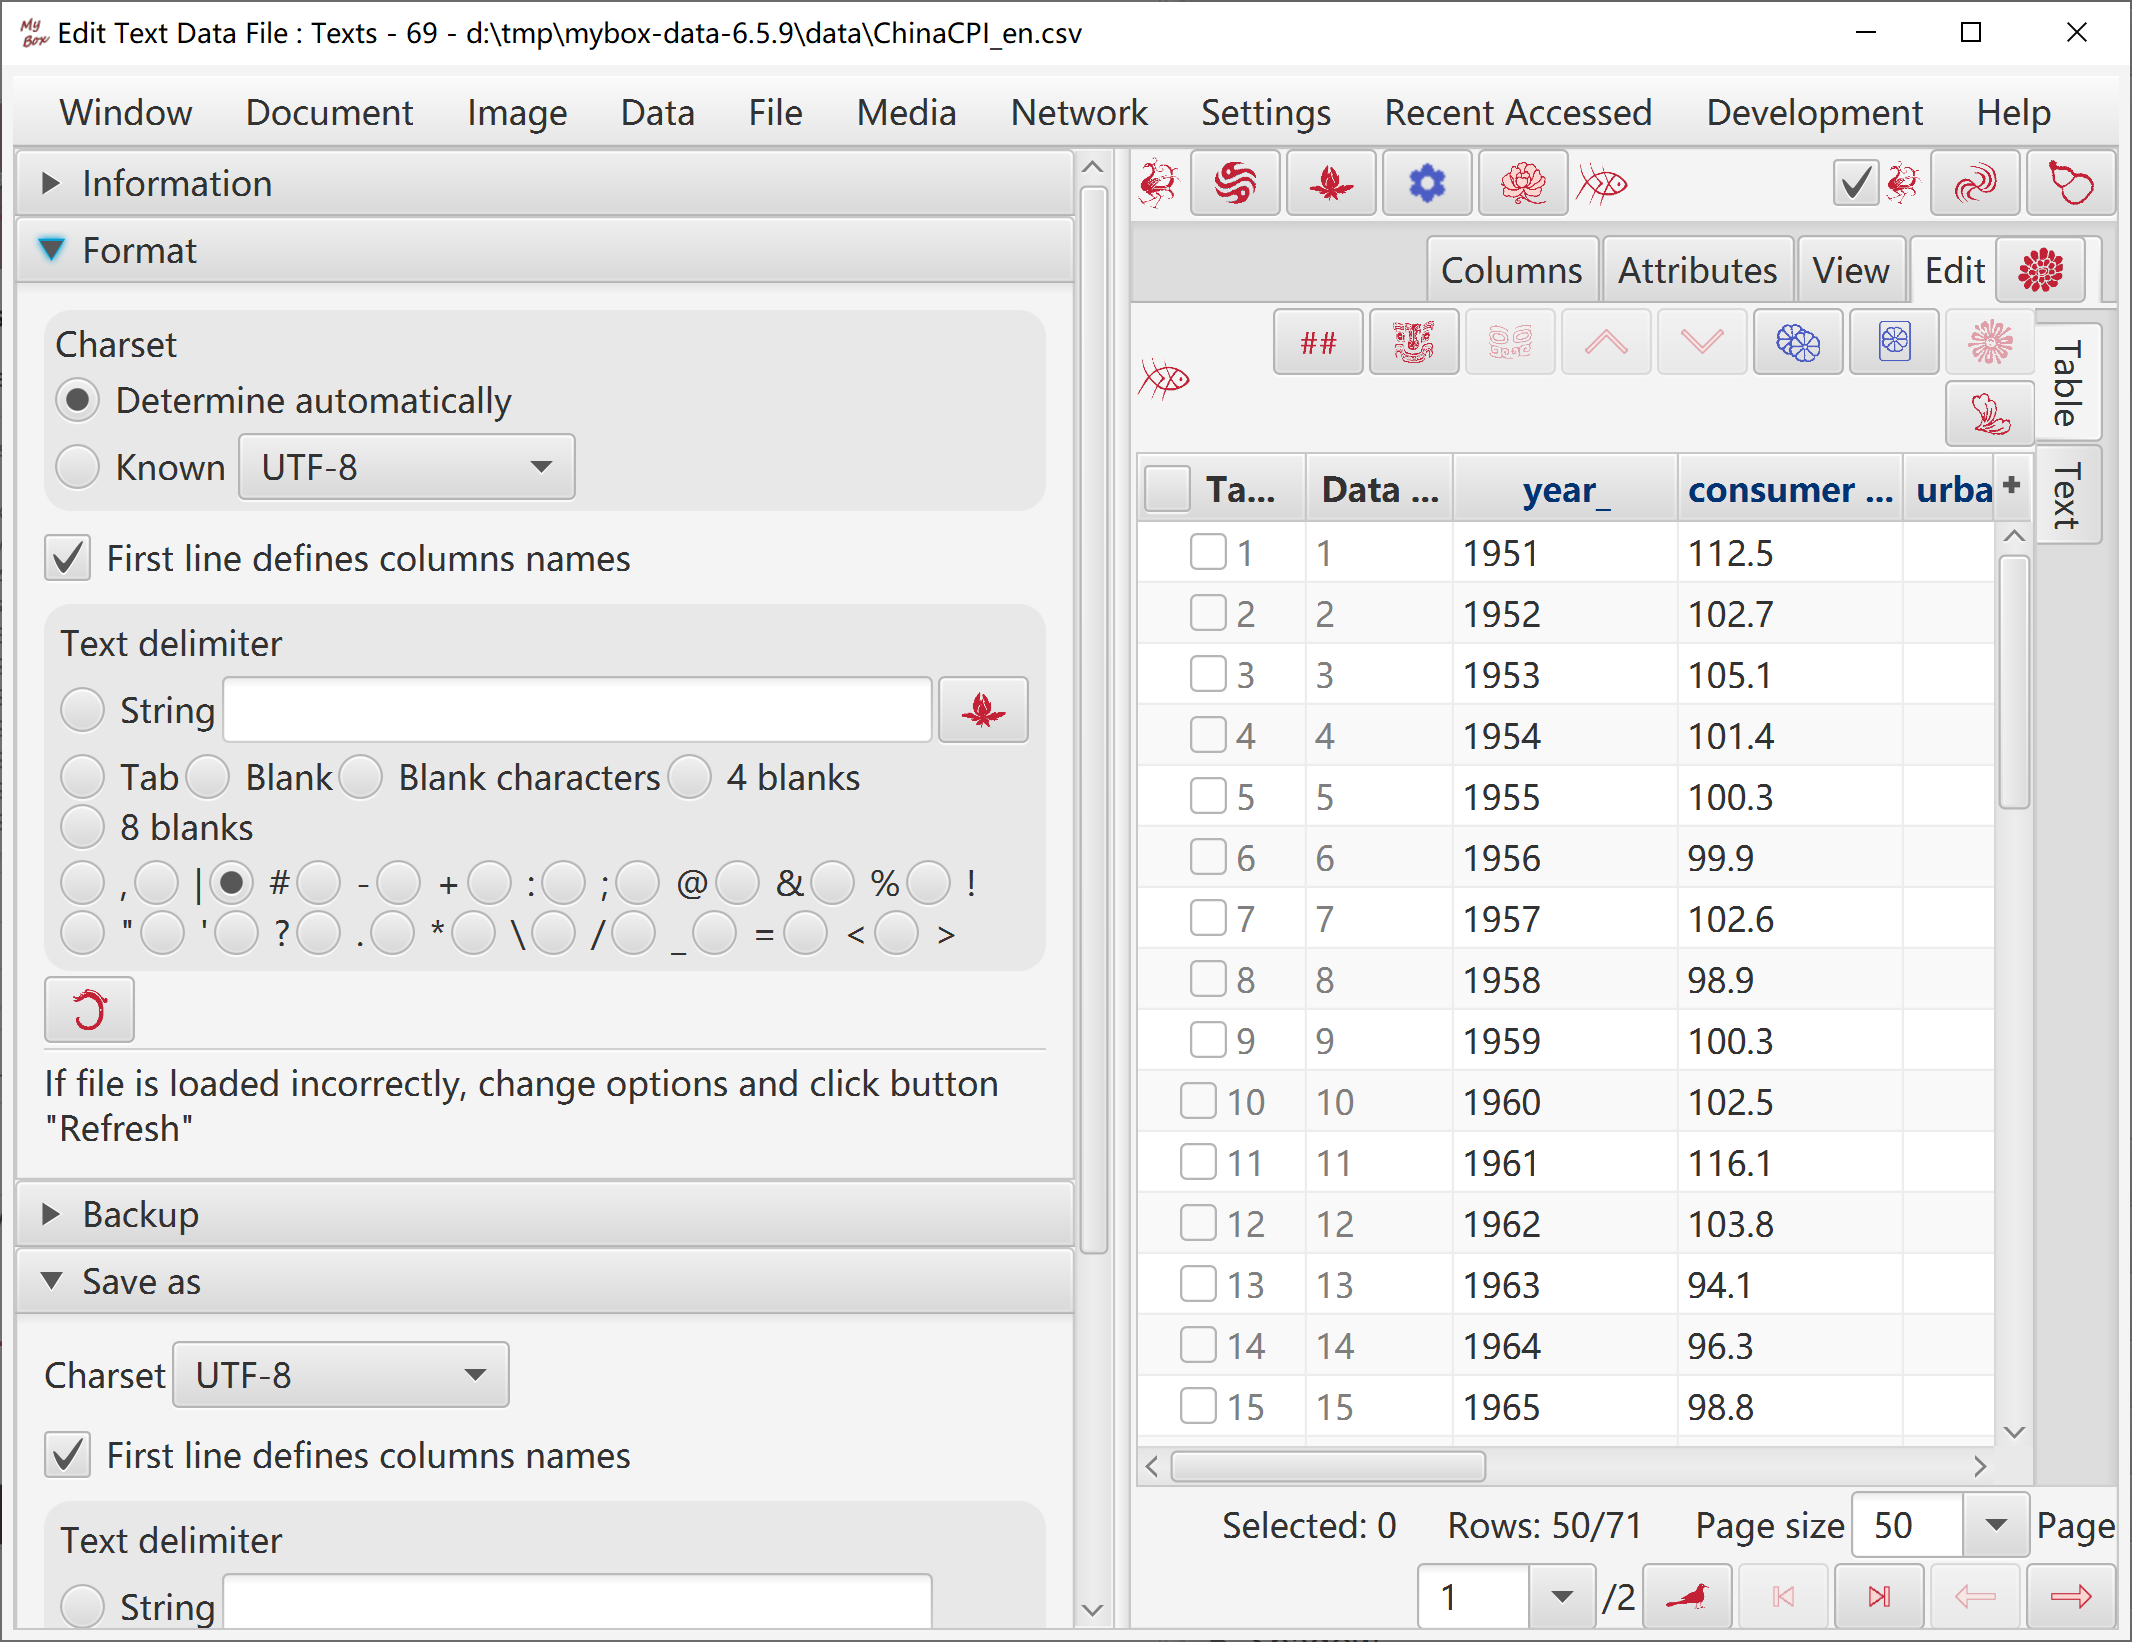
In the file:
In general, the first line(header) defines column names, and each of followed lines defines a row of data.
Values are separated by "delimiter" which can be string.
Regular expression is supported when parse the file.
Values should not contain delimiter.
If a line starts with "#", it will be skipped.
When the file is opened for the first time, the tool guesses its delimiter and charset.
When file is loaded abnormally, change options and click Refresh button.
Data are paginated. When pages number is larger than 1, changes should be saved before run some functions.
Options: charset, whether has first line as field names, and delimiter of data.
Not support multiple lines in values.
Data can be saved as different charsets and delimiters.
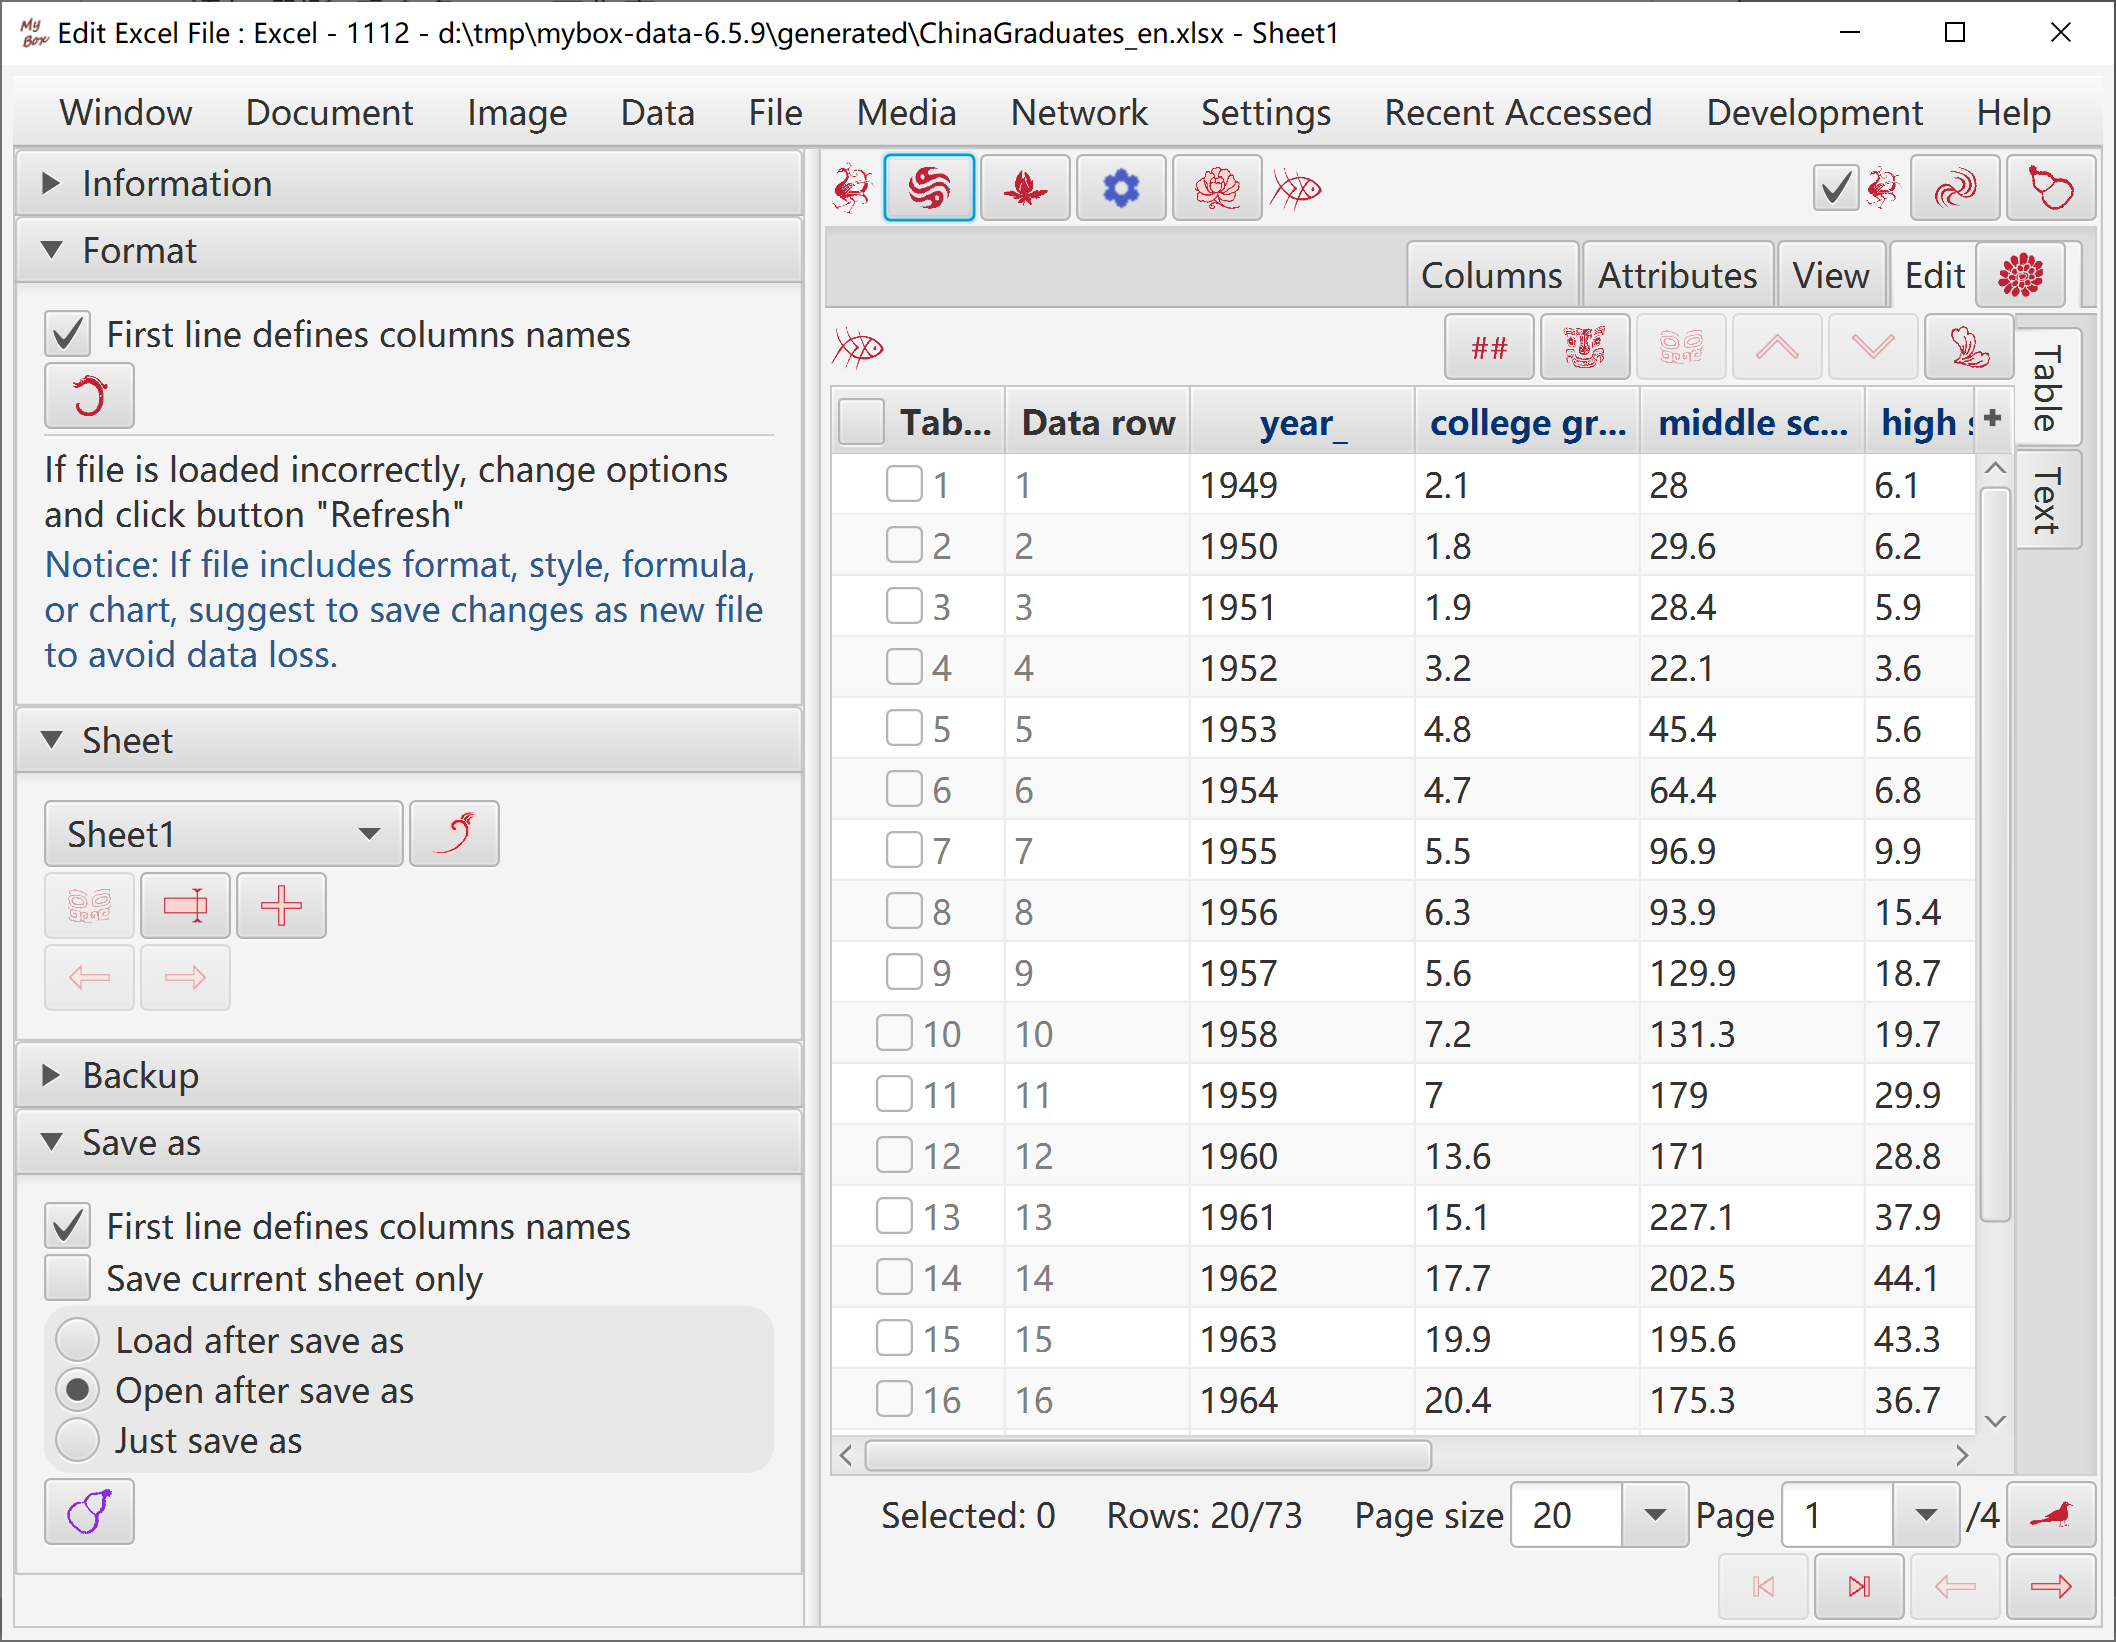
Choose one worksheet to handle.
Worksheets can be added/renamed/deleted.
In general, the first line(header) defines column names, and each of followed lines defines a row of data.
If file is read abnormally, change options and click button "Refresh".
Data are paginated. When pages number is larger than 1, changes should be saved before run some functions.
To string values, multiple lines can be edited and saved.
Data can be saved with current sheet only or all worksheets.
Notice: Tool can only handle base data in Excel file.
If file includes format, style, formula, or chart, suggest to save changes as new file to avoid data loss.
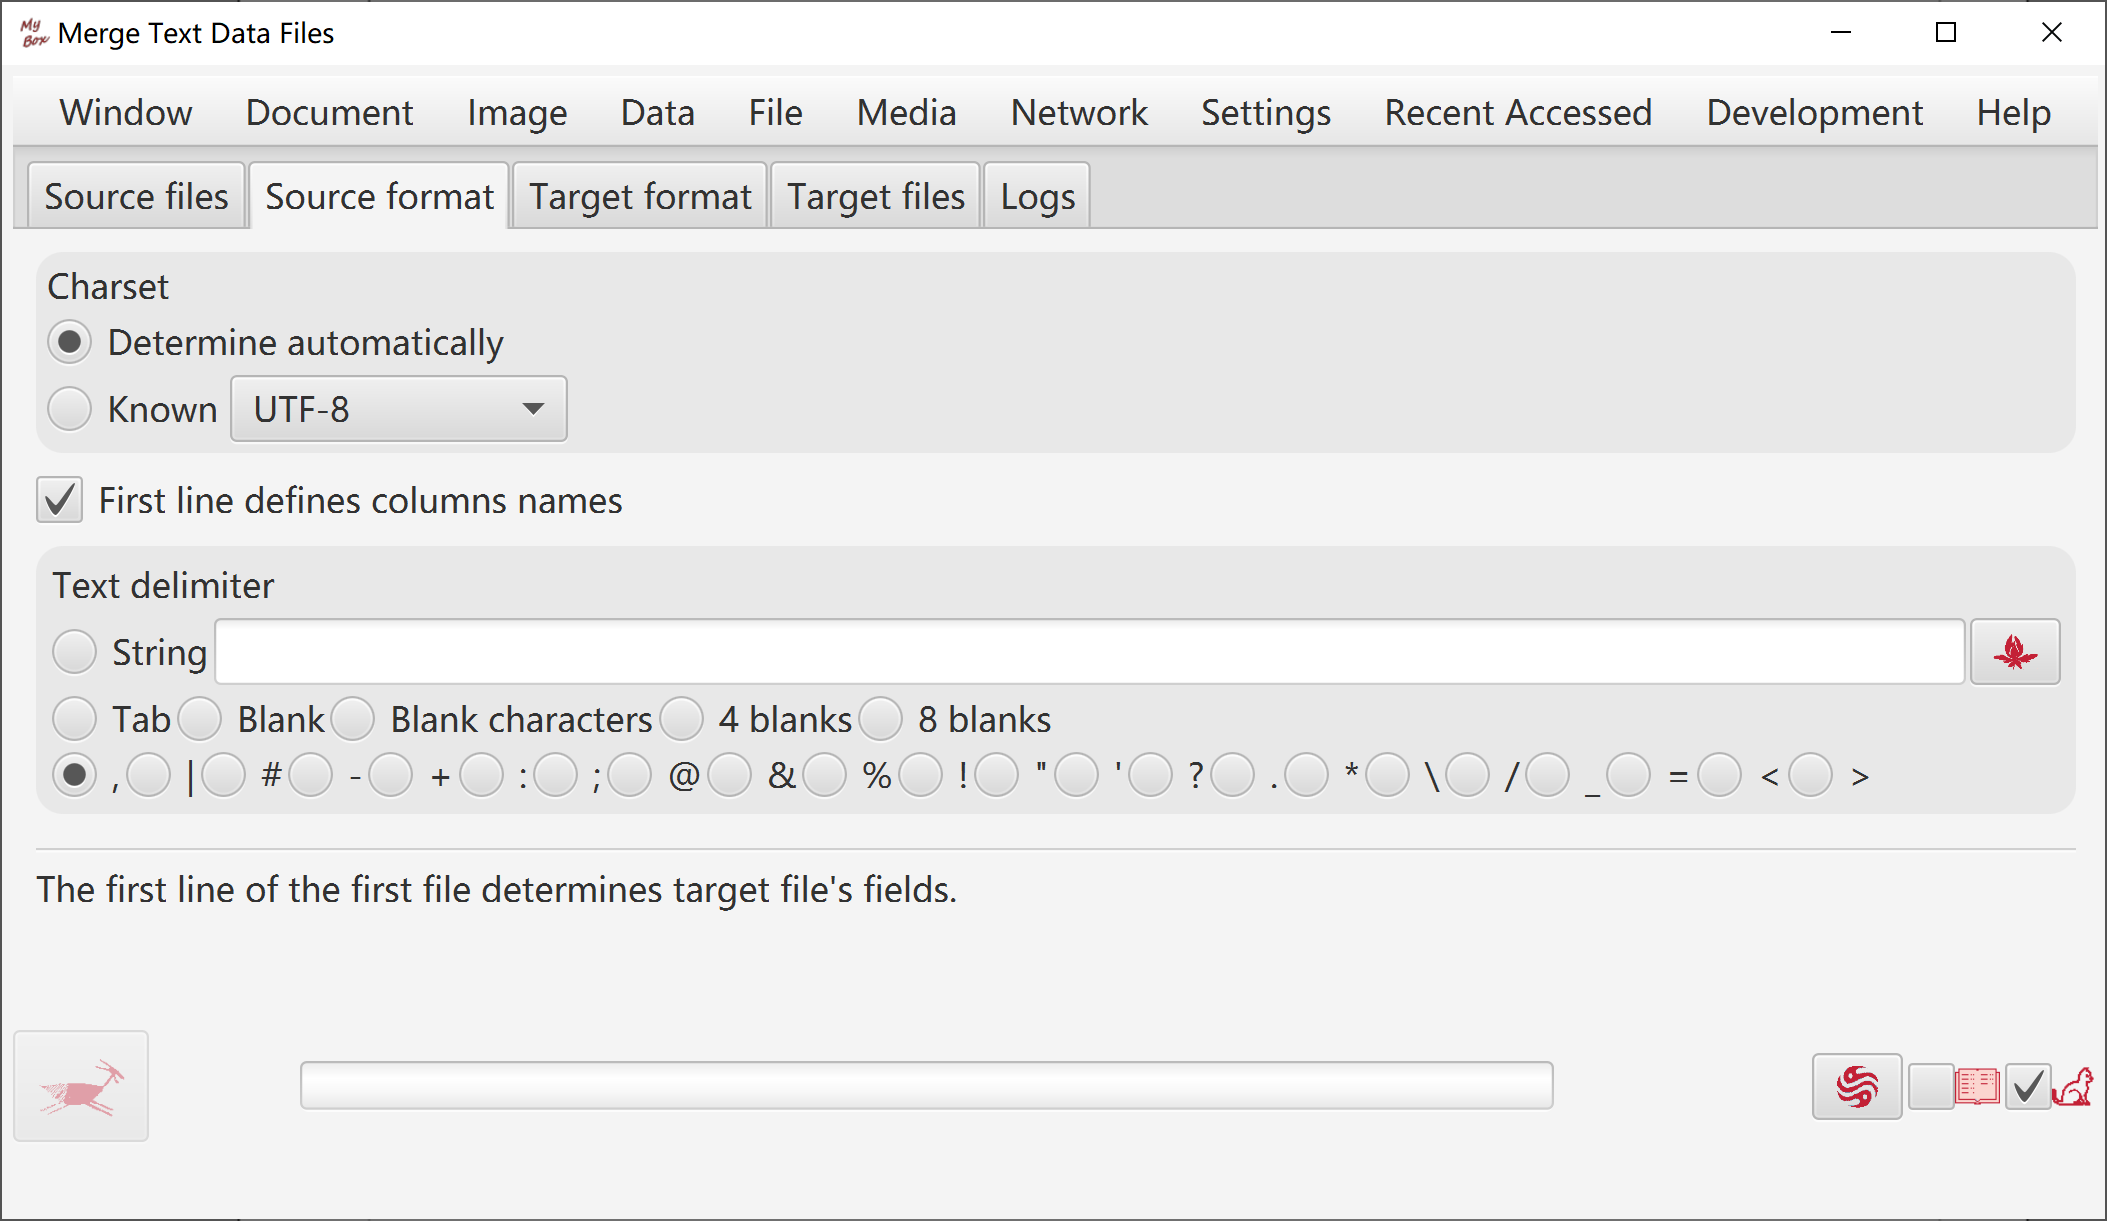
Source files' formats can be csv, excel, and text. Options of source files can be set.
Target files' formats include csv, text, excel, xml, json, html, pdf. Options of target files can be set.
Split files as maximum lines.
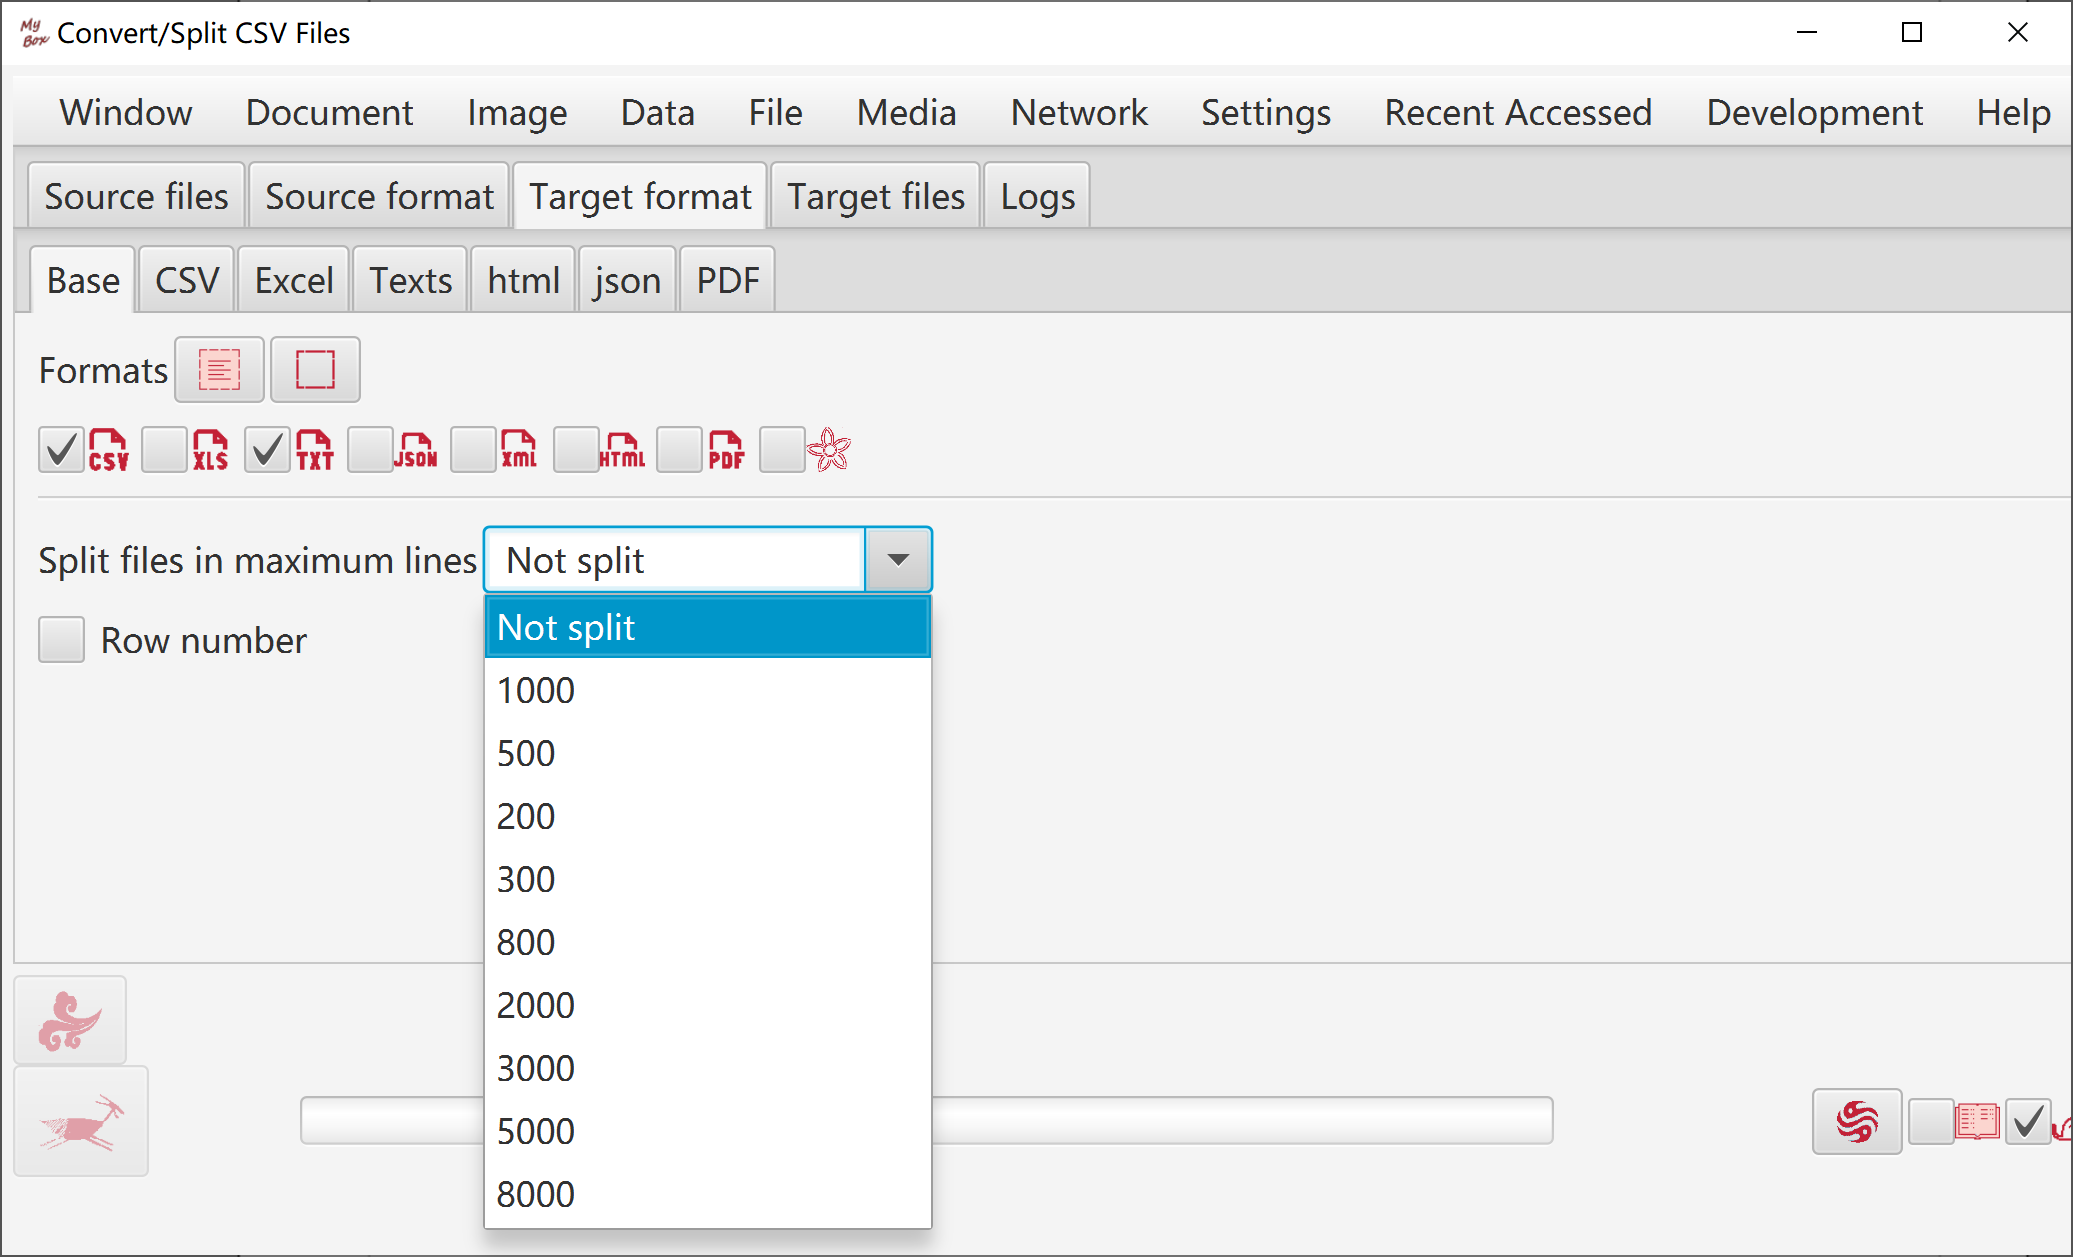
Set source format.
Set target format.
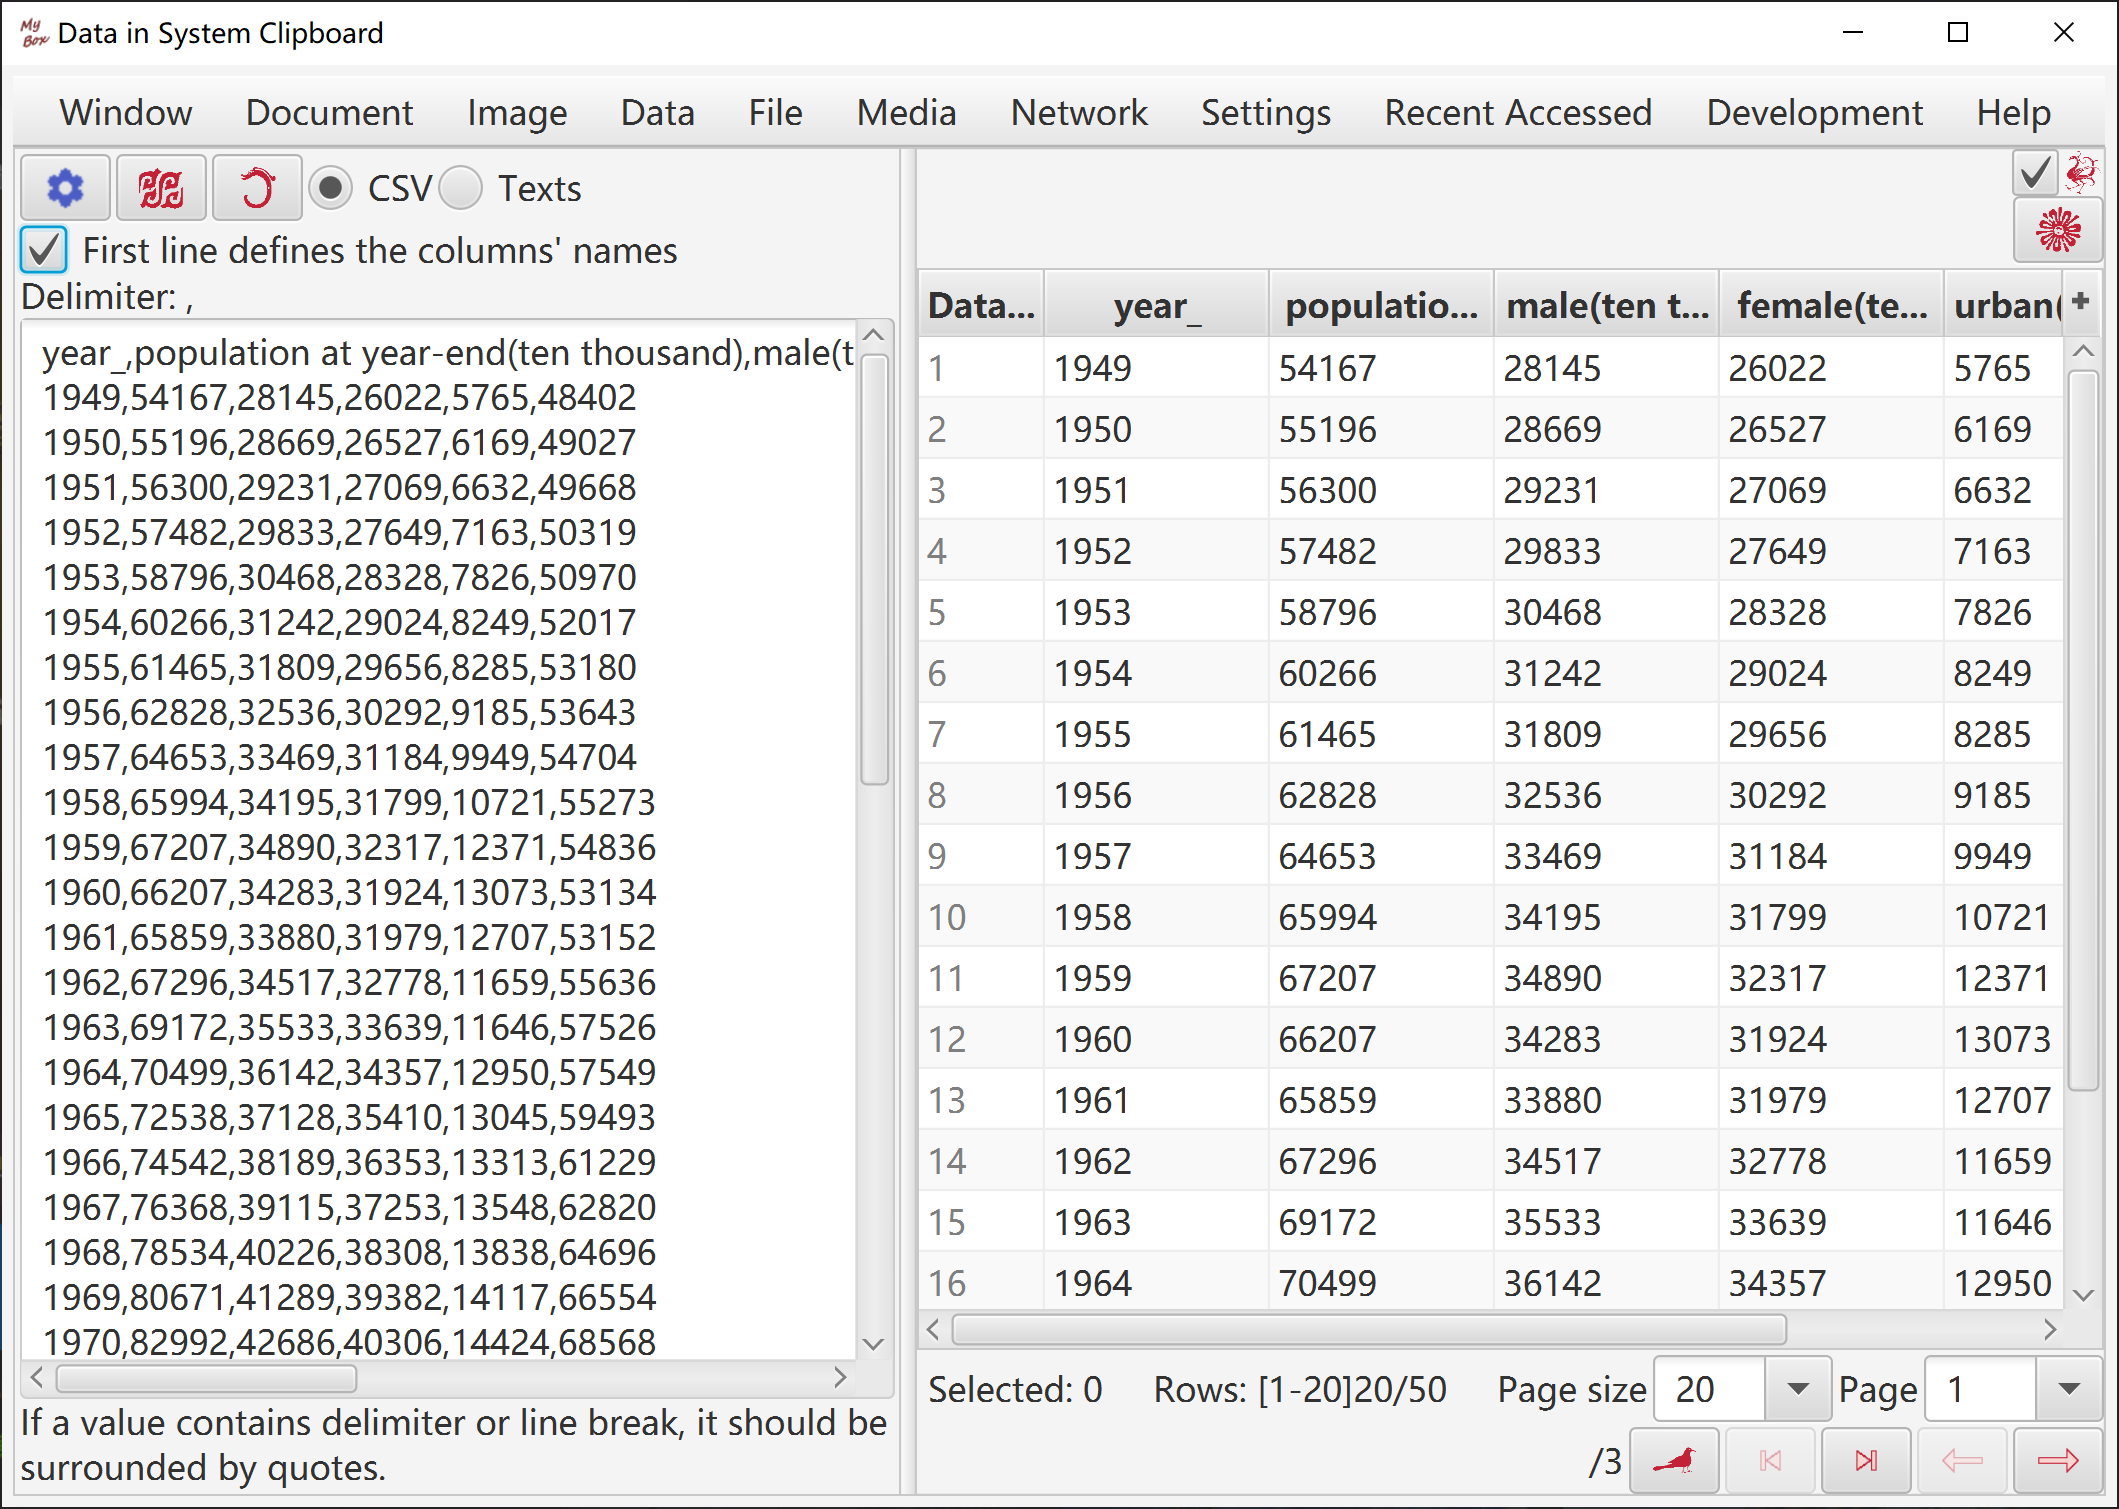
Read contents in System Clipboard.
Guess delimeter and parse data.
User can select a delimeter to parse data.
Select how to parse:
CSV parser: Values can contain delimeter and line break. But not support parsing “Blanks” and “Regular Expression”.
Text parser: Values can not contain delimeter and line break. Support parsing “Blanks” and “Regular Expression”.
Select whether first line defines column names.
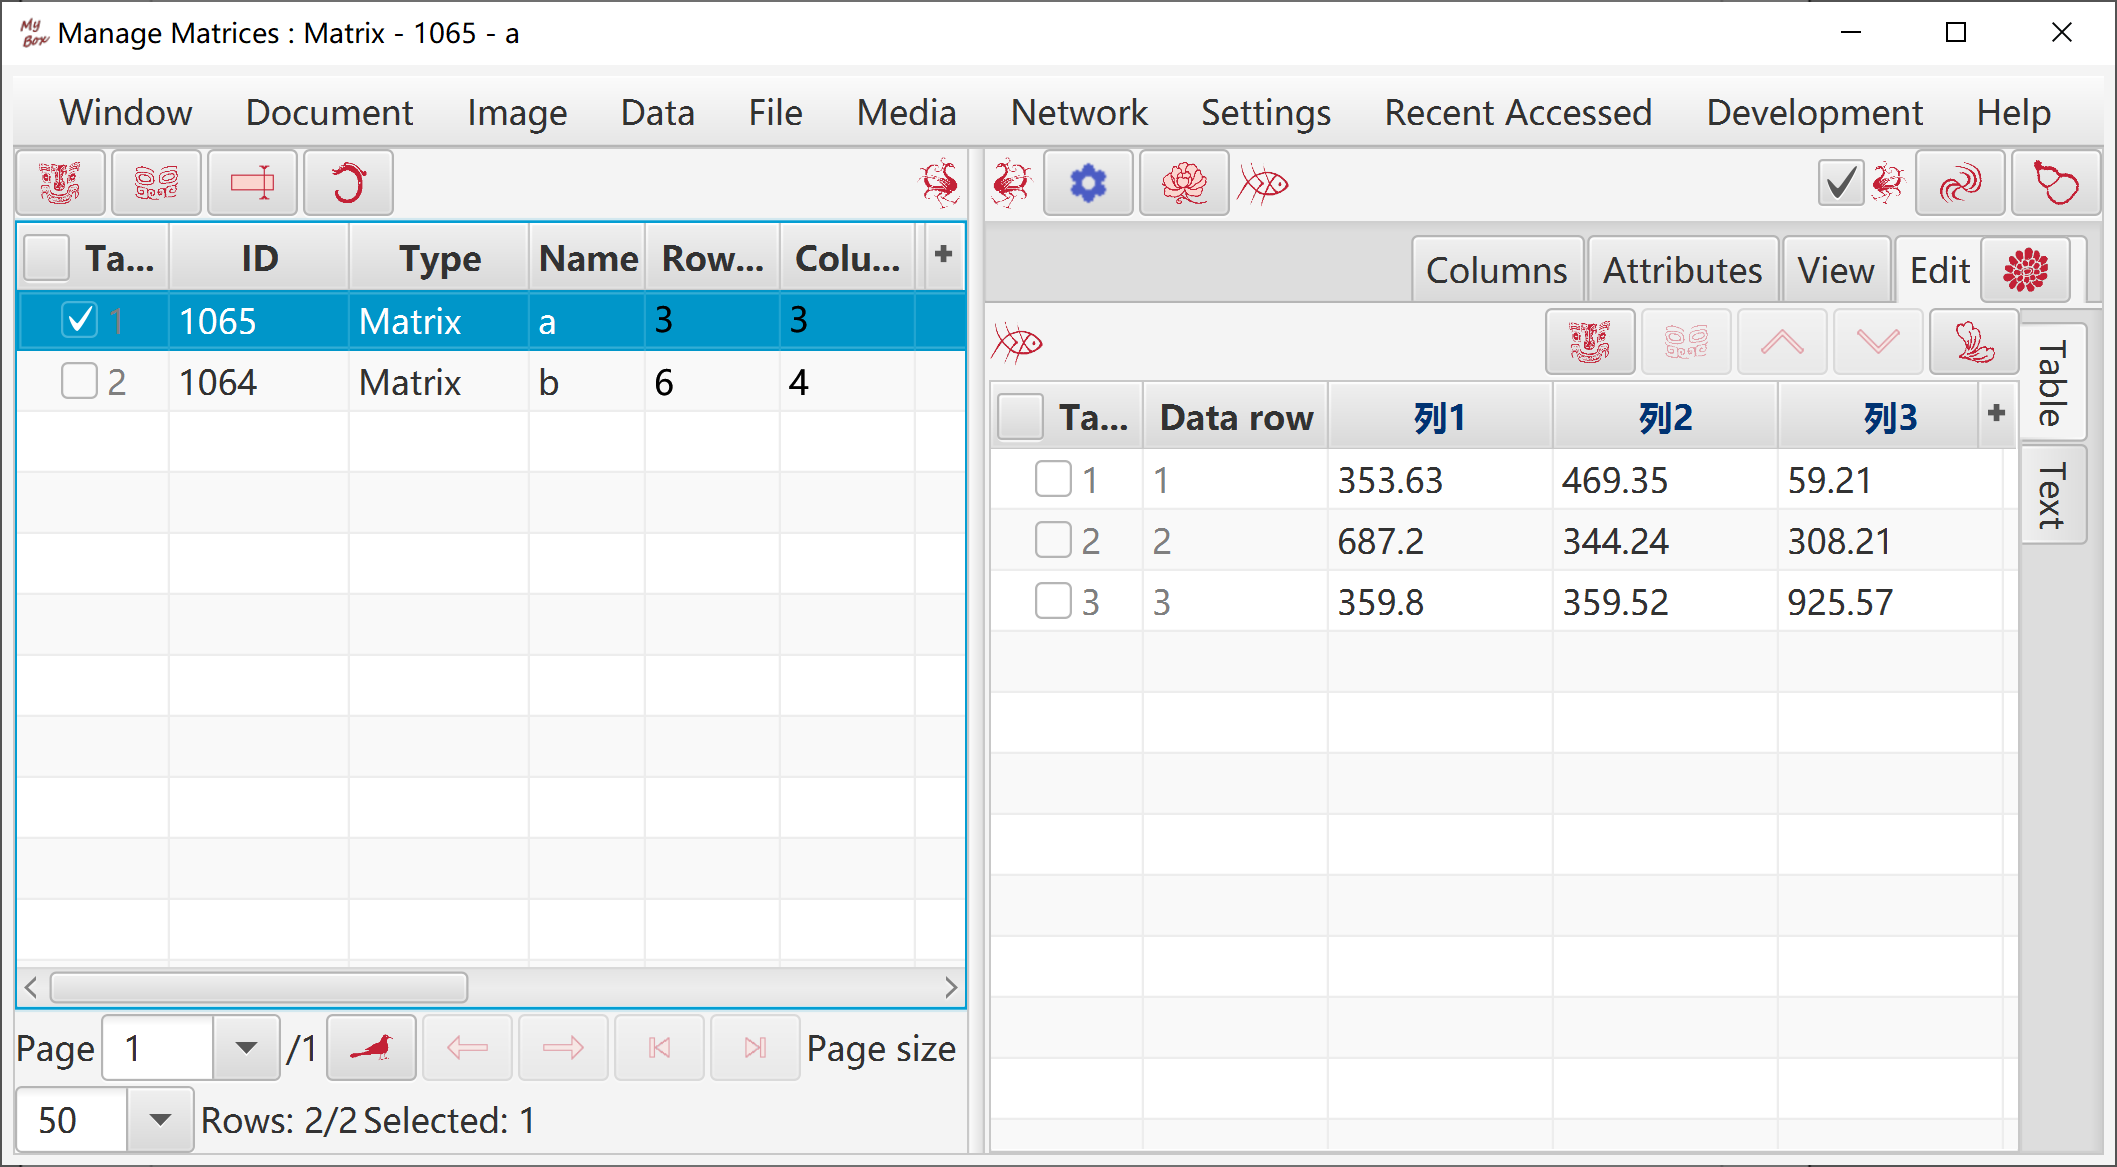
Edit matrix.
Matrix can be saved and reused.
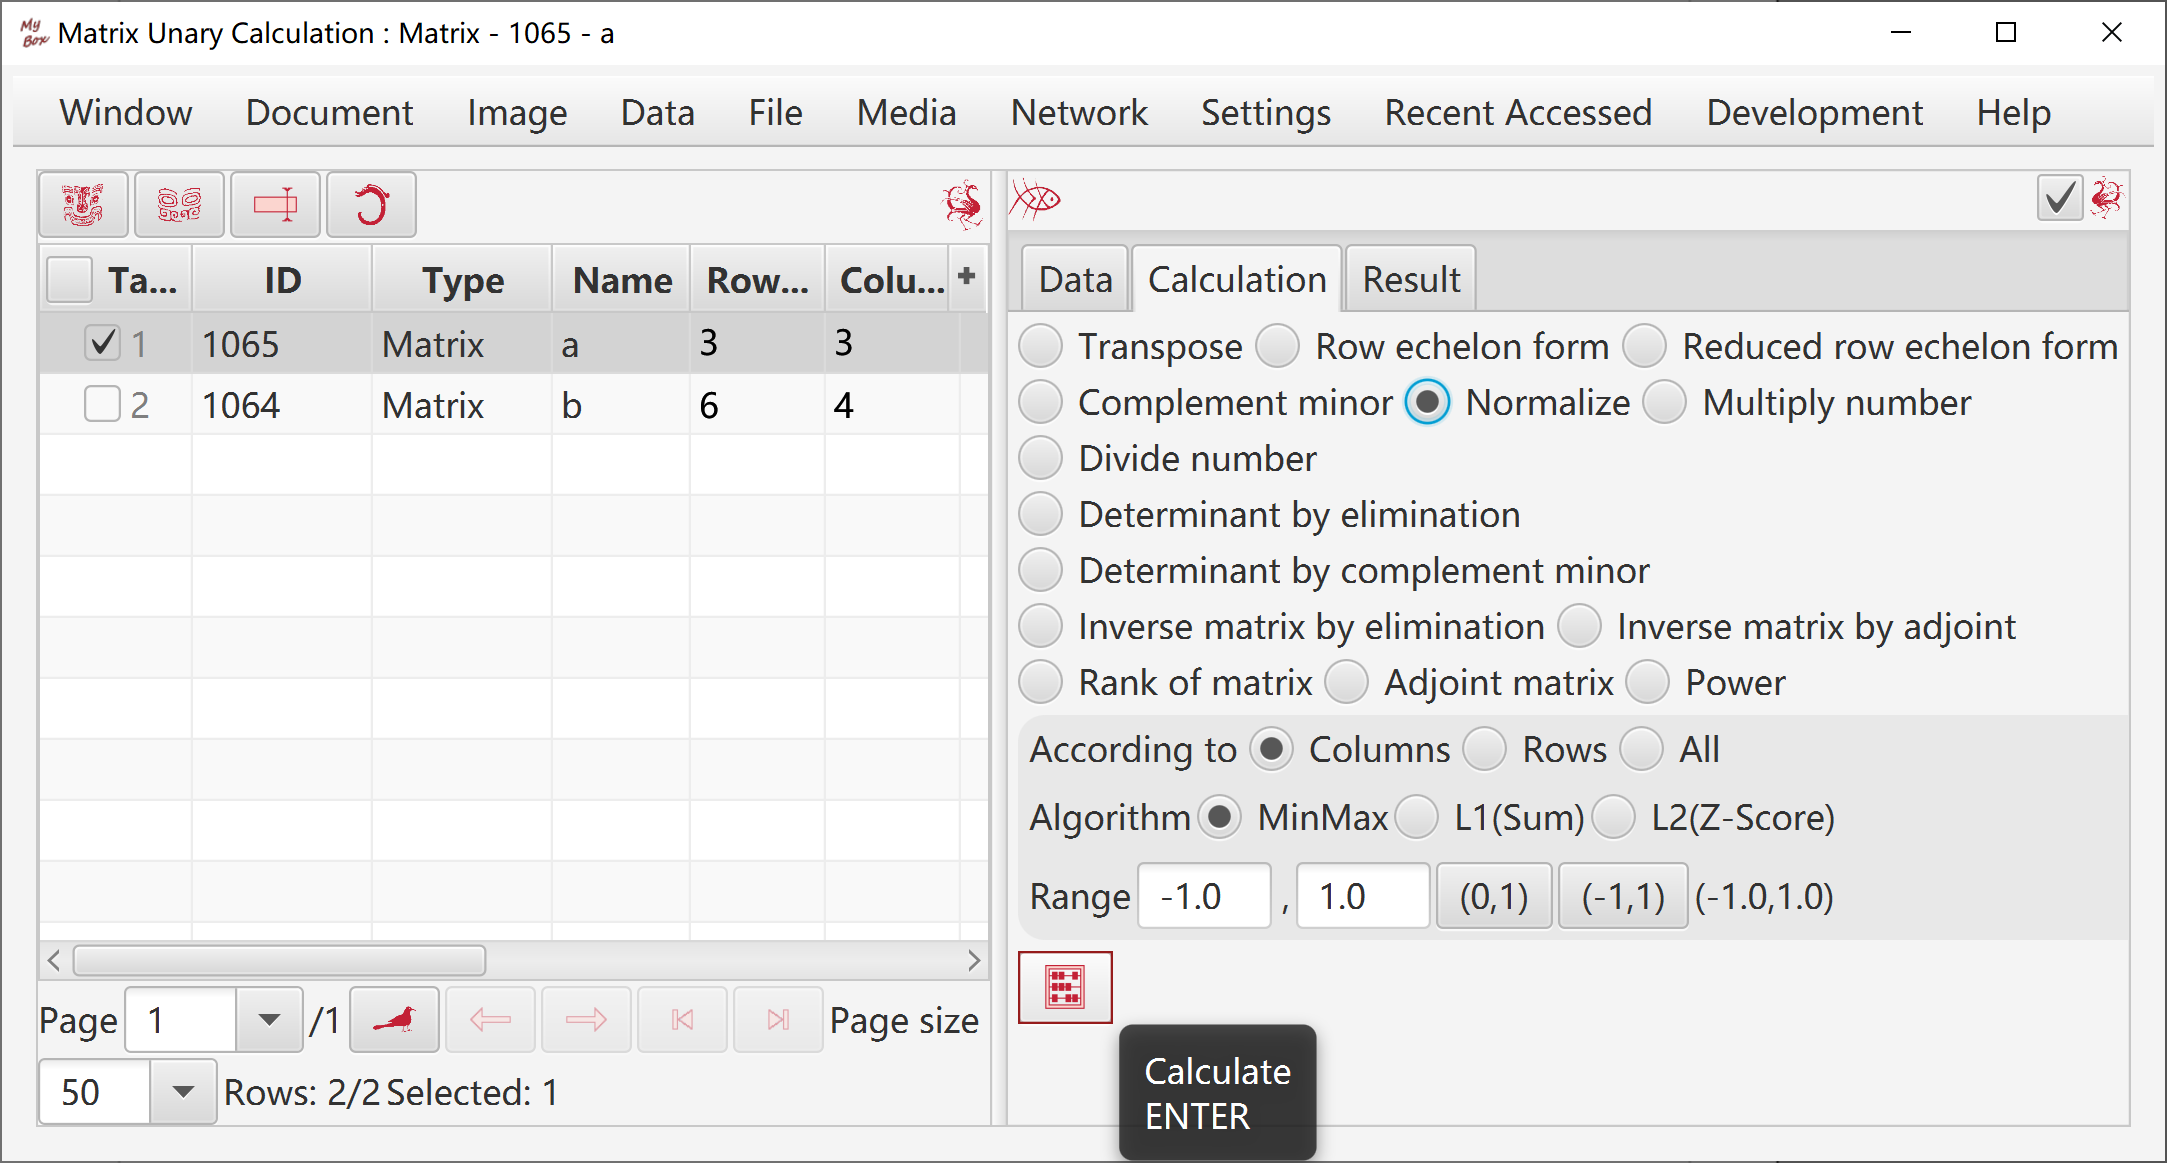
Transpose, Row Echelon Form, Reduced Row Echelon Form, Determinant By Elimination, Determinant By Complement Minor, Inverse Matrix By Elimination, Inverse Matrix By Adjoint, Matrix Rank, Adjoint Matrix, Complement Minor, Normalize, Multiply Number, Divide By Number, Power.
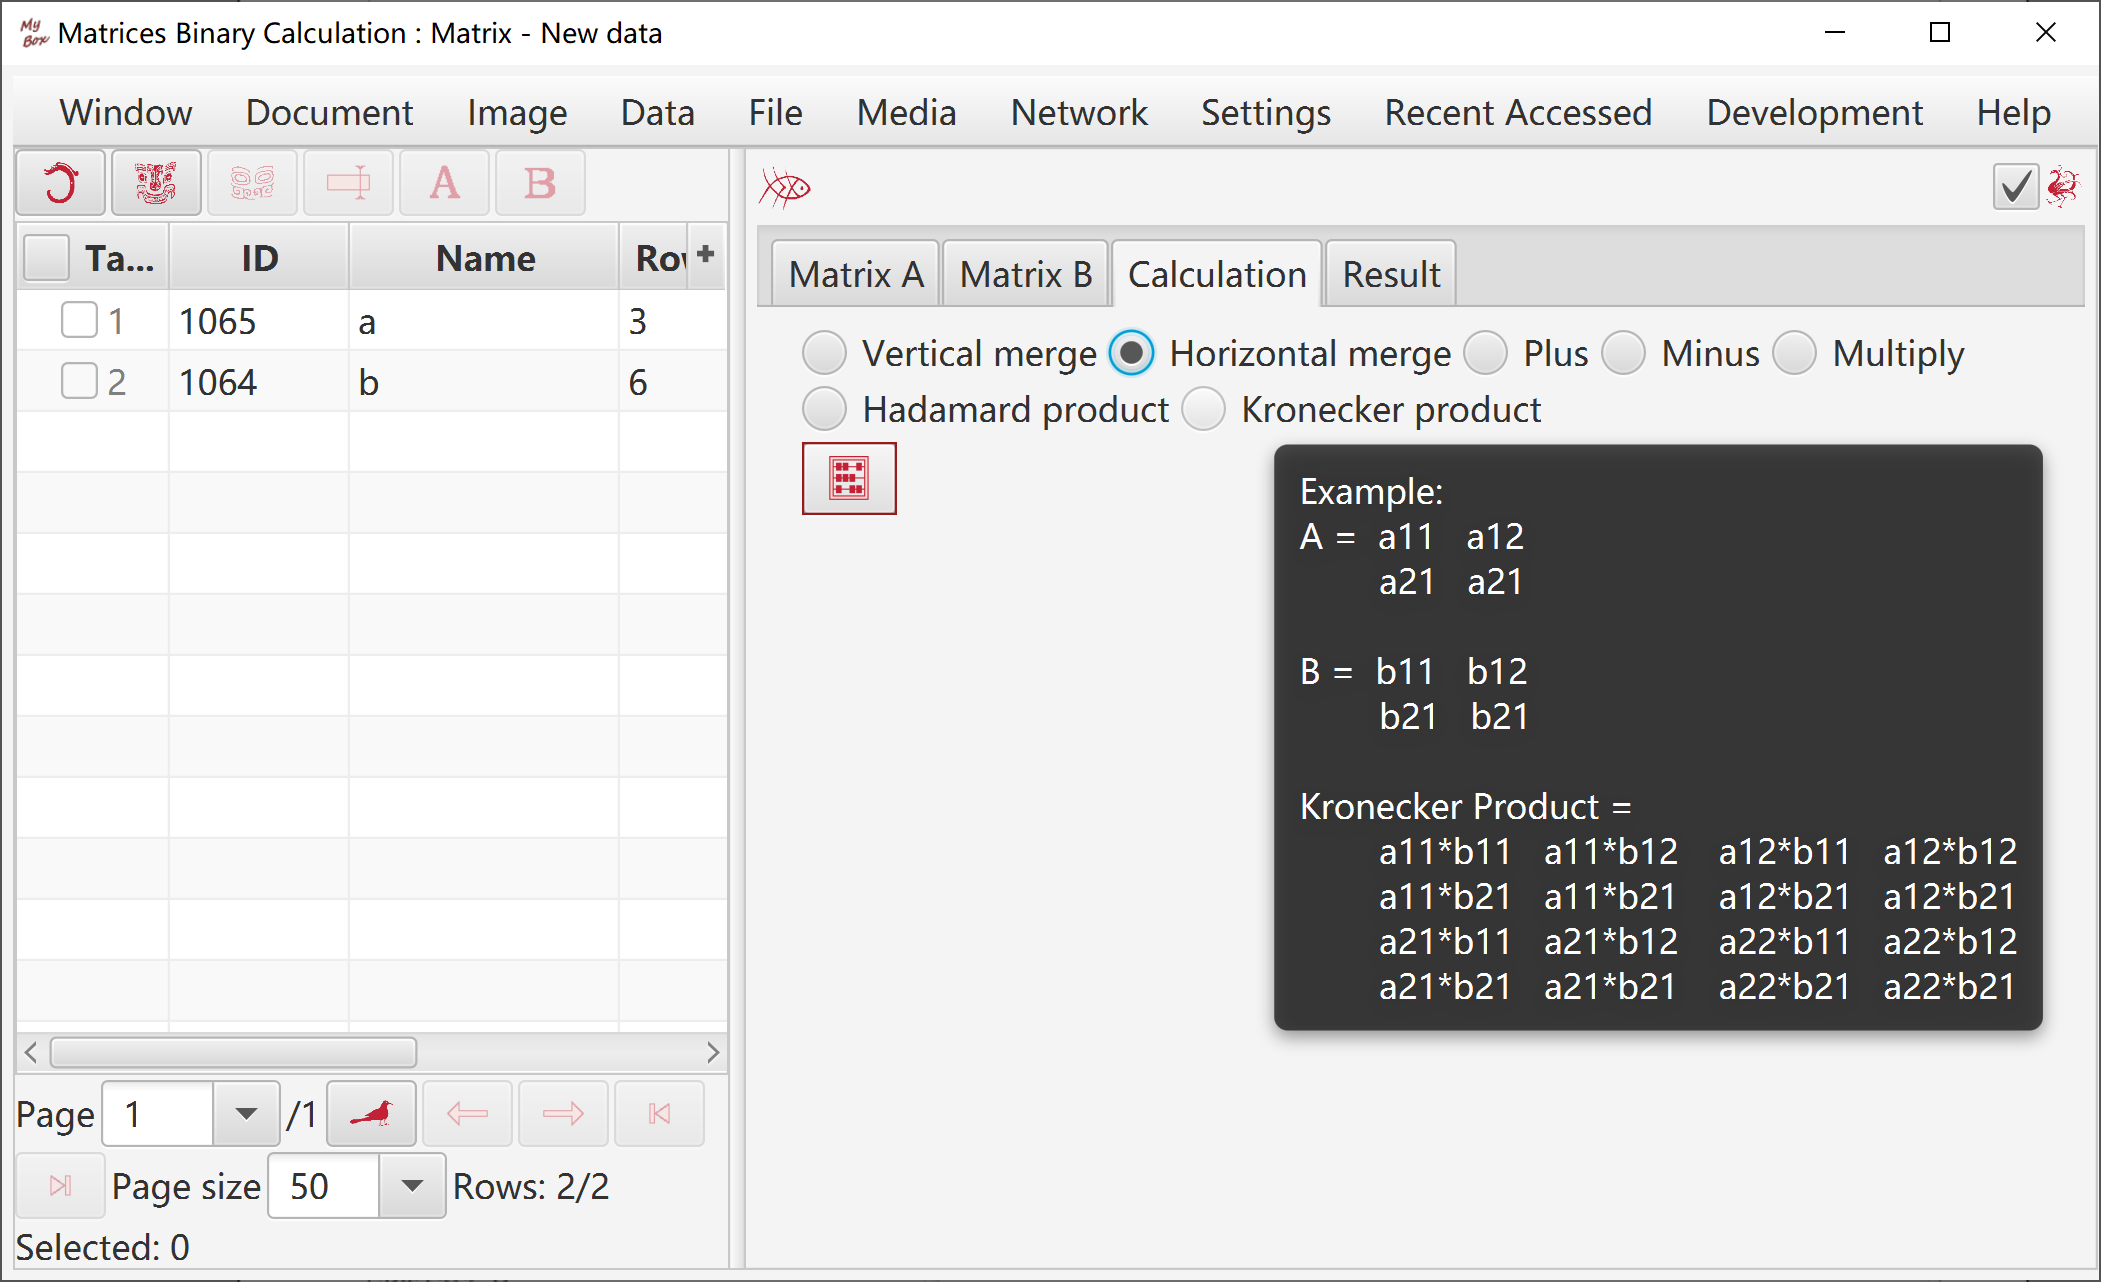
Plus, Minus, Hadamard Product, Kronecker Product, Horizontally Merge, Vertically Merge.
View table definition.
Execute SQL.
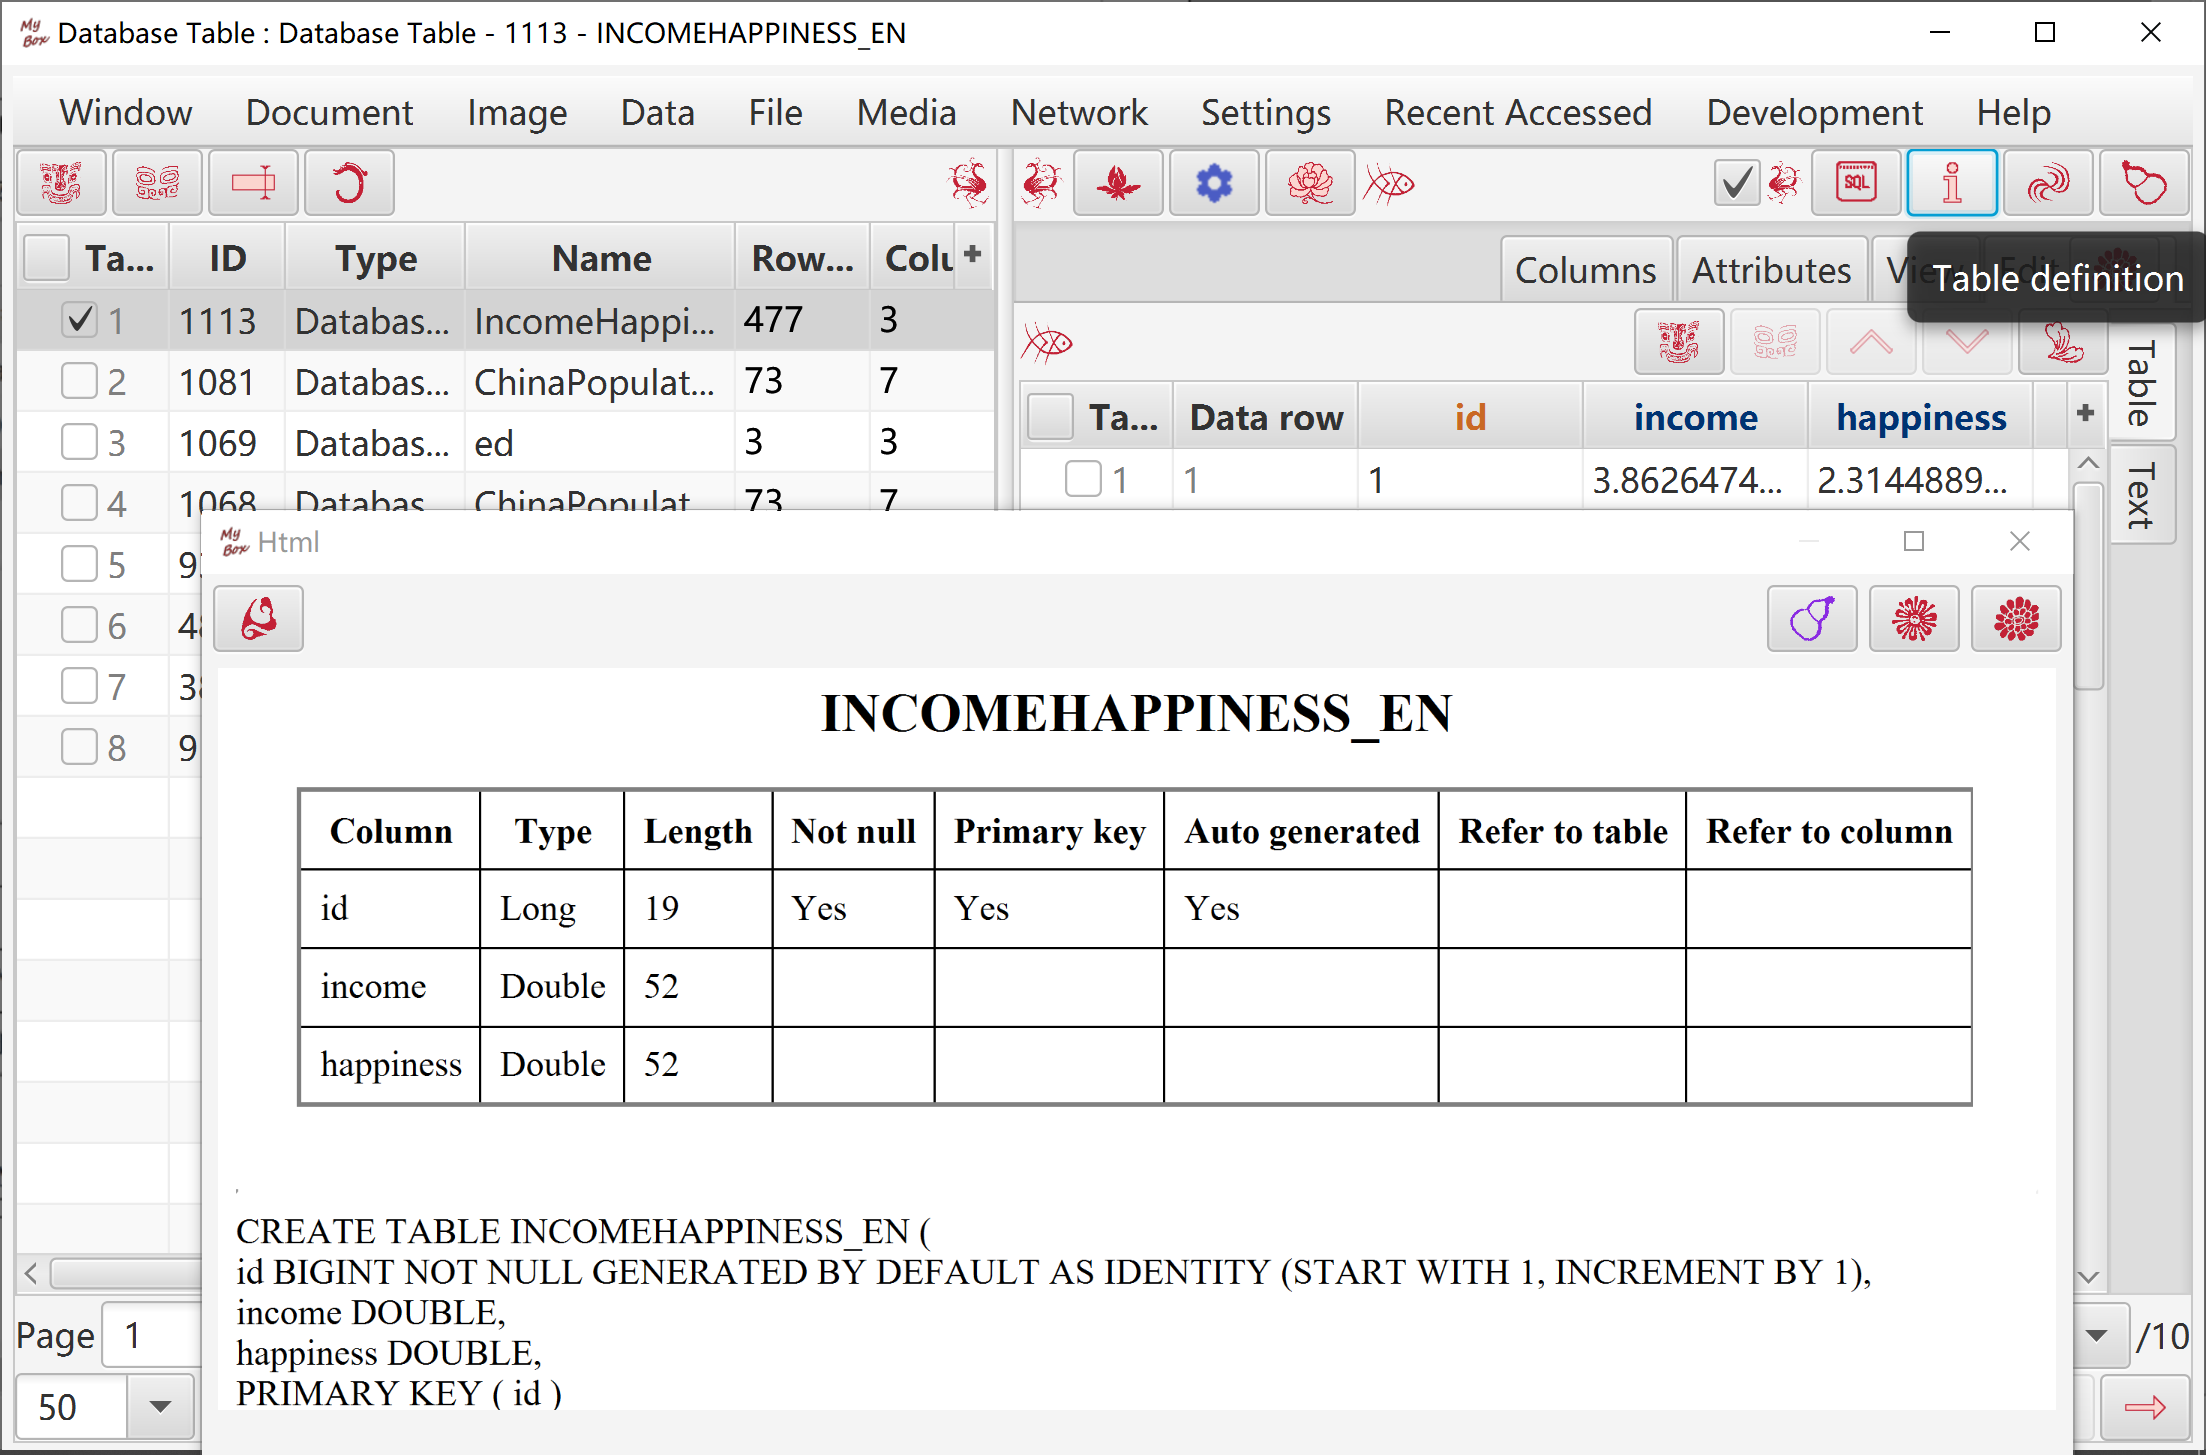
Table name and column names should satisfy "Limitations of SQL identifier":
Maximum length is 128.
"Ordinary identifier":
Not surrounded by double quotation marks.
Must begin with a letter.
Contains only letters, underscore characters (_), and digits.
Permits Unicode letters and digits.
Can not be reserved words.
It is converted as uppercase when saved in database.
It is case-insensitive when referred in SQL statement.
Example, AbC is same as abc and aBC.
"Delimited identifier":
Surrounded by double quotation marks.
Can contain any characters.
It is saved as string inside the double quotations in database.
It should be surrounded by double quotations when referred in SQL statement, except for following: It only includes upper case letters and underscores.
Example, "AbC" is different from AbC or "ABC" while "ABC" is same as ABC and abc.
When MyBox create name of table/column: The name will be quoted if it includes invalid character.
After database table is created:
Definition of Primary keys can not be changed and deleted.
Definition of other columns can be added and deleted but can not be changed.
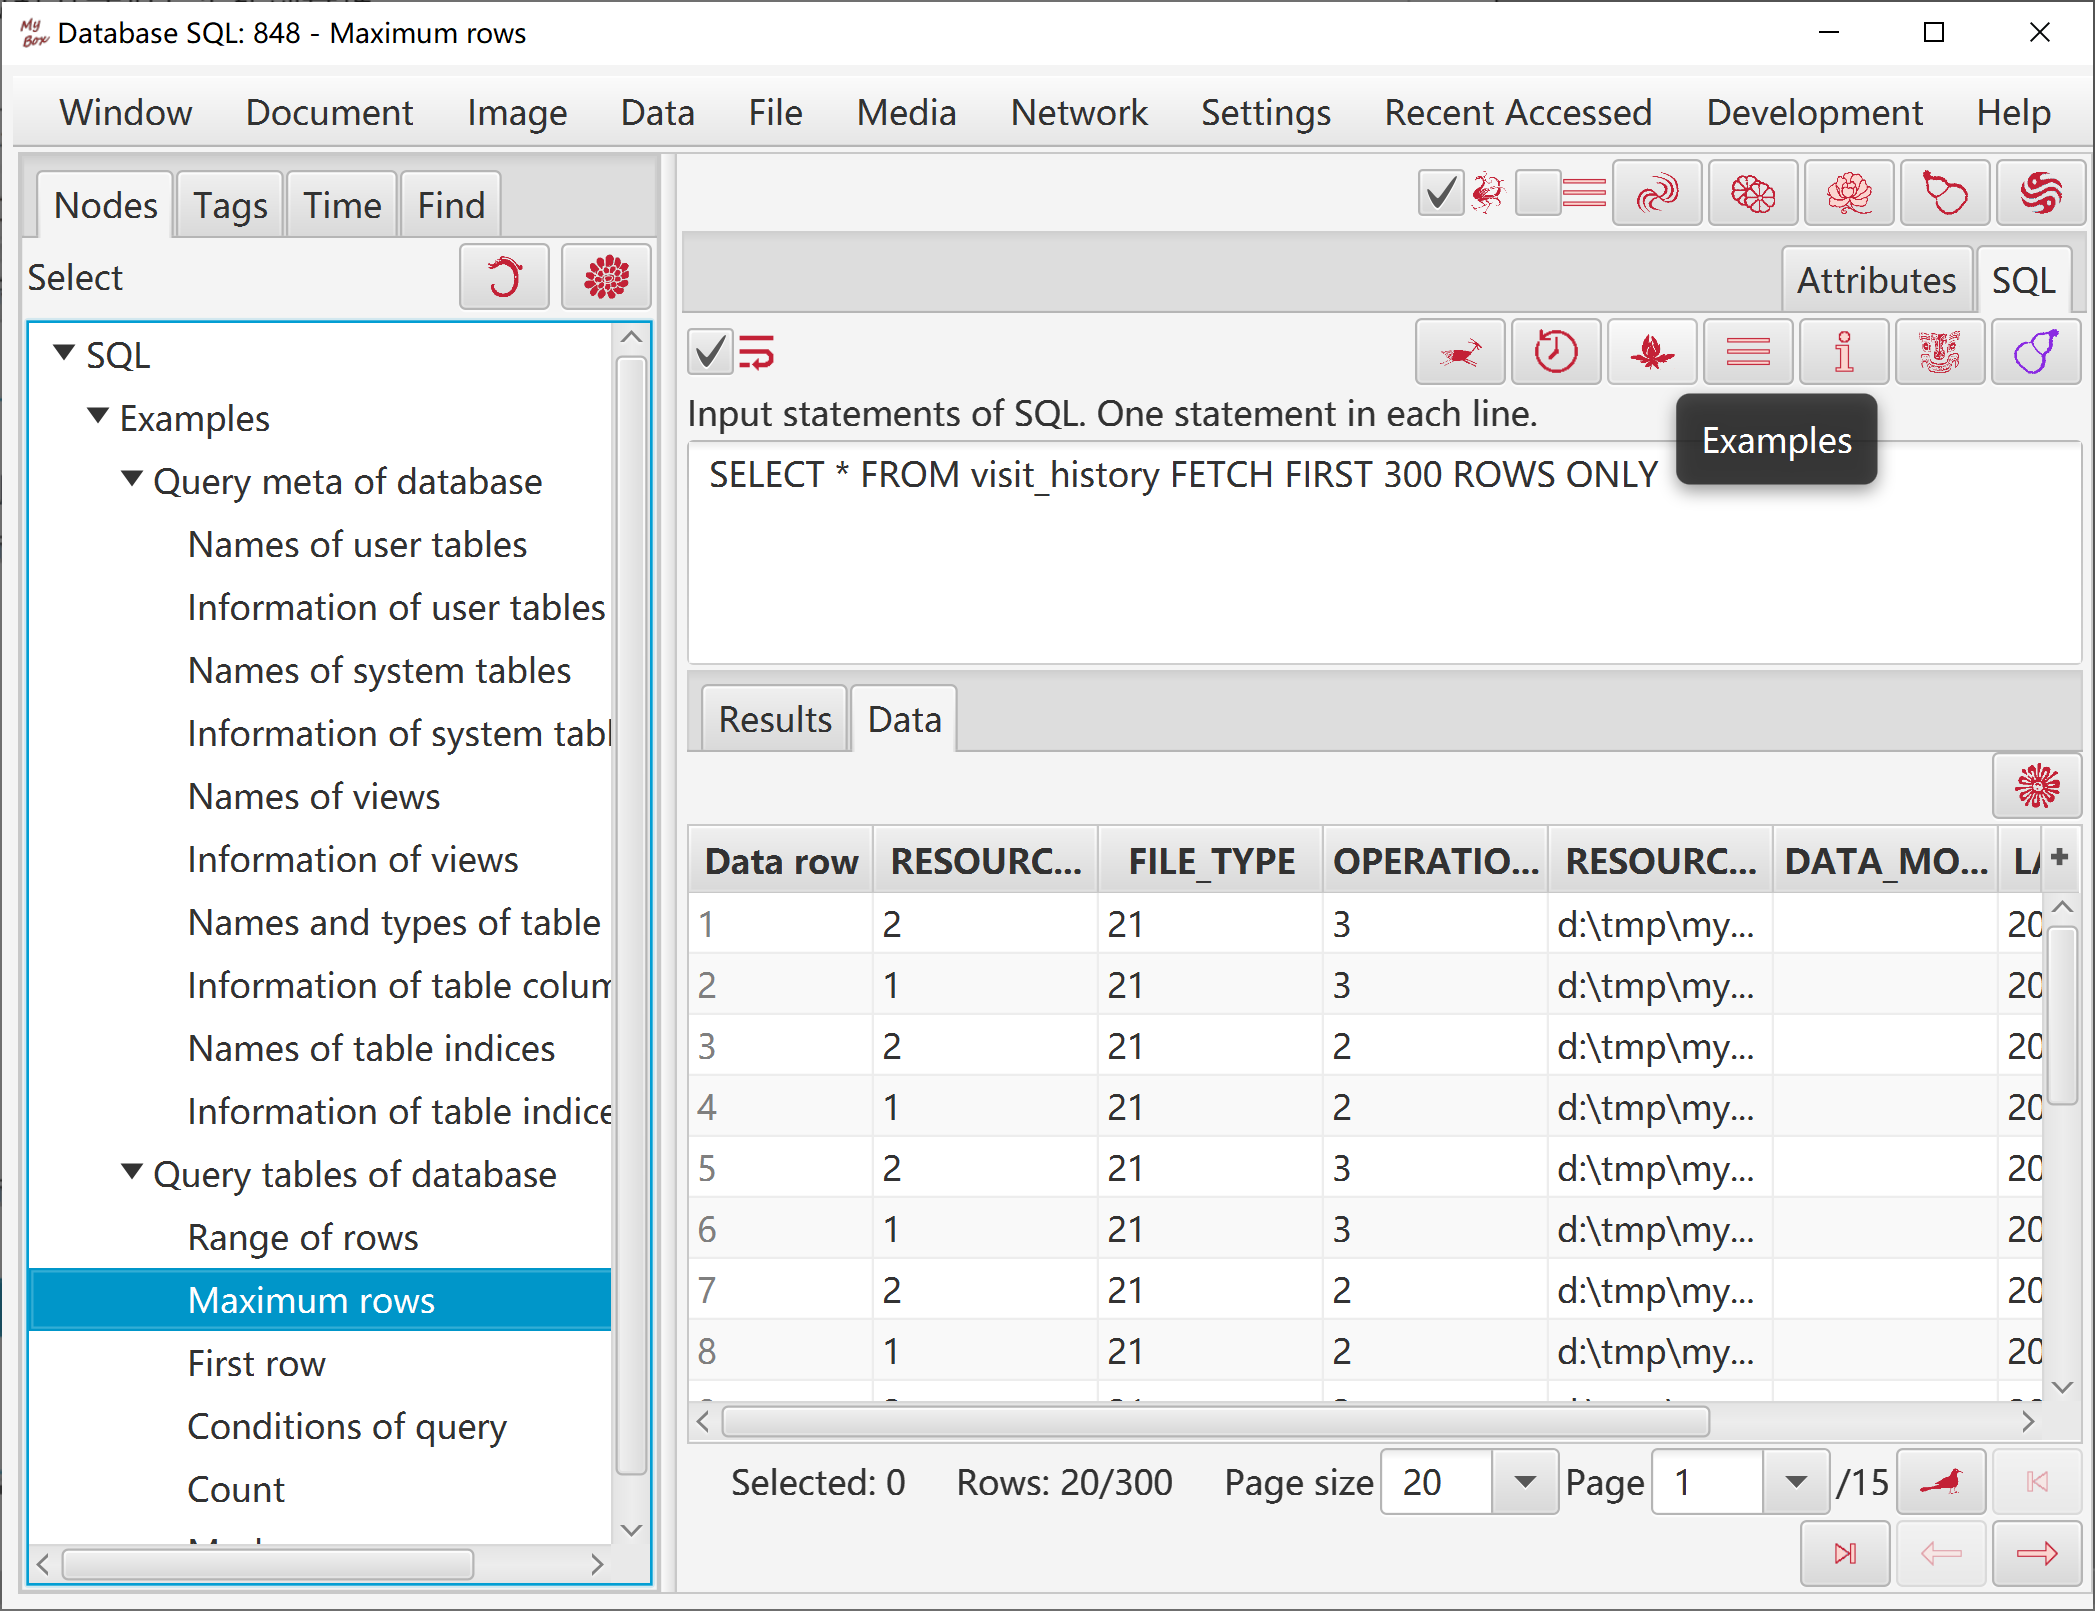
Provide examples of SQL statements.
List names of all user tables automatically.
View table definitions of all user tables.
Display outputs of execution and results of query.
SQL codes can be organized as information of tree.
Can load or save as external files.
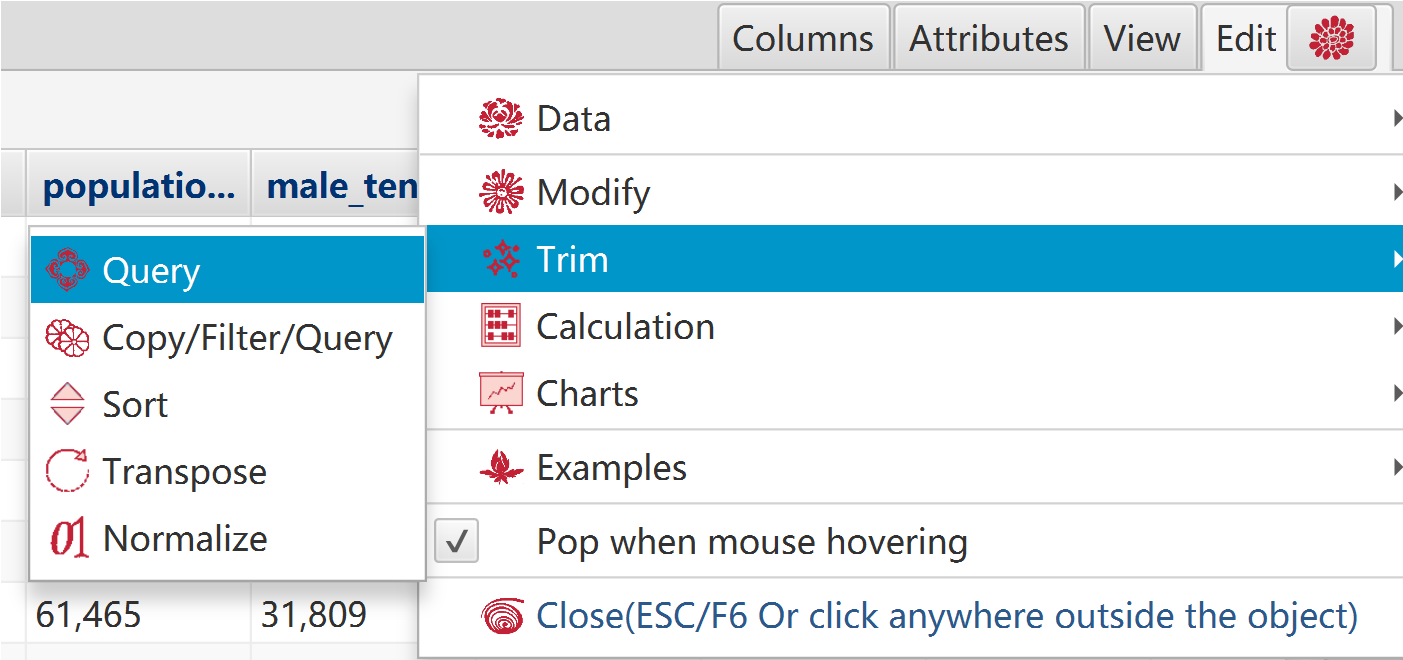
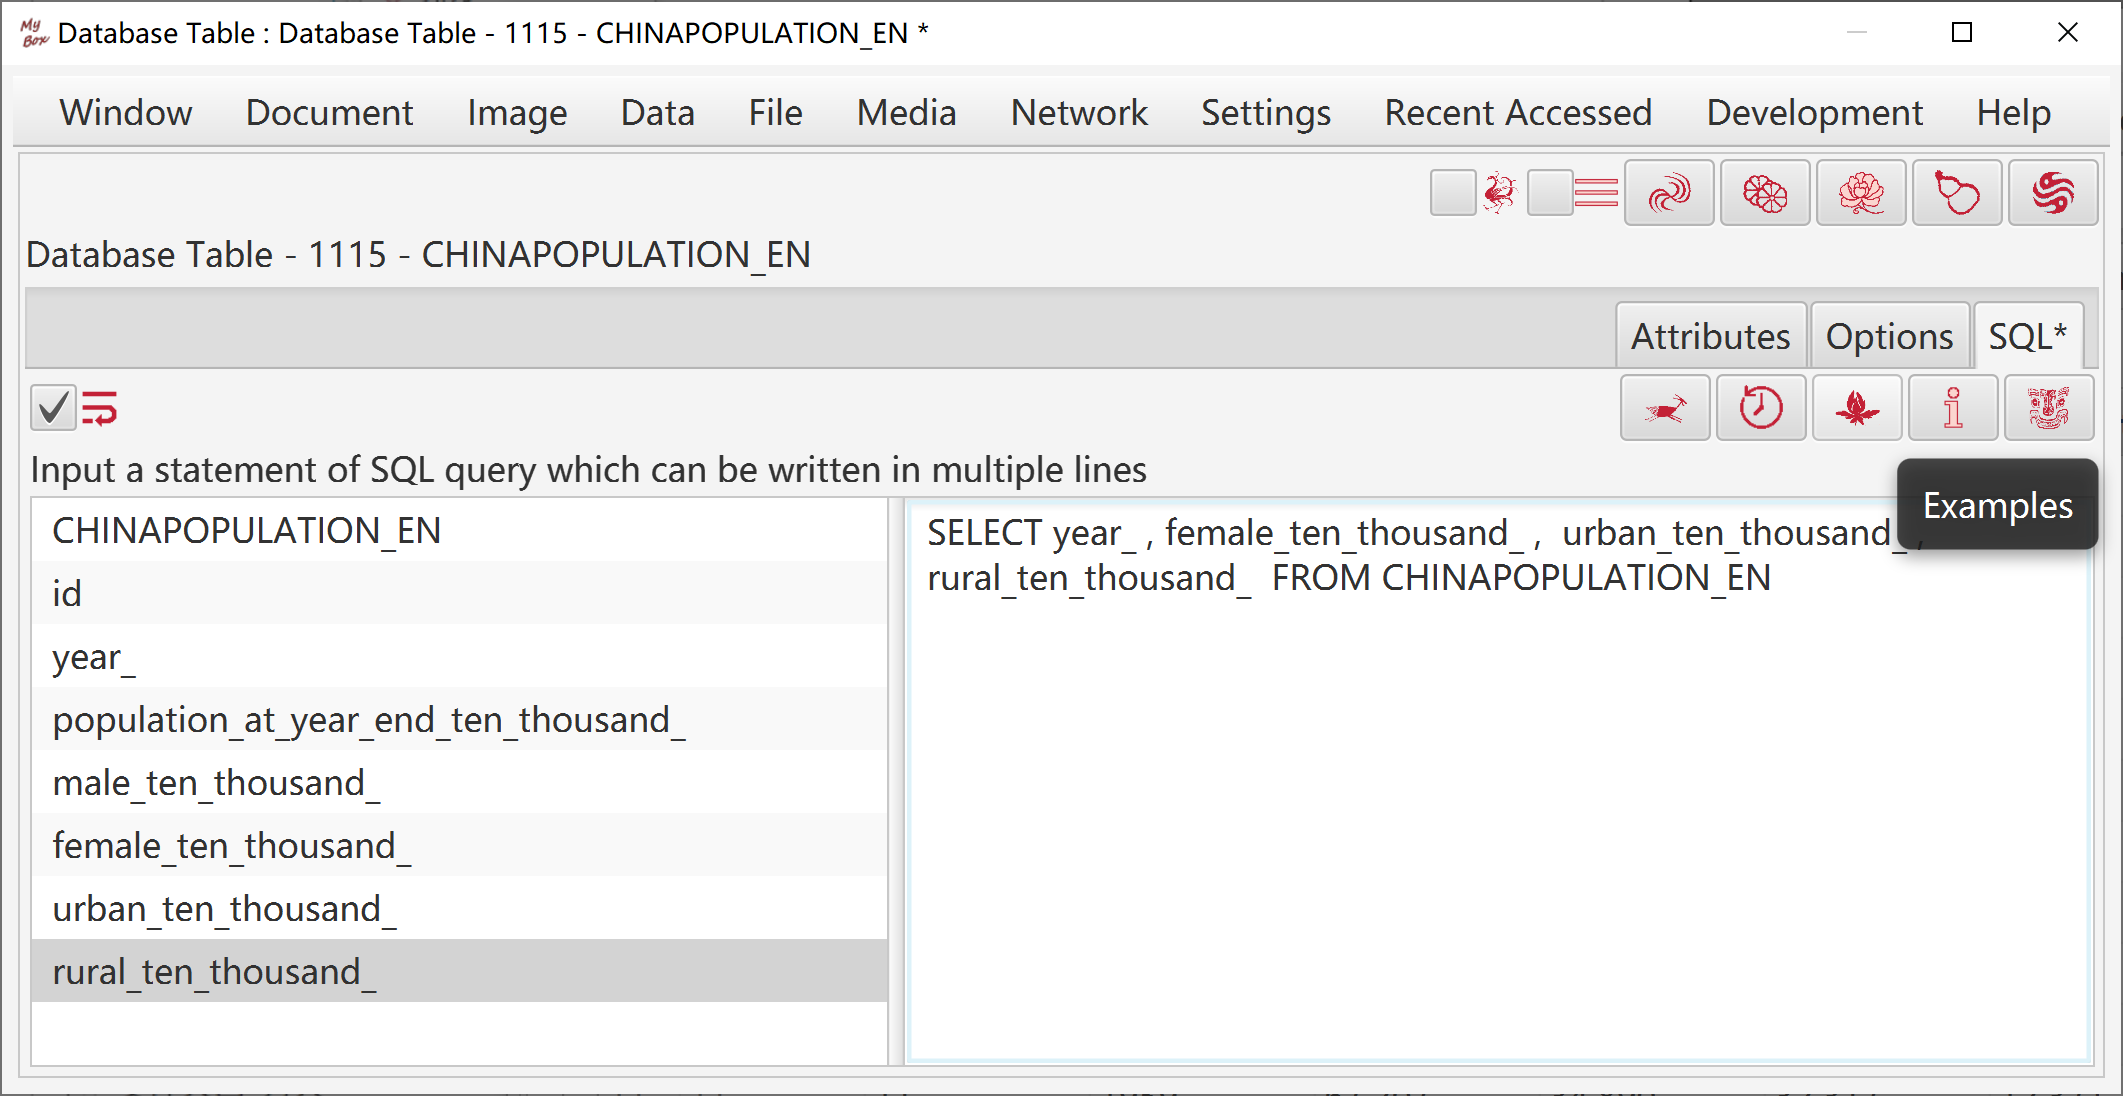
Database table has a special function menu: “Functions” - “Trim” - “Query”, which can help to input and execute SQL query:
Names of table and columns are listed in left.
Provide examples and record histories.
JShell is one of tools in JDK:
JShell provides capability to interactively evaluate "snippets", as Read-Eval-Print Loop (REPL).
"Snippet" is a single expression, statement, or declaration of Java programming language code:
Semicolons should be in the end of statement while expression need not it.
Variables and methods can be defined and called later.
Extrenal Java classes should be accessible:
JShell picks "CLASSPATH" of system environment.
Other jar files or paths can be appended to "CLASSPATH".
Except for base classes, most of Java classes should be imported before call them.
JShell can be used for scientific computation and Java codes debug.
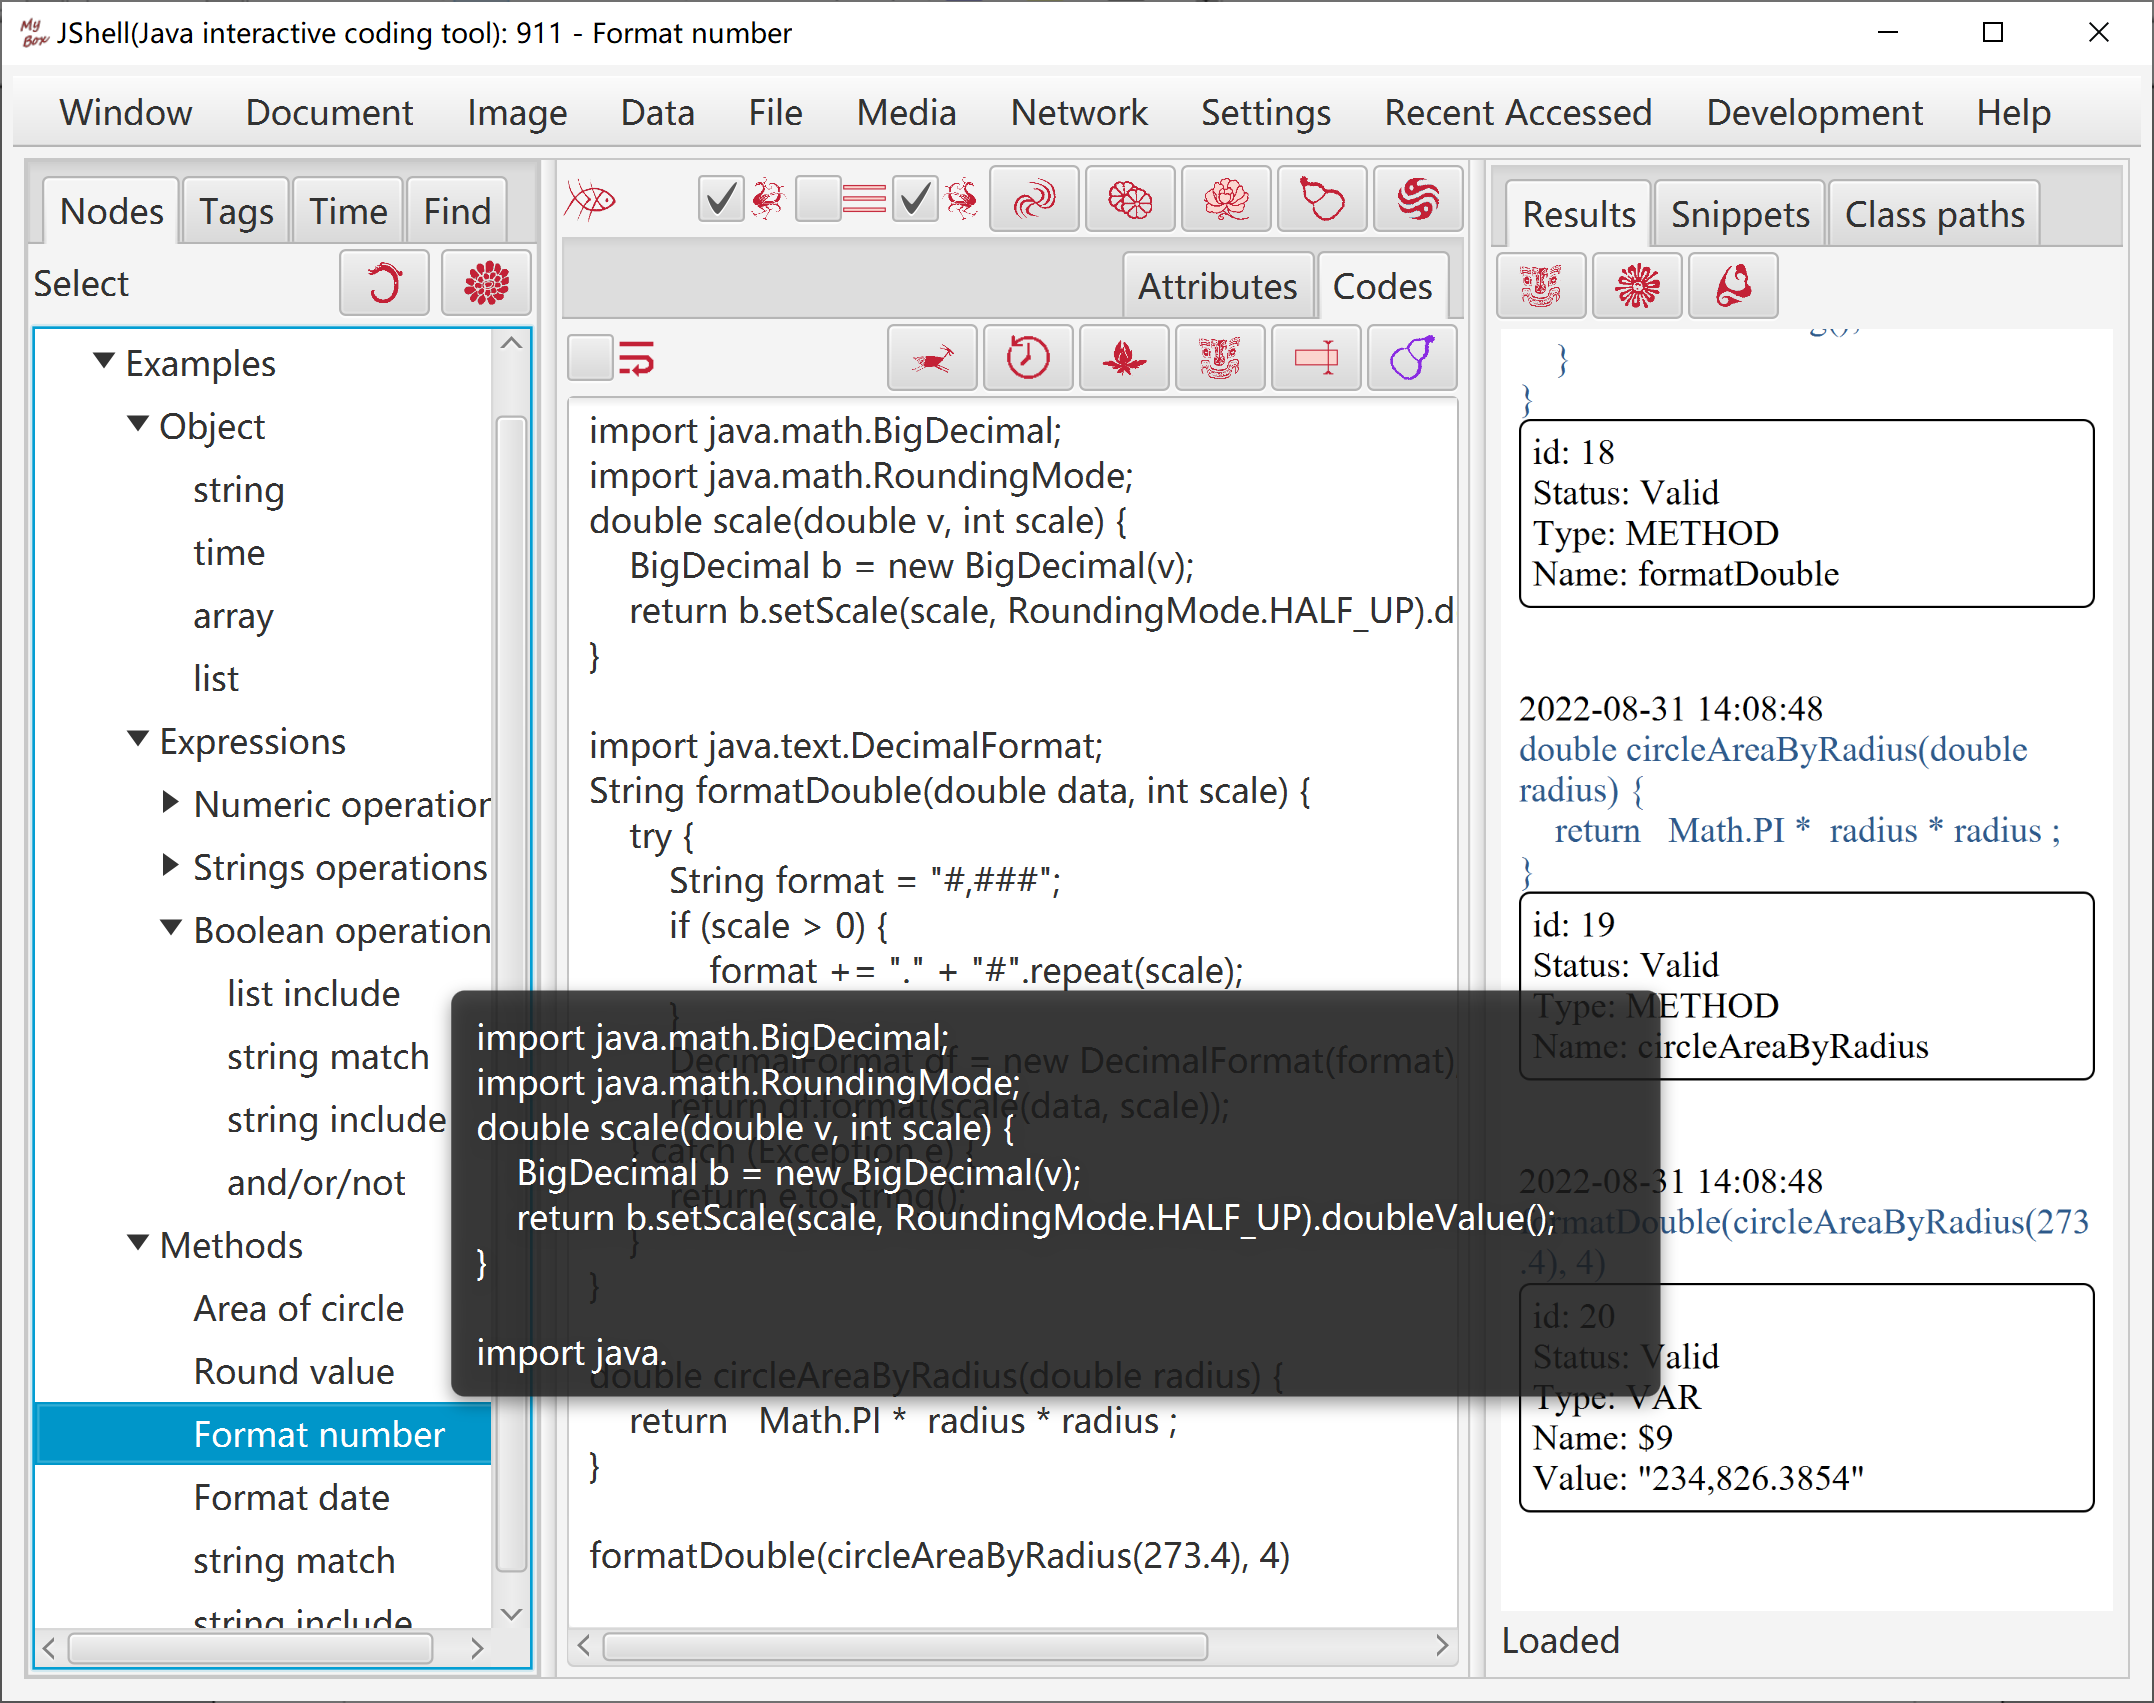
This tool helps to run JShell in GUI:
Input several snippets and click button "Start" to run them:
Snippets are evaluated one by one.
Results of snippets will affect later snippets, like "an execution environment".
Attributes of all evaluated snippets will be shown in a table.
Click button "Delete" or "Clear" to drop some or all snippets from current environment.
Click button "Reset" to empty JShell and environment becomes blank.
Press "CTRL+1" to pop list of code completion suggestions.
If added MyBox class paths, all methods of MyBox can be referred.
JShell codes are organized in tree. Examples are provided.
JEXL(Java Expression Language) is a library to generate values dynamically with variables and scripts.
JEXL has different syntax from Java. It is more like javascript.
Before run expression/script, all variables in it should have values held by JexlContext.
Refer to Java classes by creating their instances as local variables. Full package name is required.
JEXL can be used for scientific computation and data manufacture.
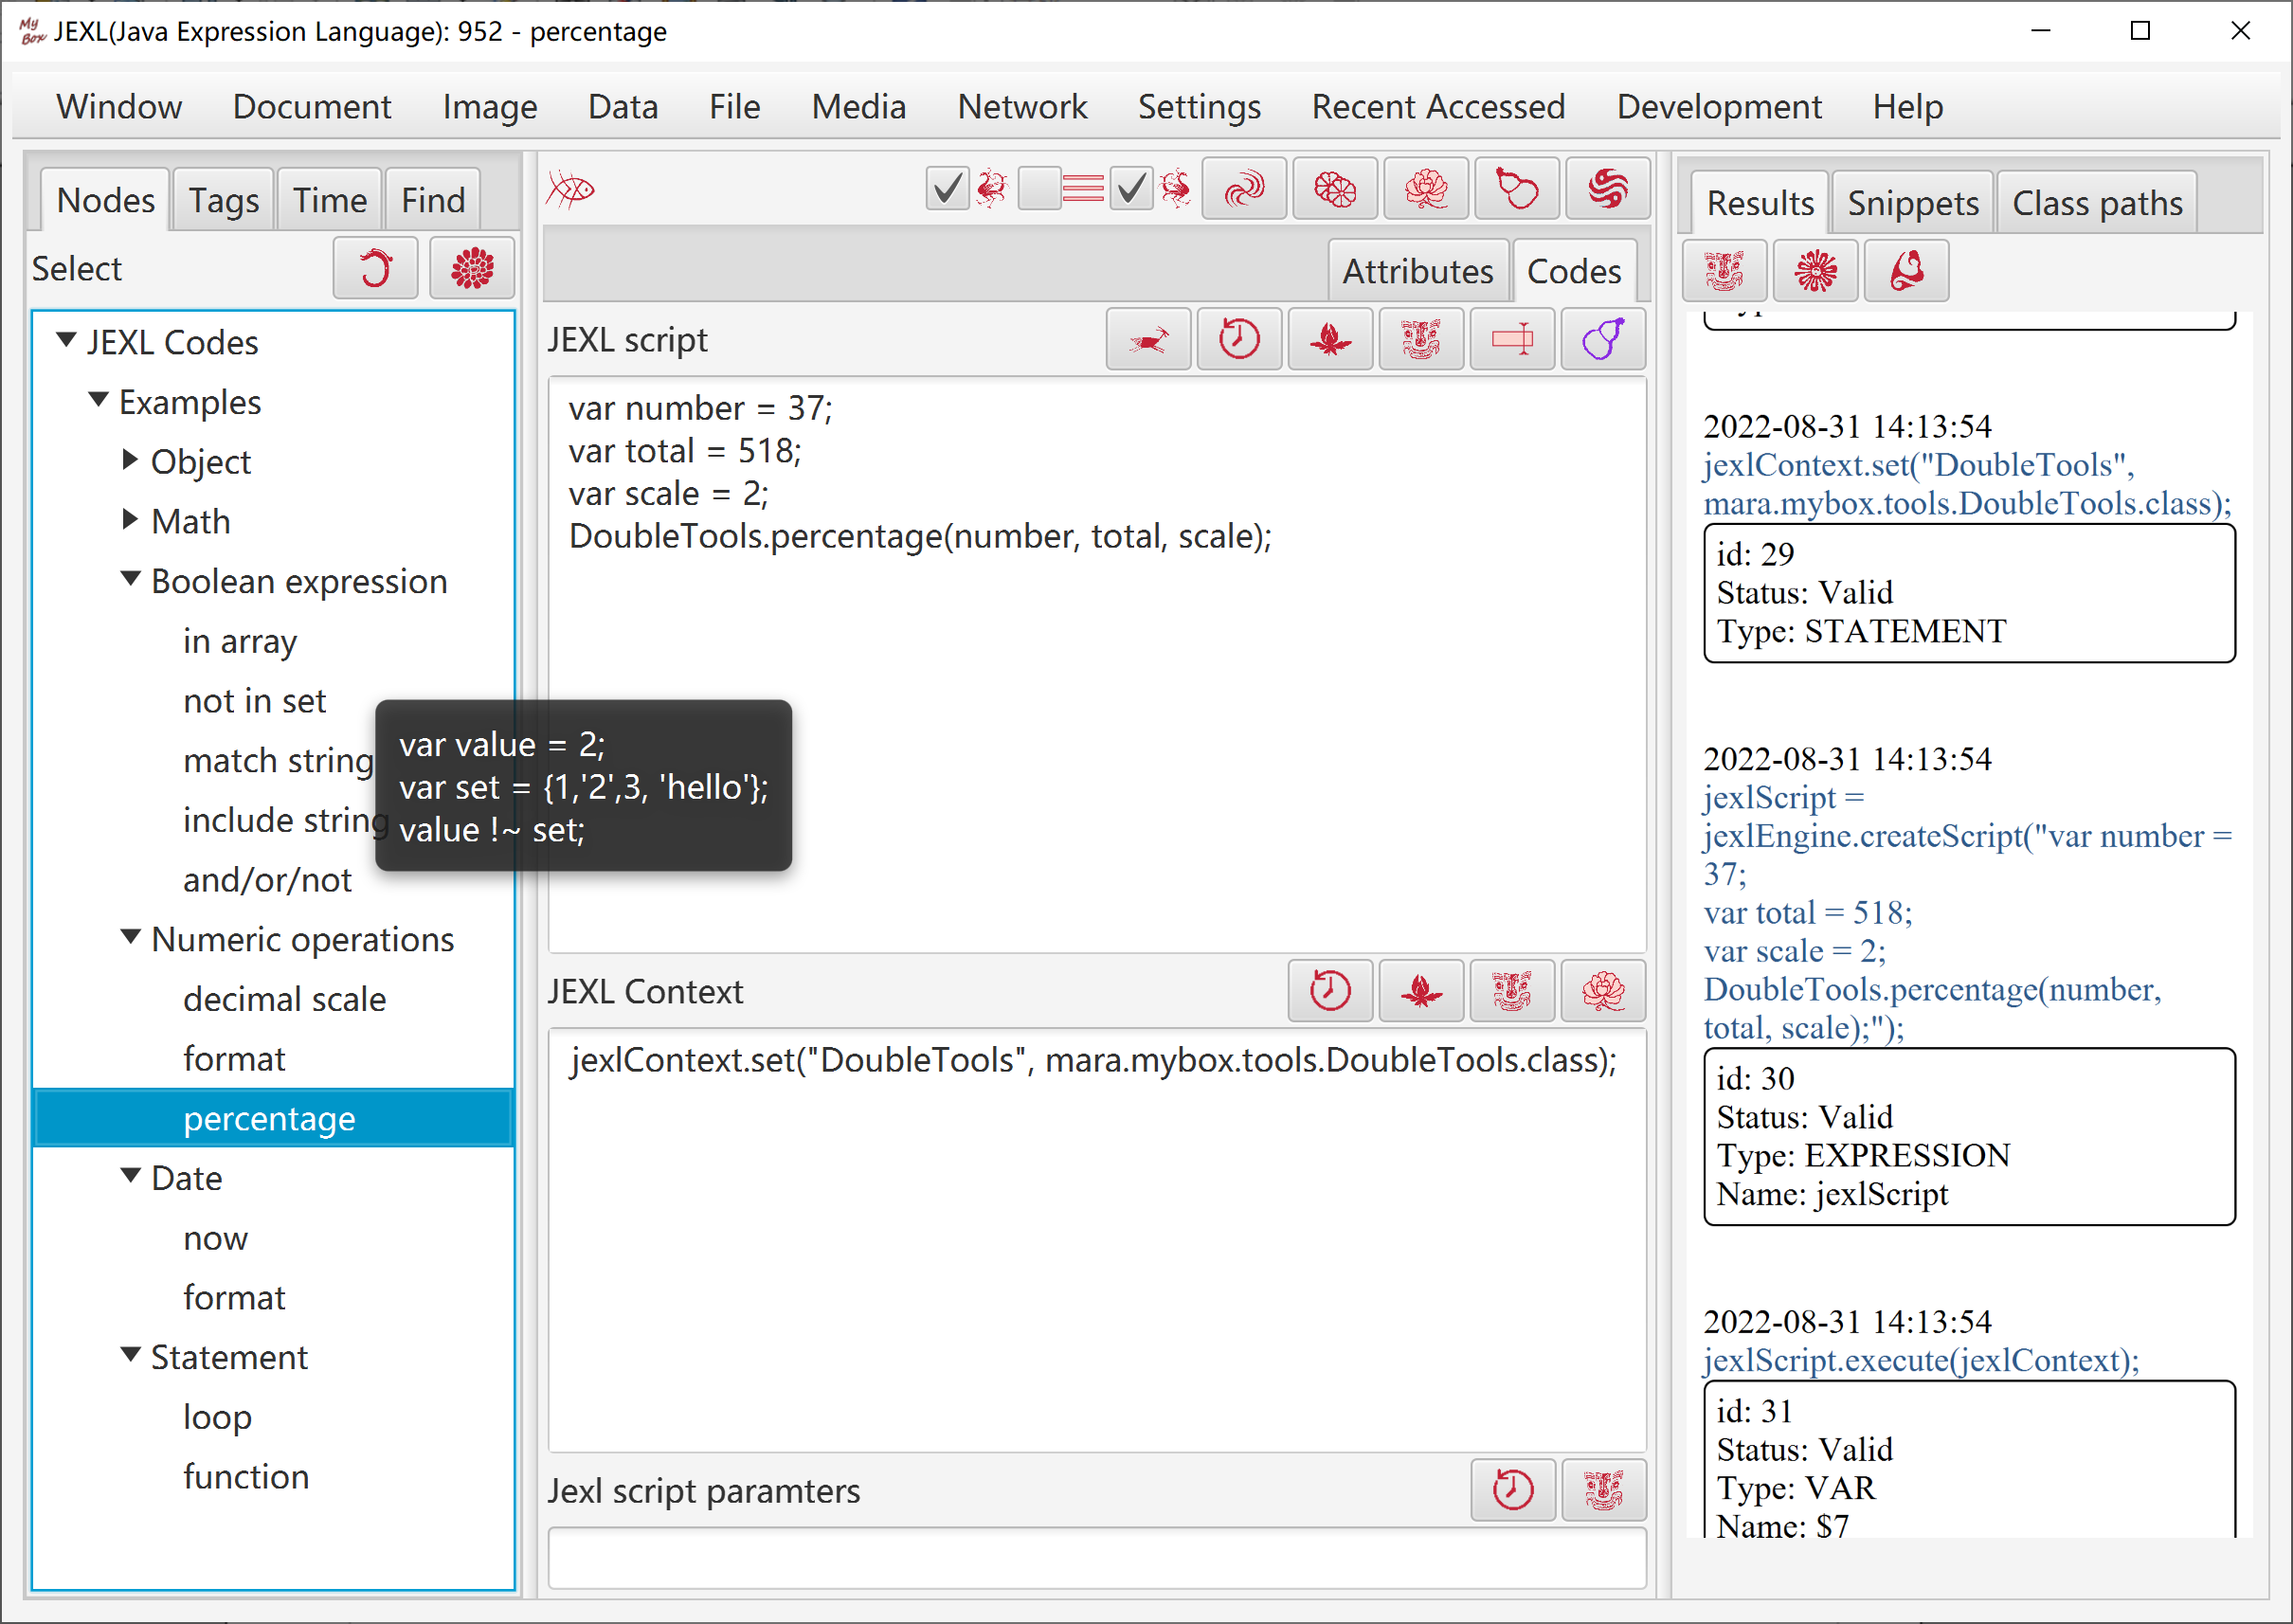
This tool helps to run JEXL in GUI:
Input JEXL expression/script.
Notice: Use single quotes instead of double quotes to surround strings.
Input Java codes of setting JexlContext like following:
jexlContext.set("name", value);
Example, set following to use Math.PI in expression/script:
jexlContext.set("Math", Math.class);
Input parameters of JEXL script if any. Separate values by comma.
Click button "Start" to evaluate the expression/script.
MyBox does following in JShell enrionment automatically:
Add MyBox library paths to CLASSPATH.
Import necessary JEXL packages.
Execute codes of JexlContext.
Calculate expression/script with parameters(if any).
If all variables and paramters have valid values, result is shown in right pane.
JEXL codes are organized in tree. Examples are provided.
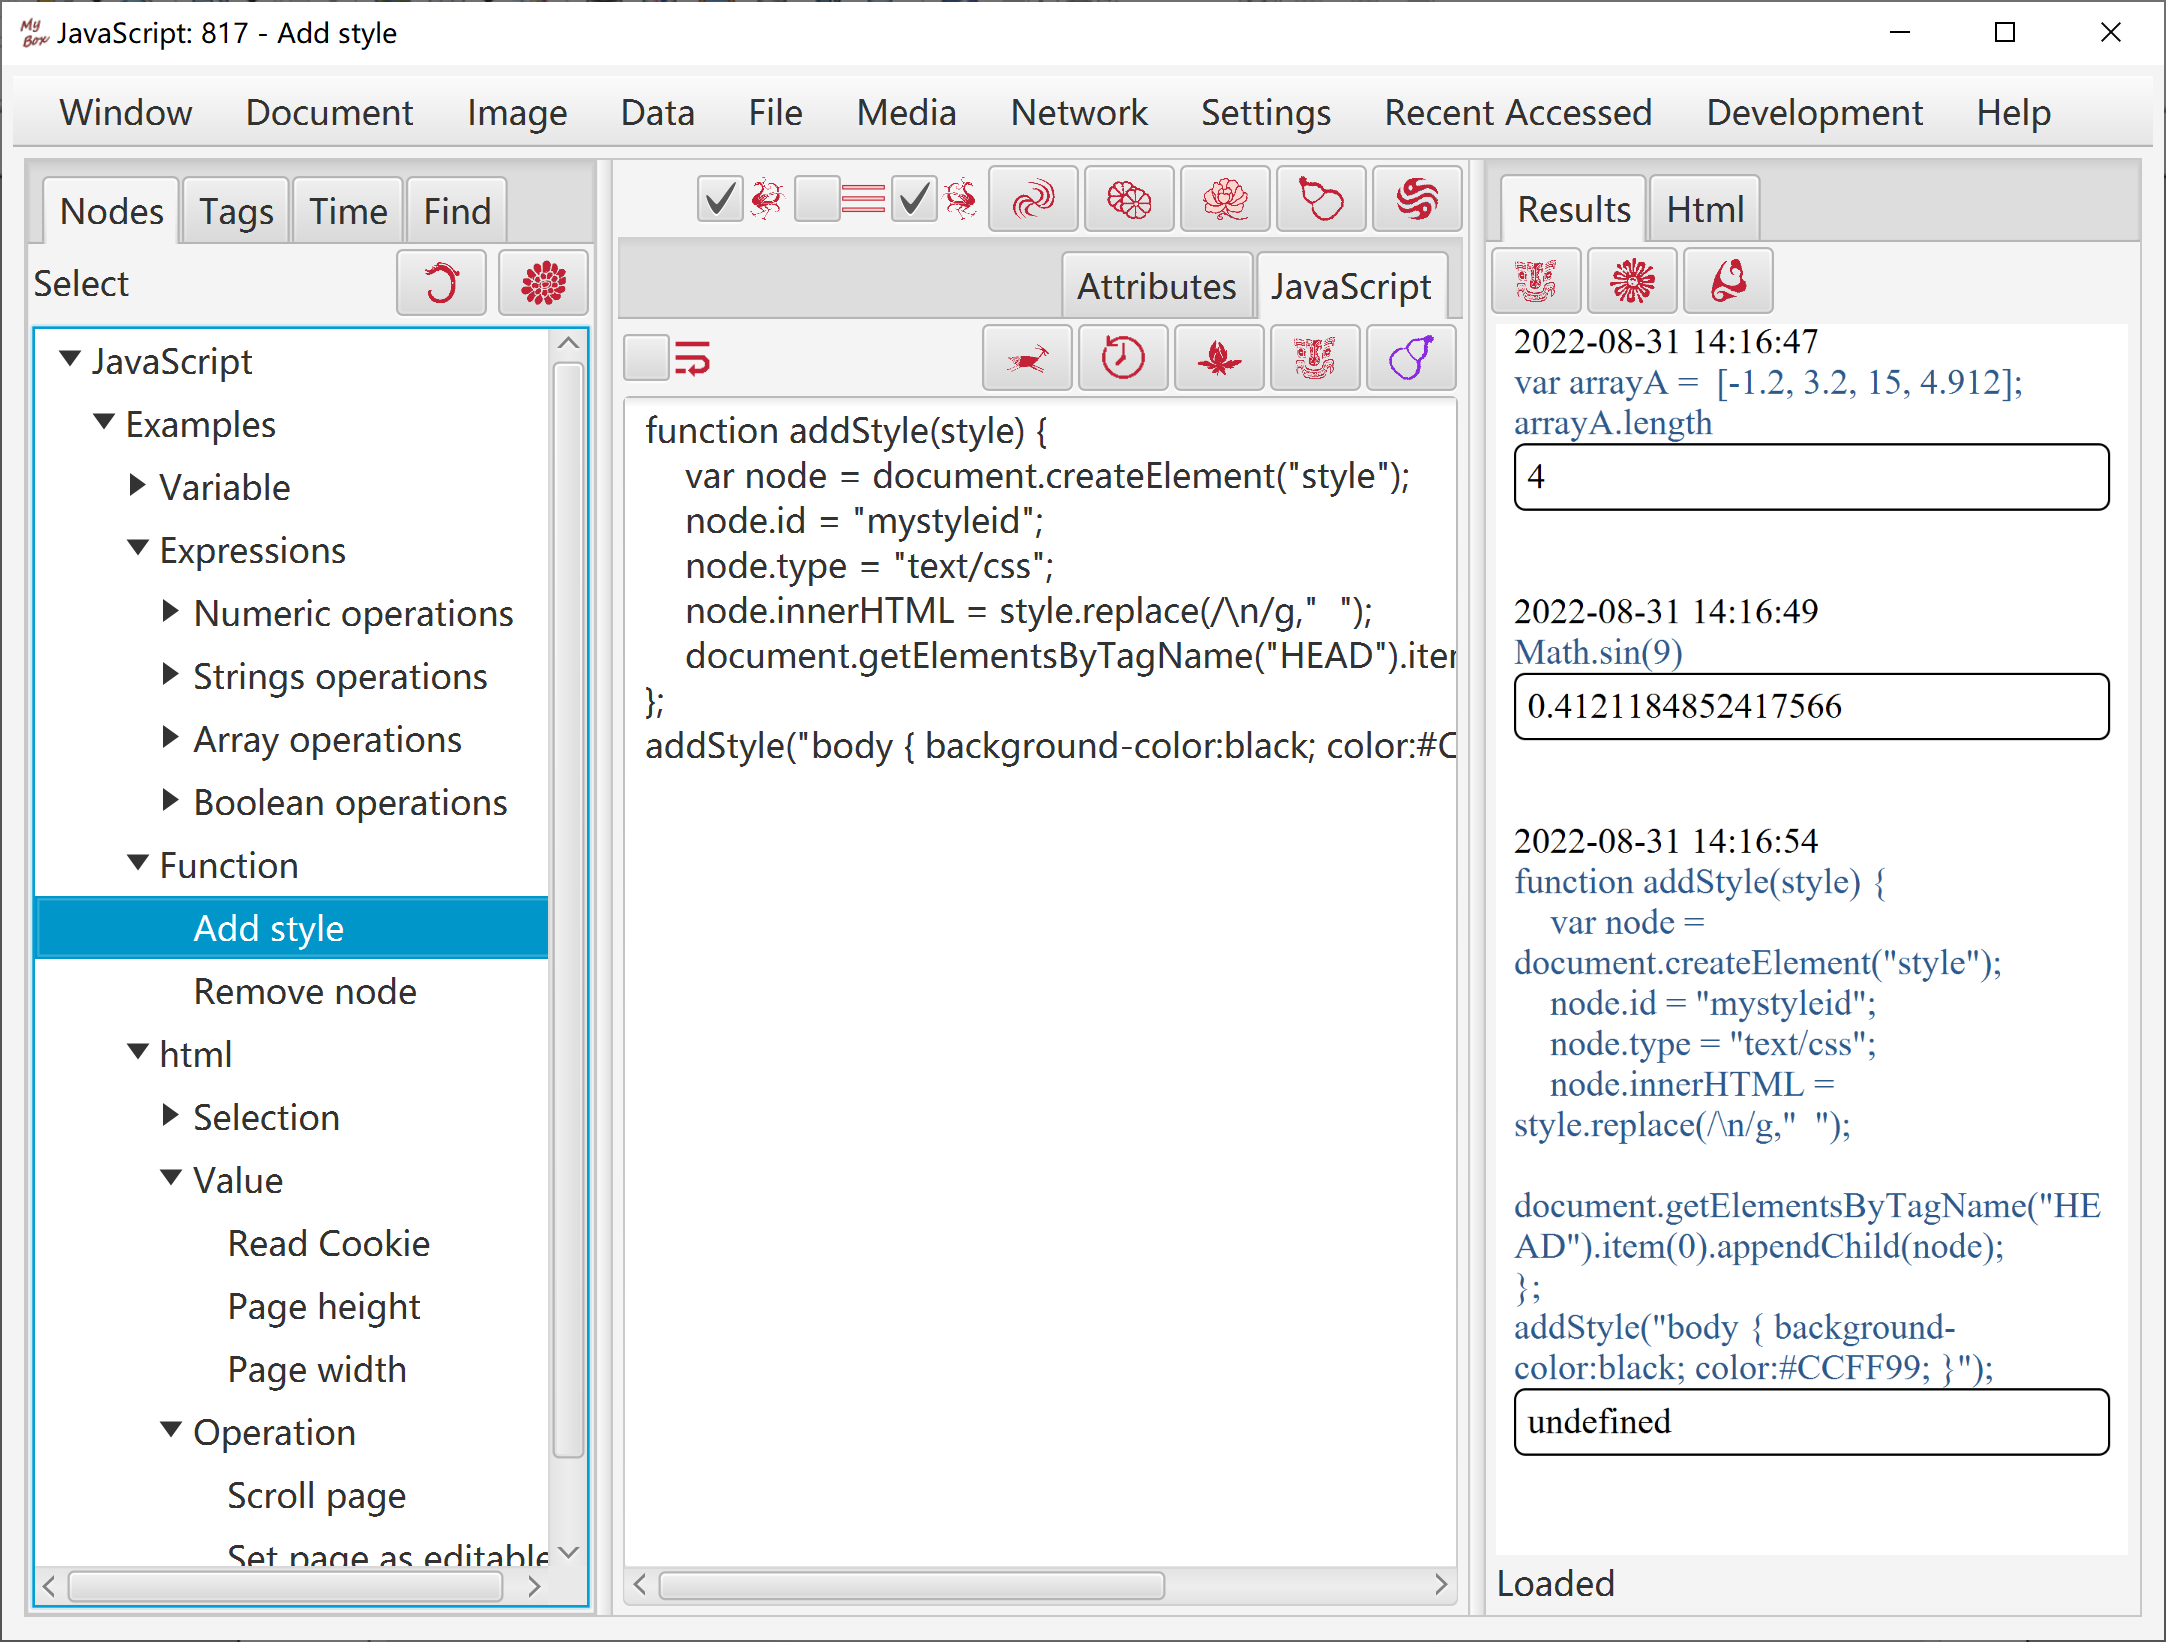
This tool helps to manage and run codes in JavaScript:
Edit codes in JavaScript.
The script can include any valid elments which WebEngine can parse(ECMAScript 6).
Run the script.
Its results are displayed in right pane. And it affects the web page in right pane too.
Javascript codes are organized in tree. Examples are provided.
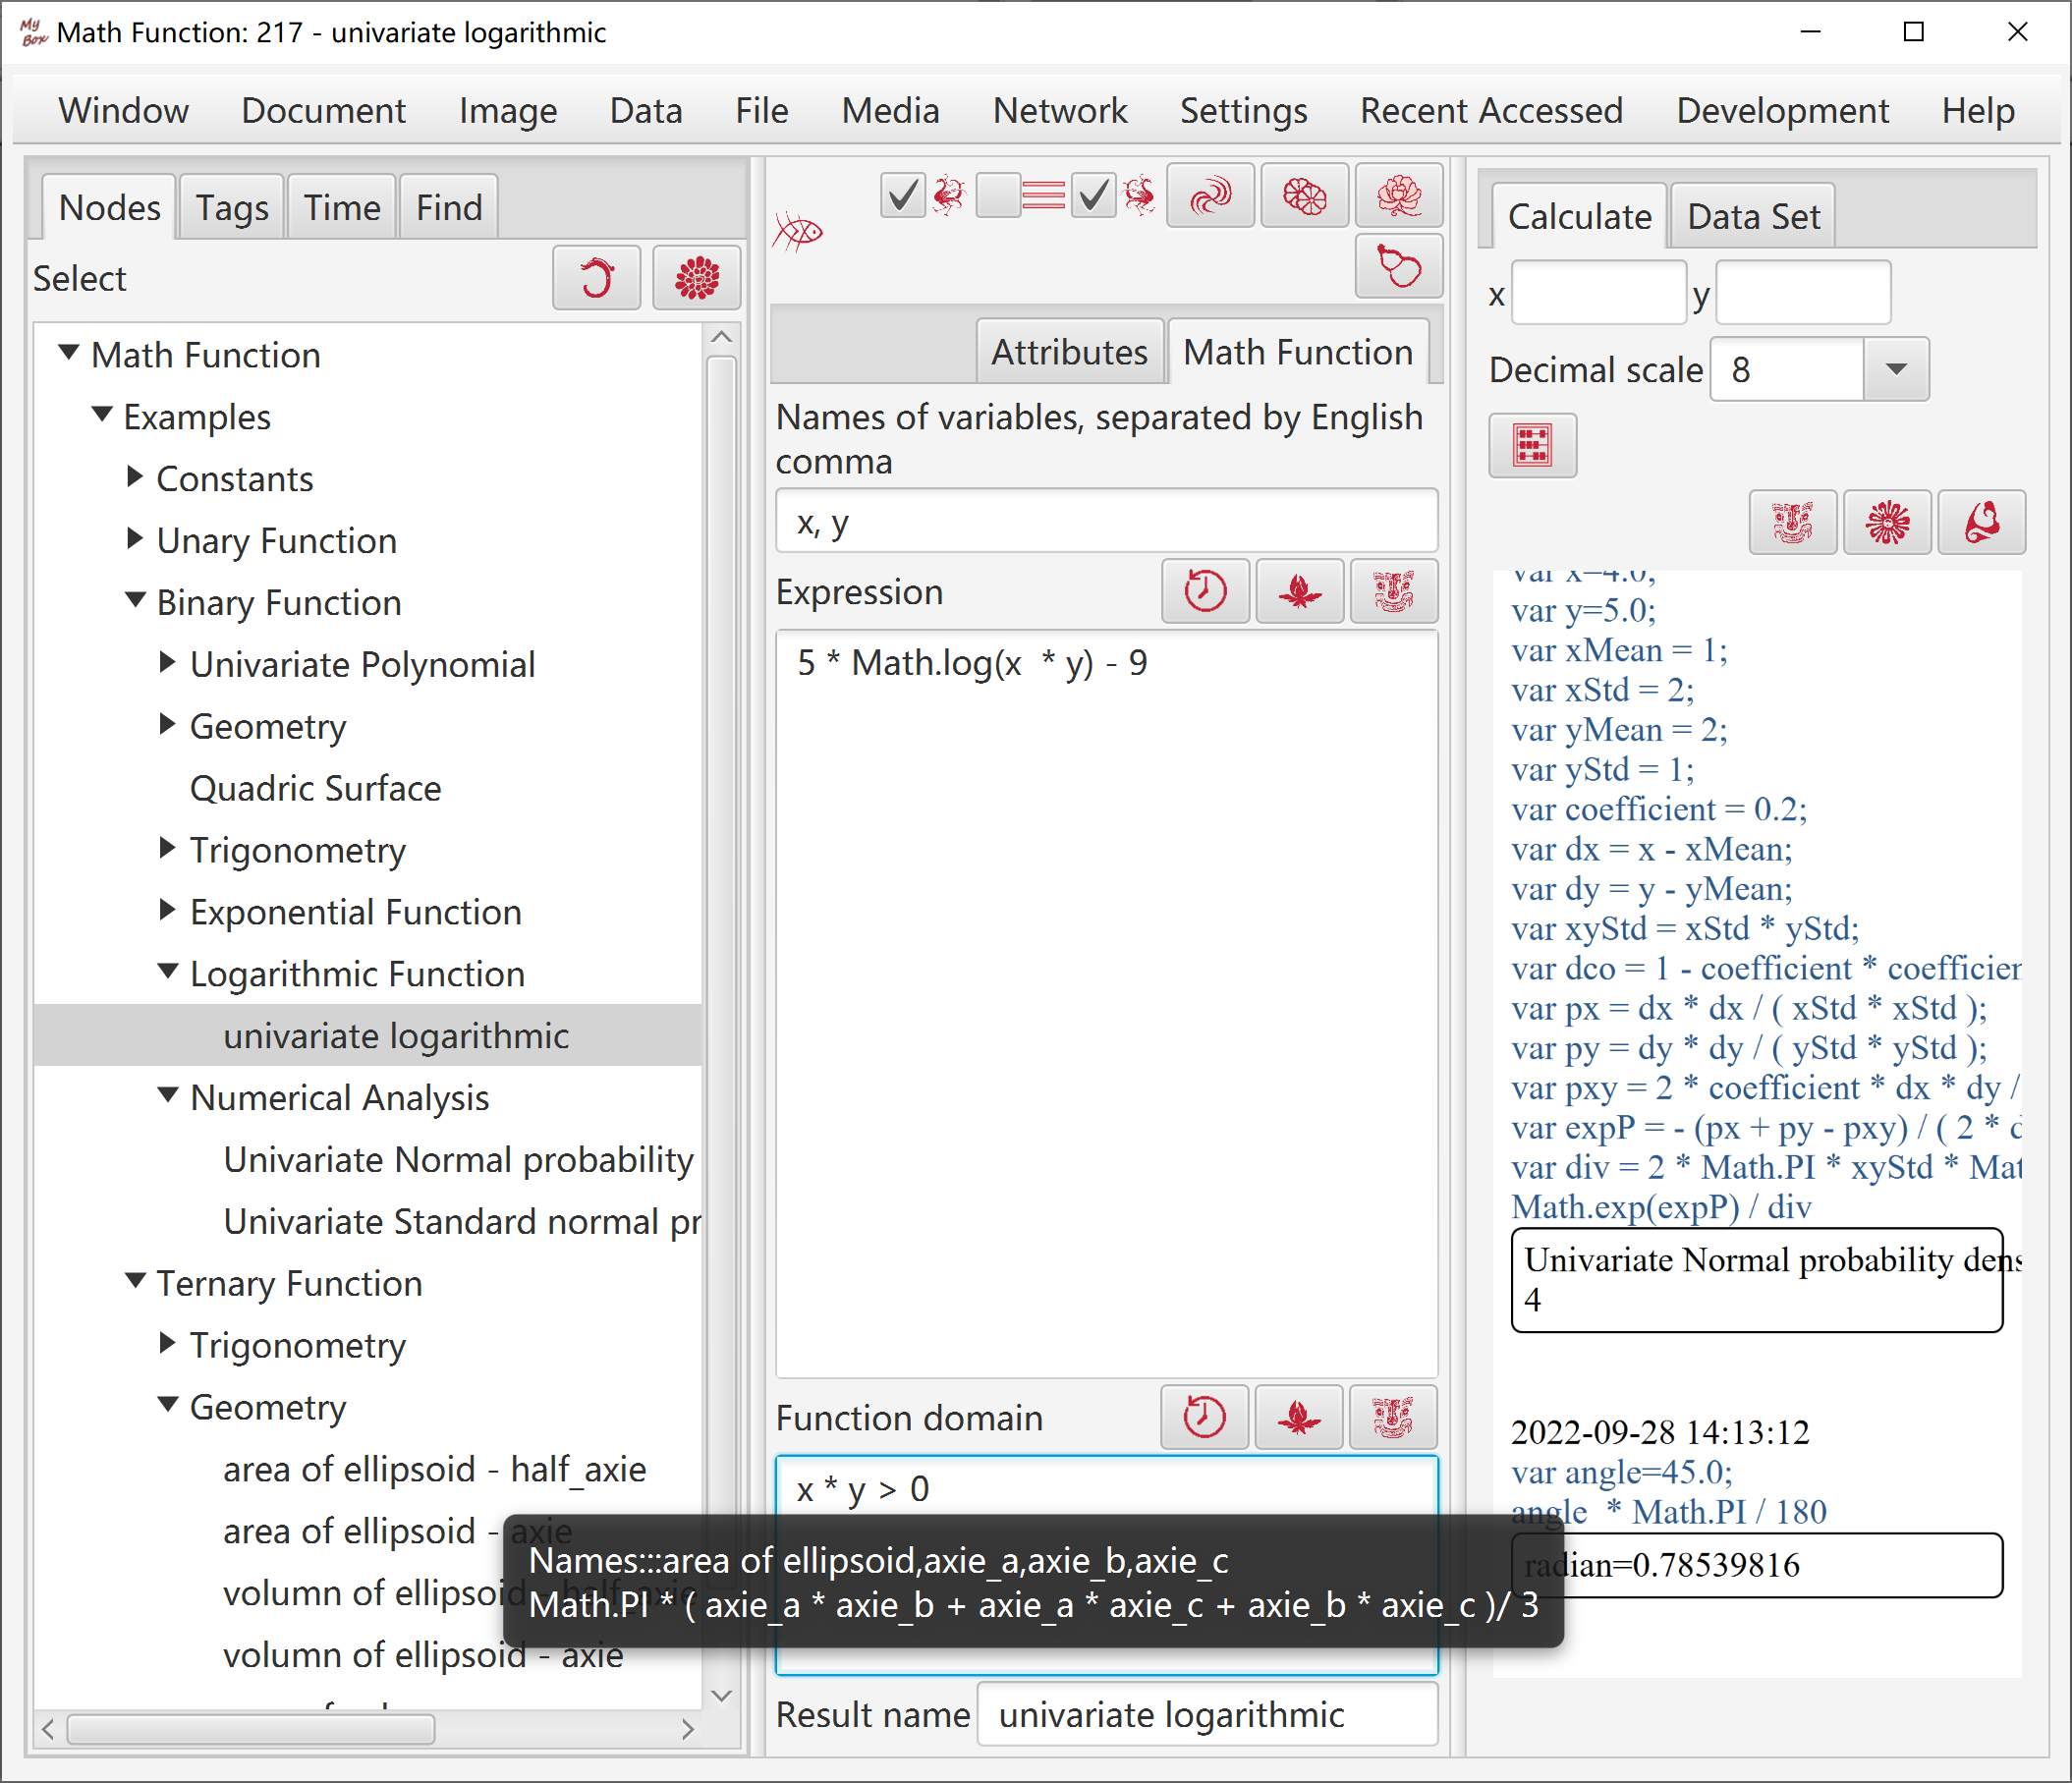
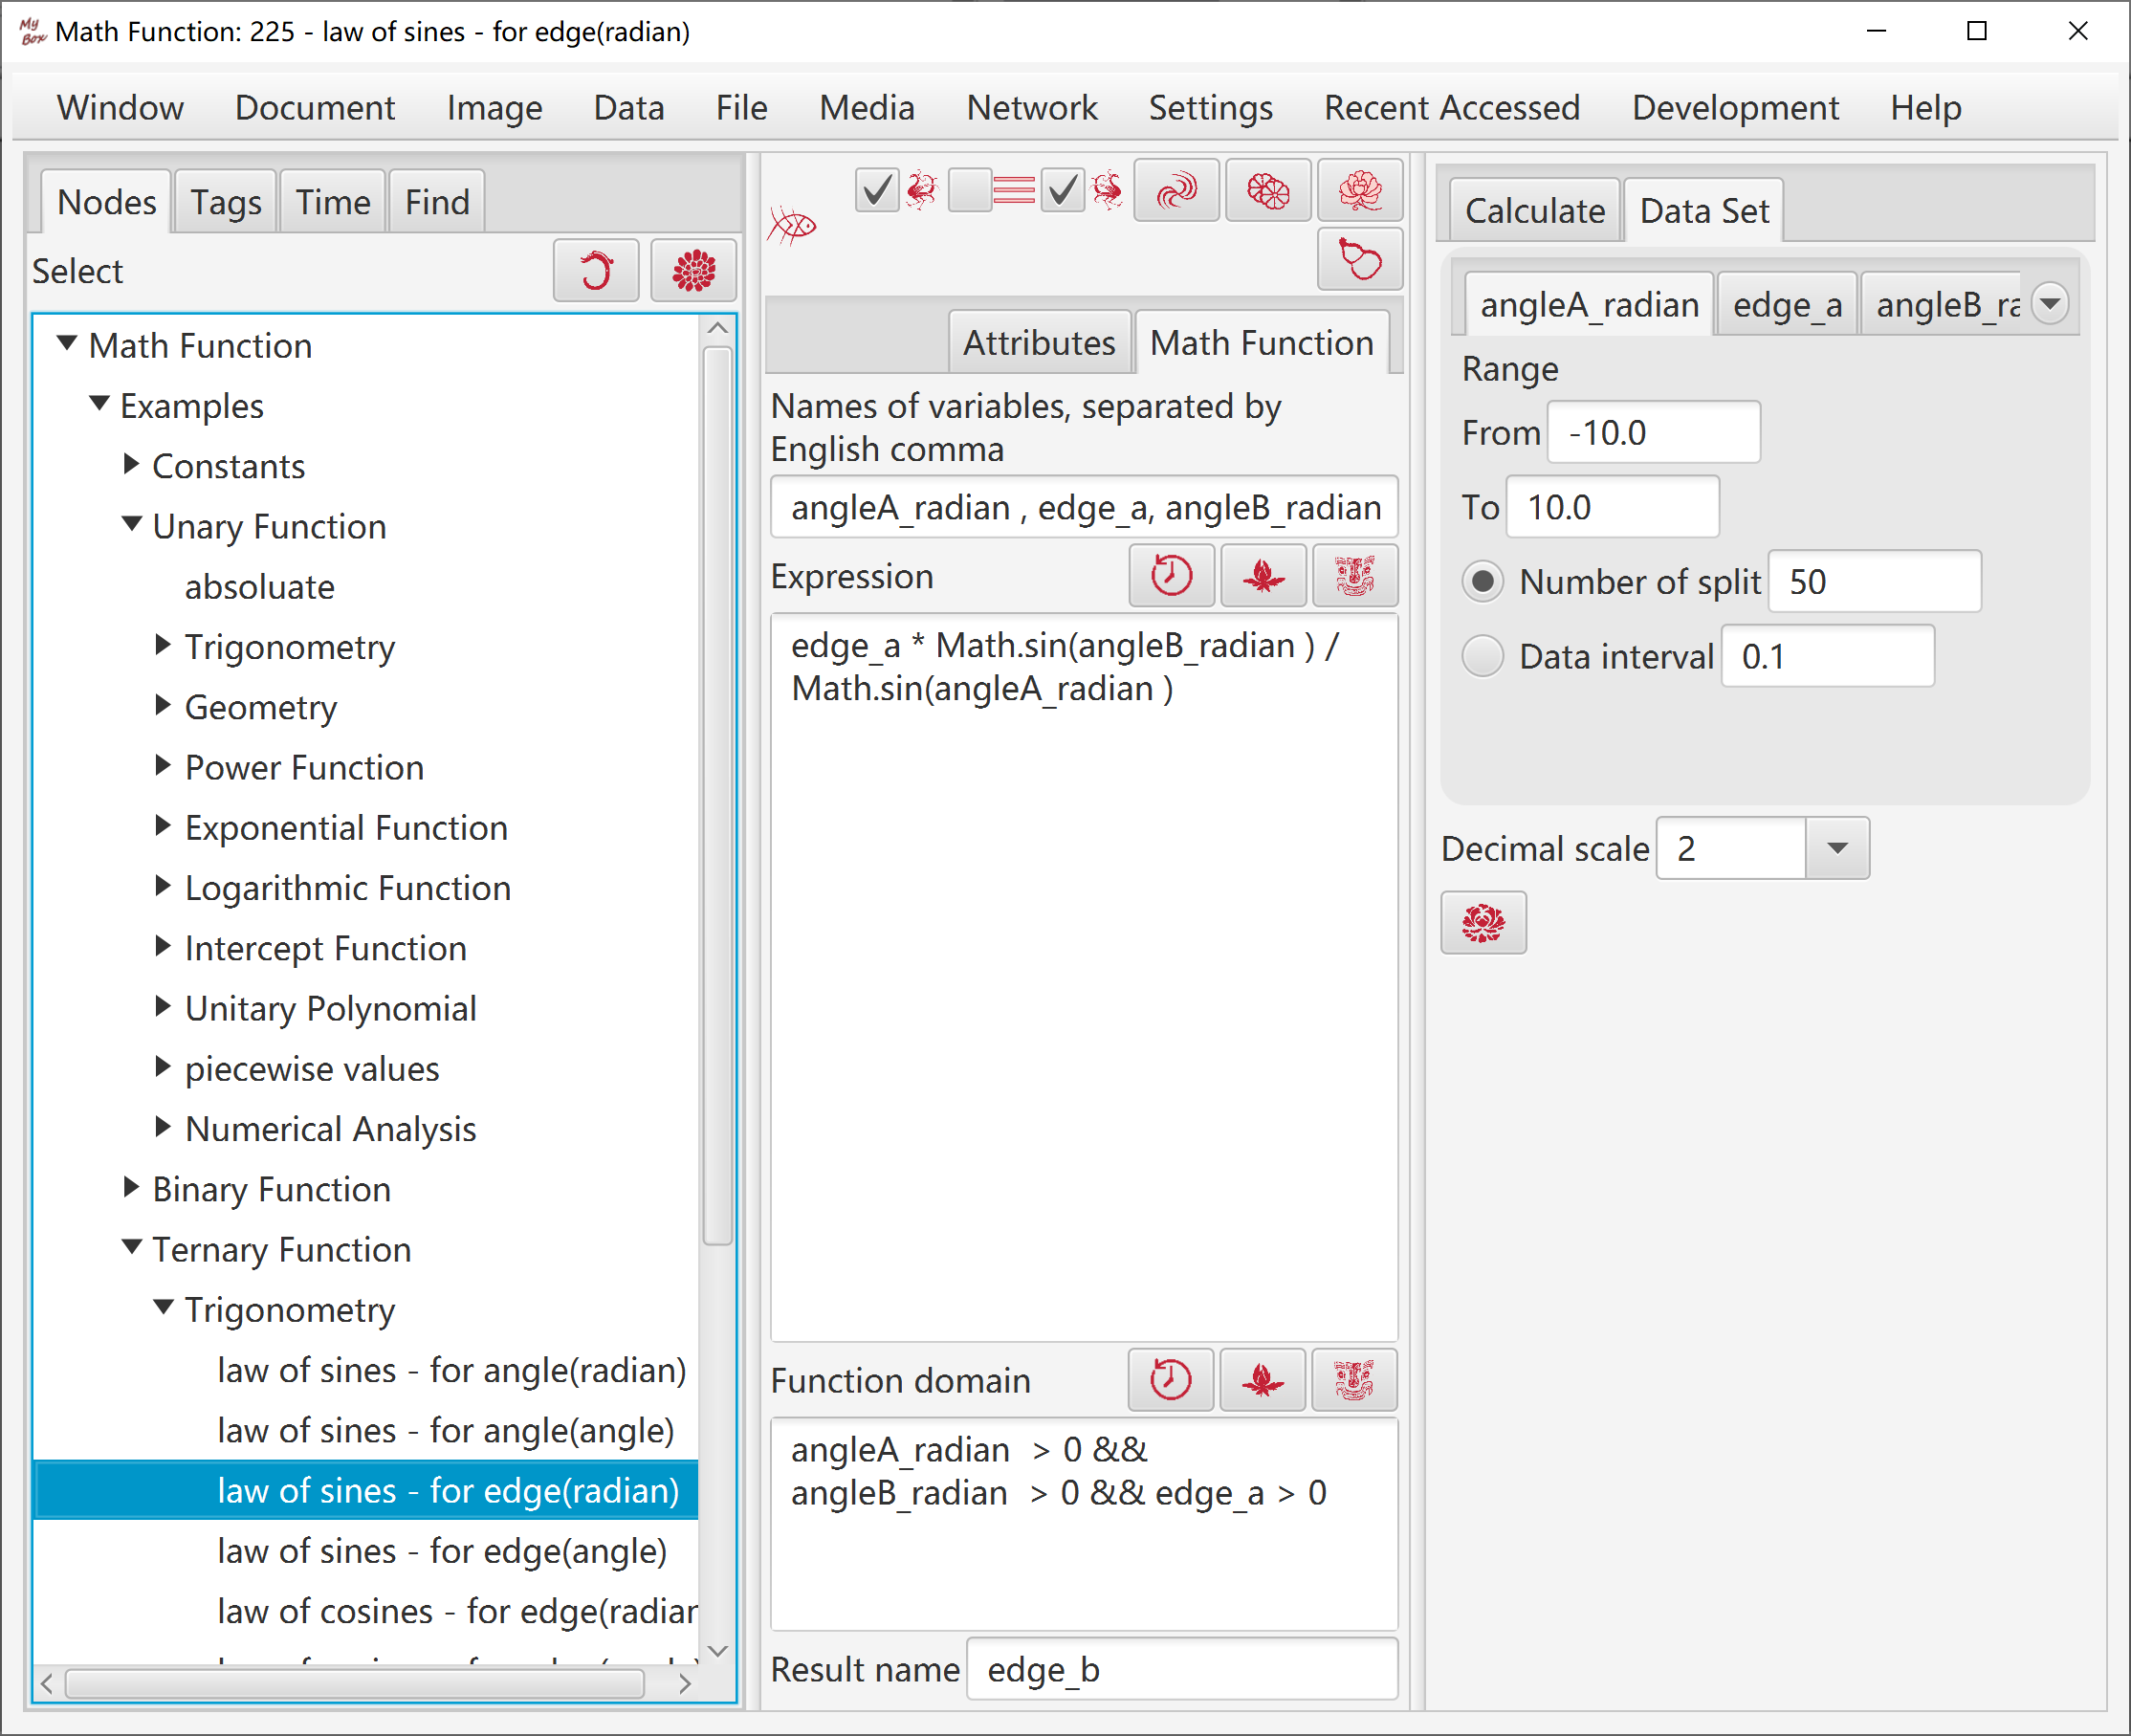
This tool helps to manage and calculate math functions:
List names of variables of the function, separated by English comma.
The names should satisfy rules of JavaScript:
Can include letters, number, underline '_', and unicodes(like Chinese).
Not start with number.
Define function expression as a piece of codes in JavaScript:
The script can include any valid elments which Nashorn can parse(ECMAScript 5.1).
It should be a number finally.
It can refer to the given variables, but should not declare them.
Define domain of the function as a piece of codes in JavaScript:
Blank means the domain is all of real numbers.
The script can include any valid elments which Nashorn can parse(ECMAScript 5.1).
It should be a boolean value(true or false) finally.
It can refer to the given variables, but should not declare them.
Give the name of calculation result.
Saved in tree.
Examples are provided.
When the tool calculates a script, 'var <variable_name>=<variable_value>;' are inserted in the head of it before the evaluation.
If script of domain is not blank, the given values of variables are inserted in it and check the result:
If true, continue to calculate the script of function expression.
Else this set of values is skipped.
With defined range, interval, and decimal scale, data set of the function can be generated.
To unary function, XY charts, including scatter chart and line chart, can be displayed.
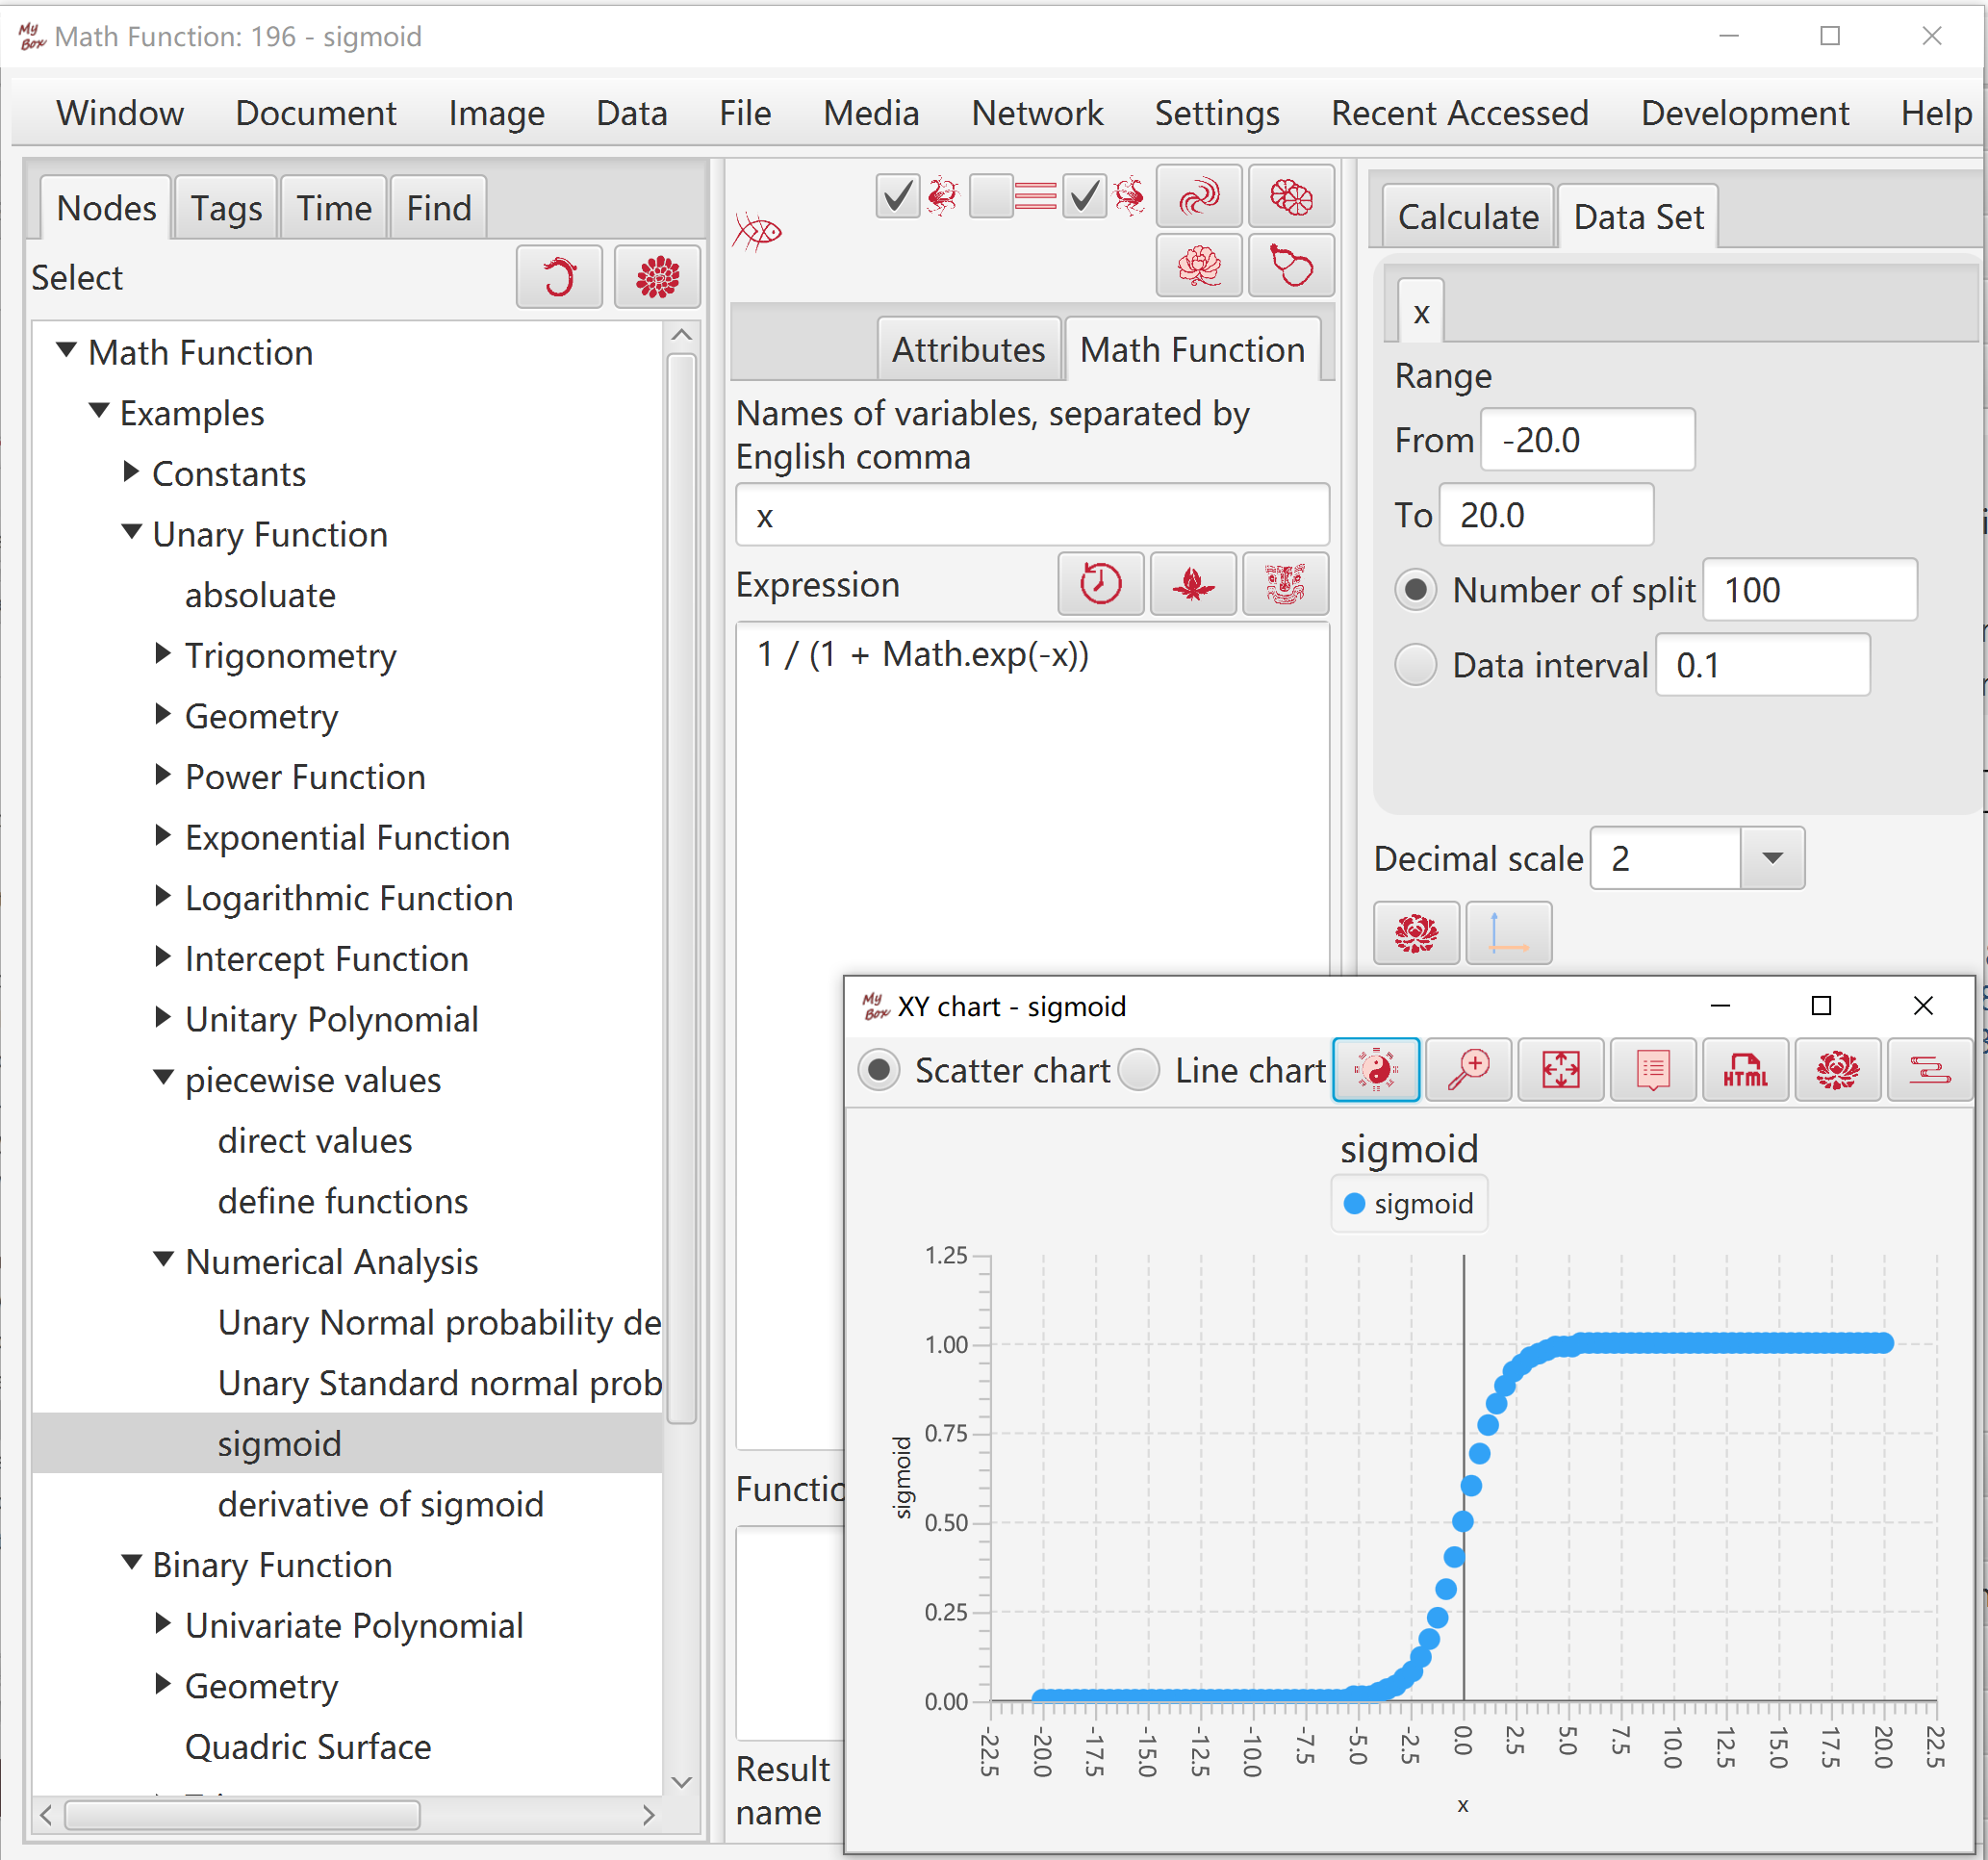
\
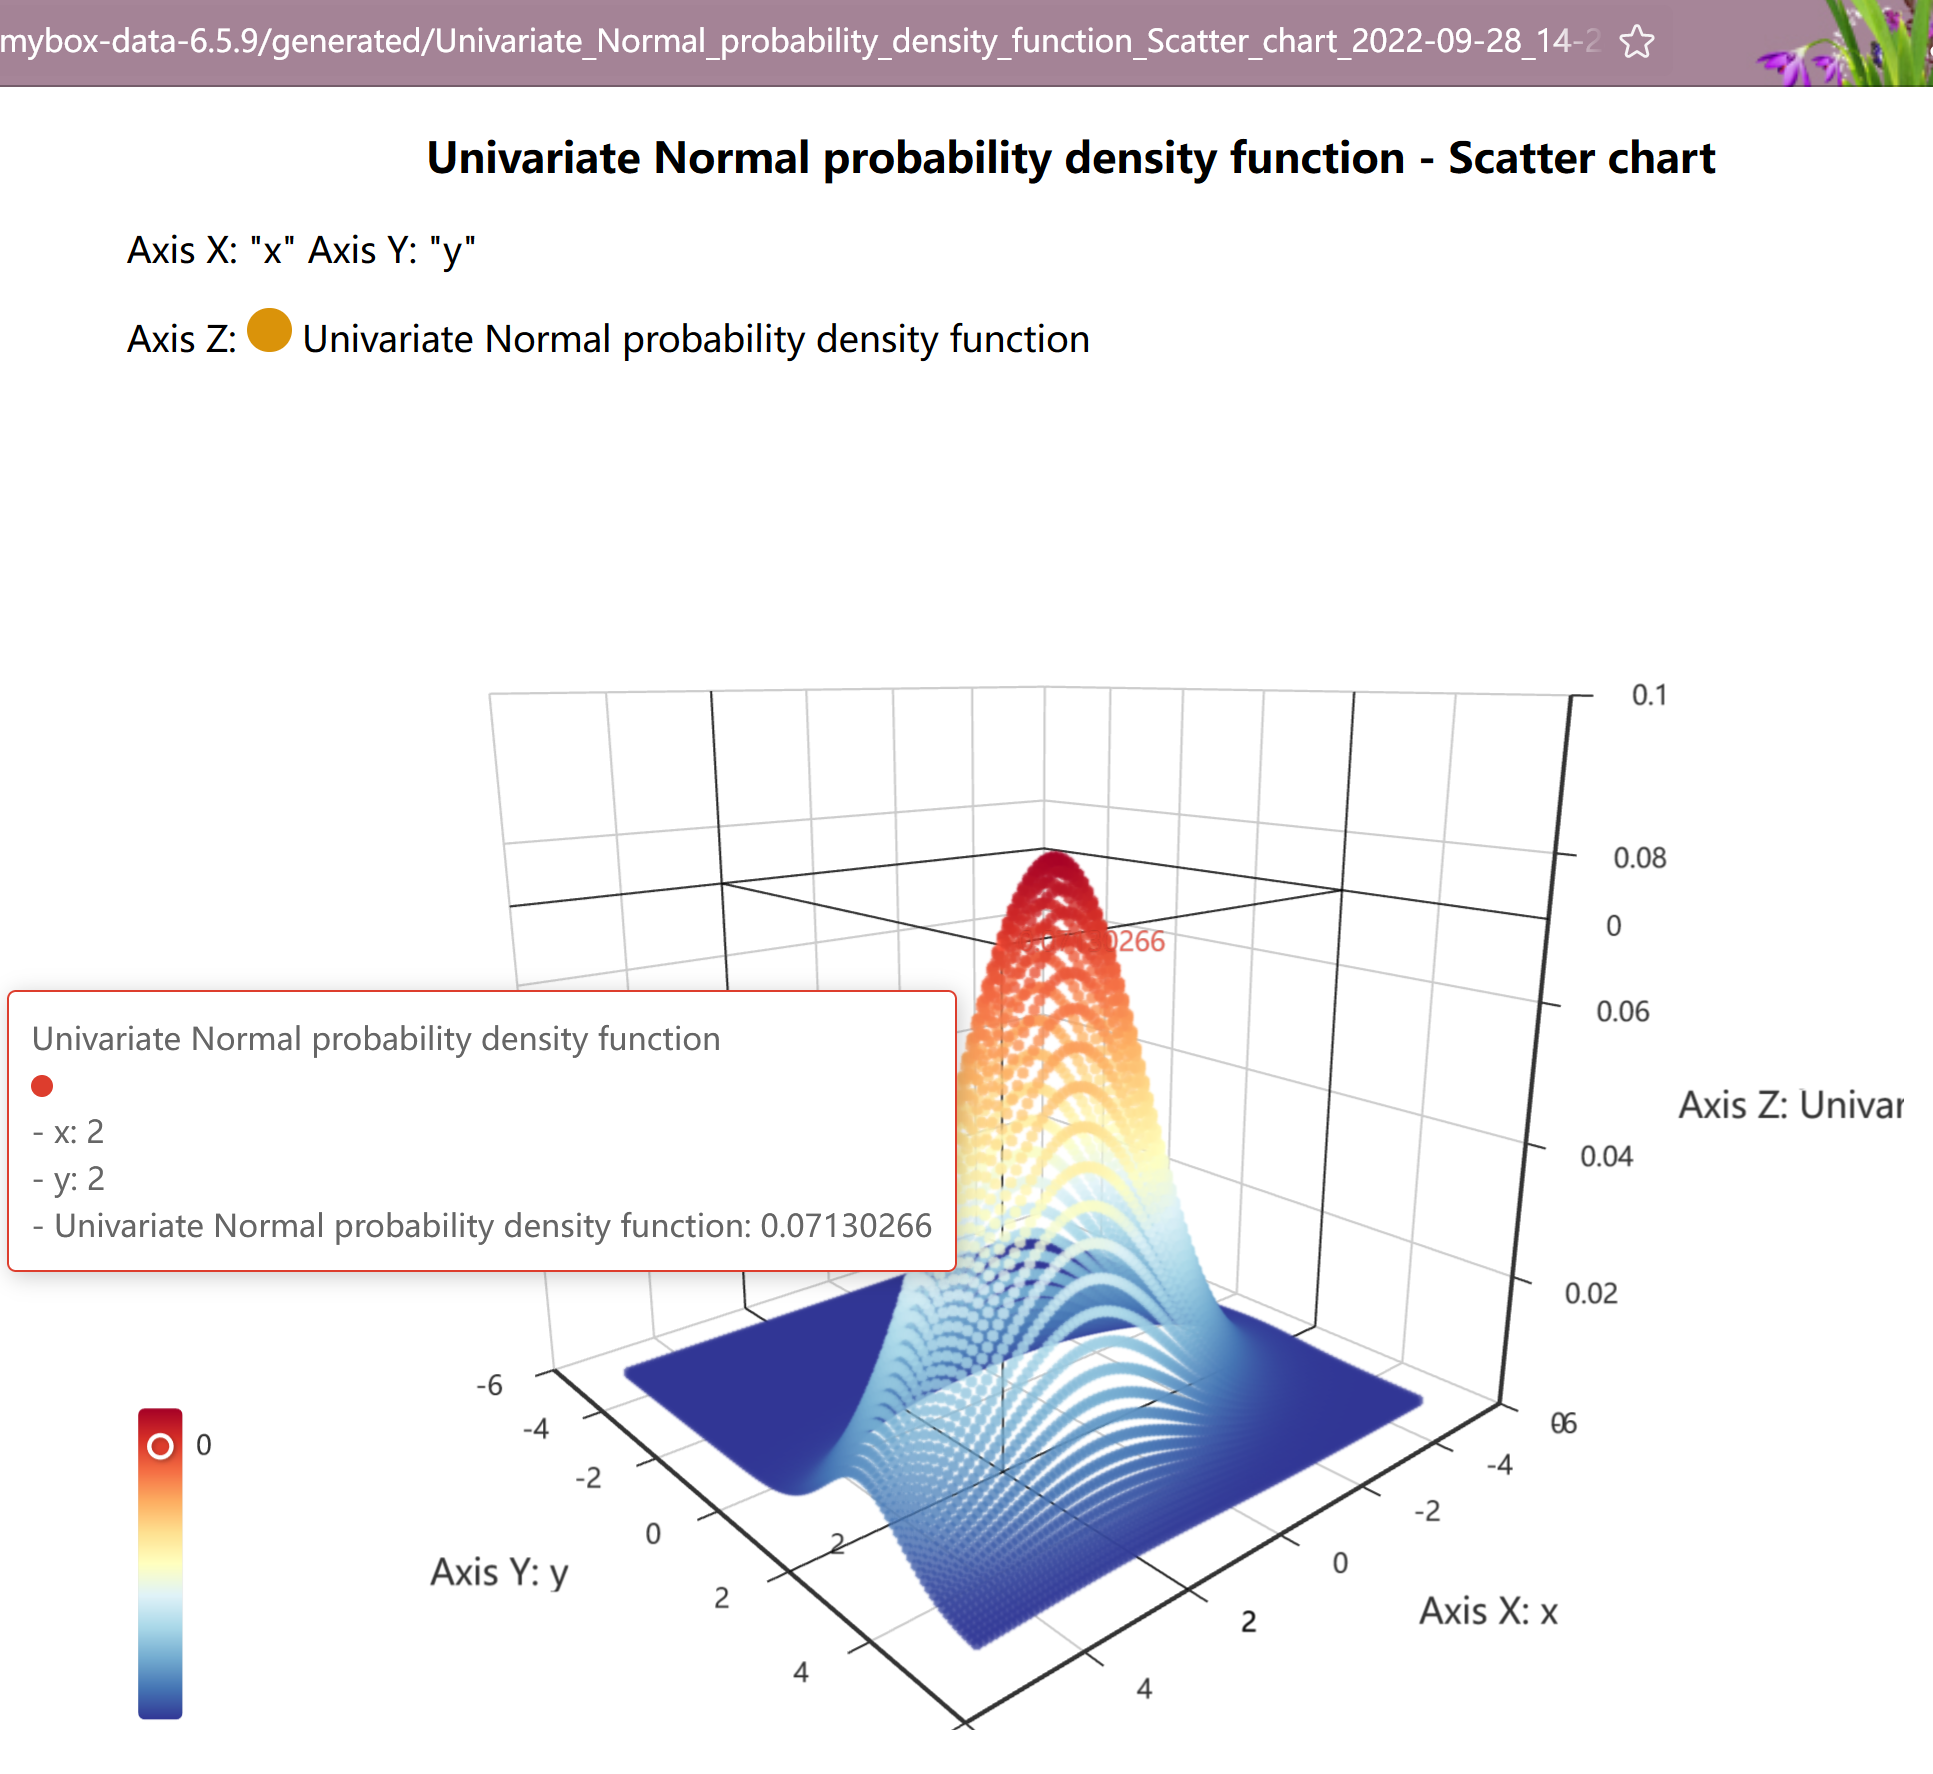
To binary function, XYZ chart, including 3D scatter chart and surface chart, can be displayed.
Null value of integer/long/short is the minimum value(MIN_VALUE)
Null value of double is the maximum value(Double.MAX_VALUE)
CGCS2000(China Geodetic Coordinate System), real locations and approximate to WGS-84(GPS).
GCJ-02(China encrypted coordinate), encrypted data with offsets of real locations.
WGS-84(GPS), real locations.
BD-09(Baidu encryted coordinate), based on GCJ-02.
Mapbar coordinate, based on GCJ-02.
When coordinate is unknown or invalid, the default value is CGCS2000.
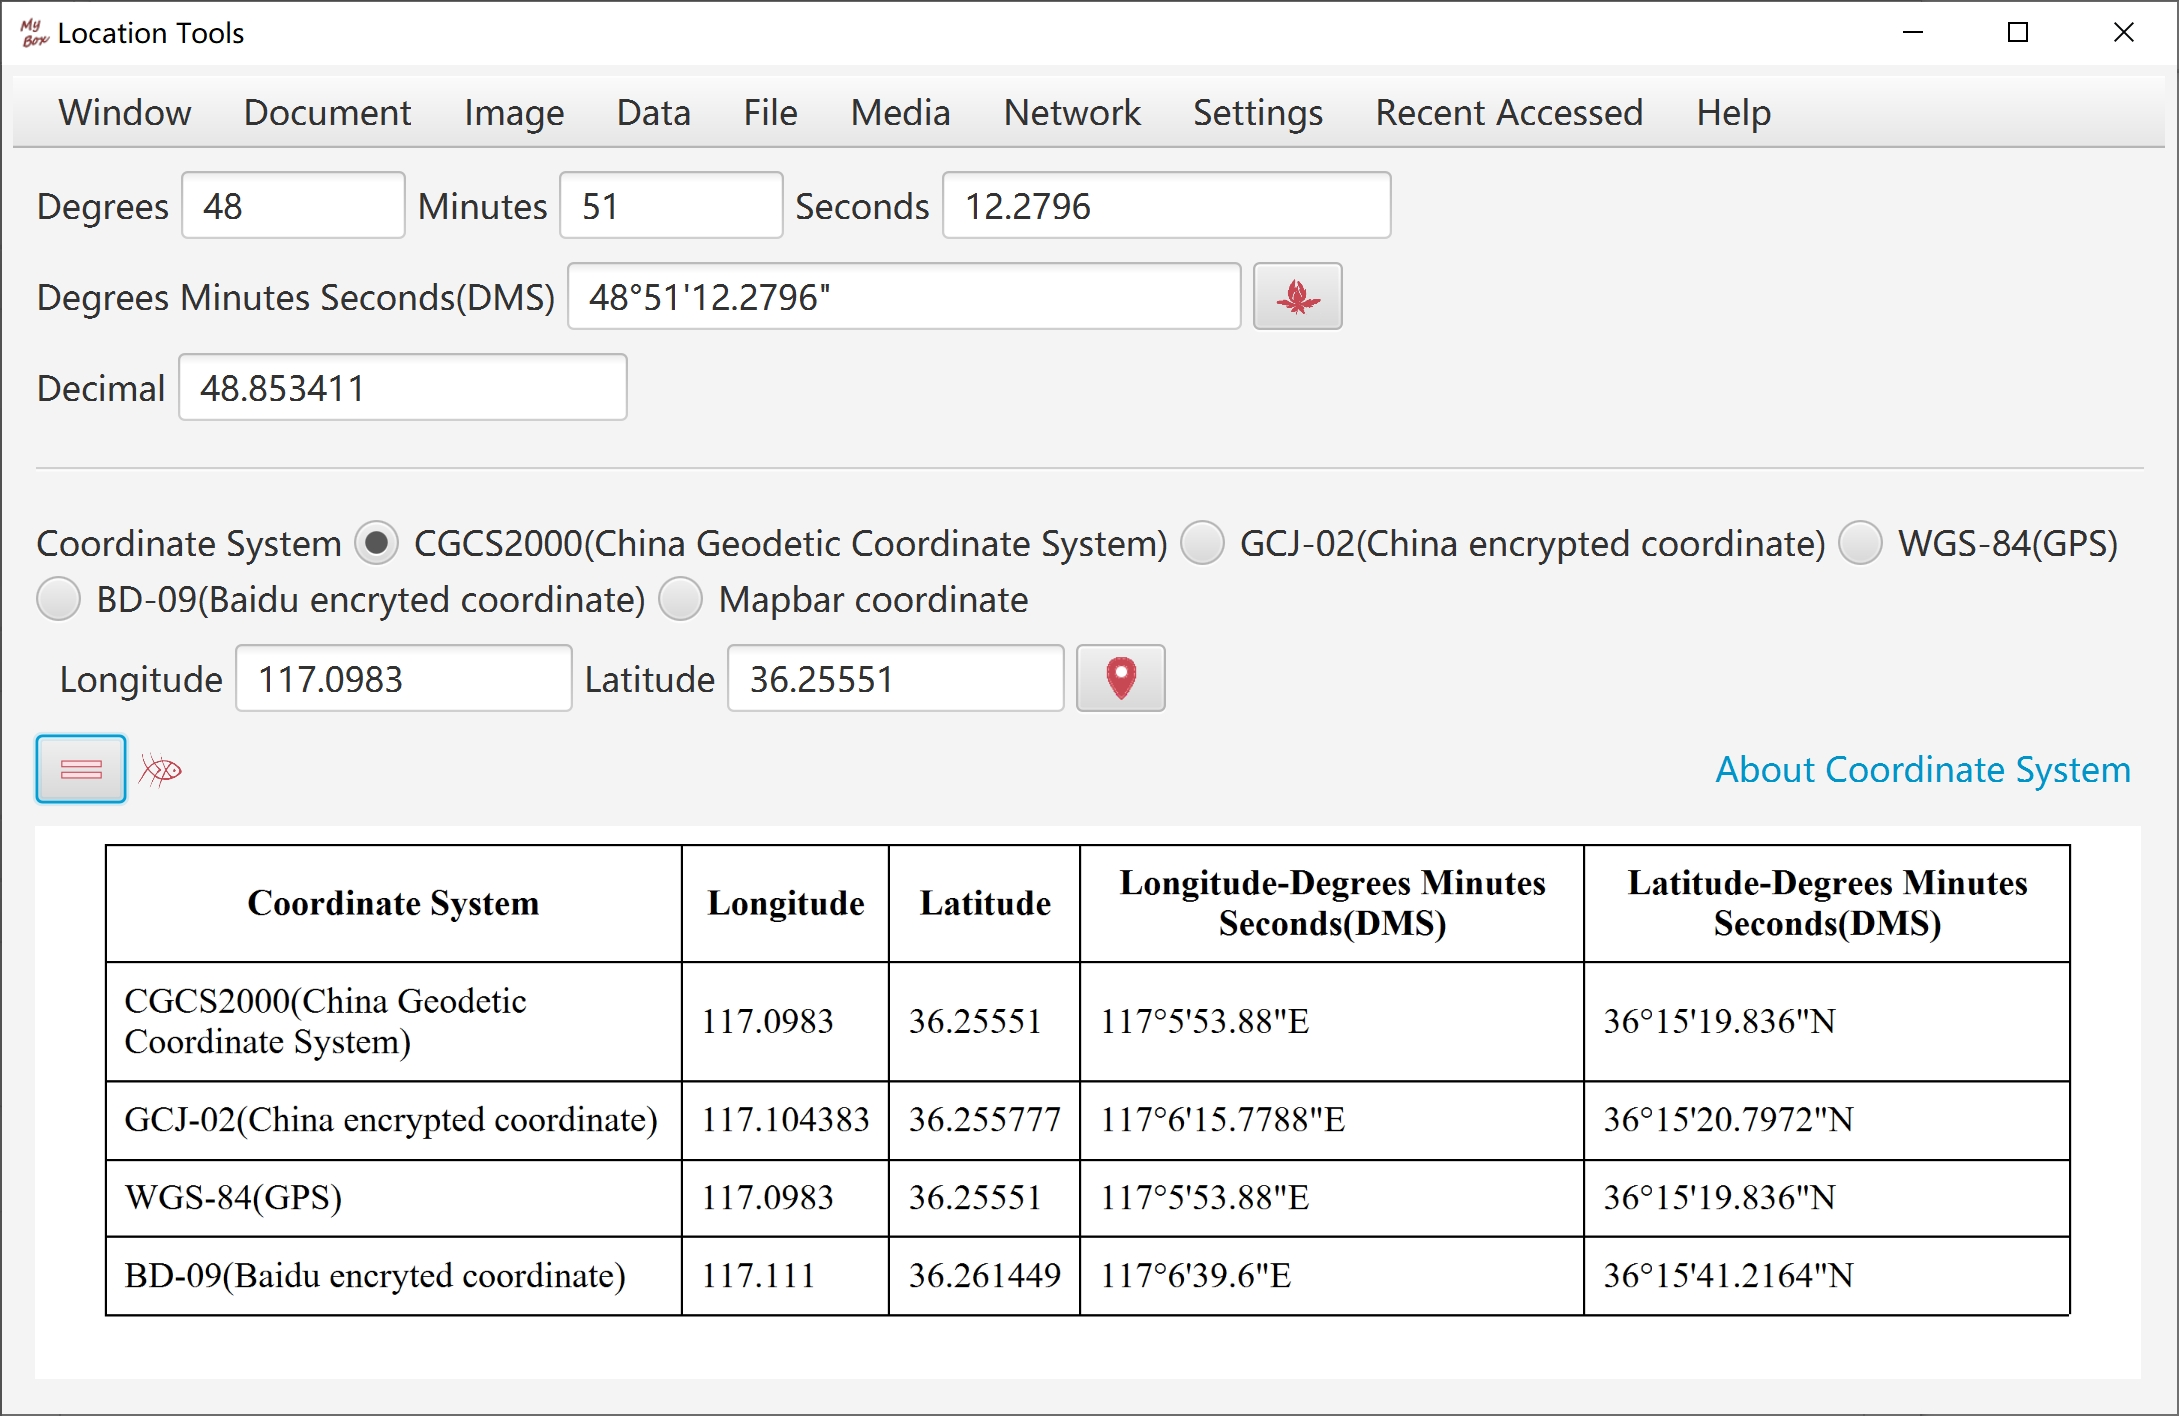
Decimal values of longitude and latitude, instead of Degrees Minutes Seconds(DMS), are used when data handled.
MyBox provides "Location Tools" to convert coordinate values between decimal and DMS.
Valid range of longitude is `-180~180`, and valid range of latitude is `-90~90`.
Date and Time, like: 2014-06-11 13:51:33
Date, like: 2014-06-11
Year, like: 2014
Month, like: 2014-06
Time, like: 13:51:33
Time with Milliseconds, like: 13:51:33.261
Date and Time with Milliseconds, like: 2014-06-11 13:51:33.261
Date and Time with zone, like: 2020-09-27 12:29:29 +0800
Date and Time with Milliseconds and zone, like: 2020-09-27 12:29:29.713 +0800
"T" can be written or omitted between date and time. "2014-06-11T13:51:33" equals to "2014-06-11 13:51:33".
"0 AD" = "1 BC" = "0" = "-0" = "0000" = "-0000" = "0001-01-01 00:00:00 BC" = "公元前1" = "公元前0001-01-01 00:00:00"
"1 AD" = "1" = "0001" = "0001-01-01 00:00:00" = "0001-01-01 00:00:00 AD" = "公元1" = "公元0001-01-01 00:00:00"
"202 BC" = "-203" = "-0203" = "-0203-01-01 00:00:00" = "0202-01-01 00:00:00 BC" = "公元前202" = "公元前0202-01-01 00:00:00"
"202 AD" = "202" = "0202" = "0202-01-01 00:00:00" = "0202-01-01 00:00:00 AD" = "公元202" = "公元0202-01-01 00:00:00"
2020-07-13 11:30:59
-2020-07-13 11:30:59
-581-01-23
960
公元960
公元前770-12-11
公元前1046-03-10 10:10:10
202 BC
960-01-23 AD
1046-03-10 10:10:10 BC
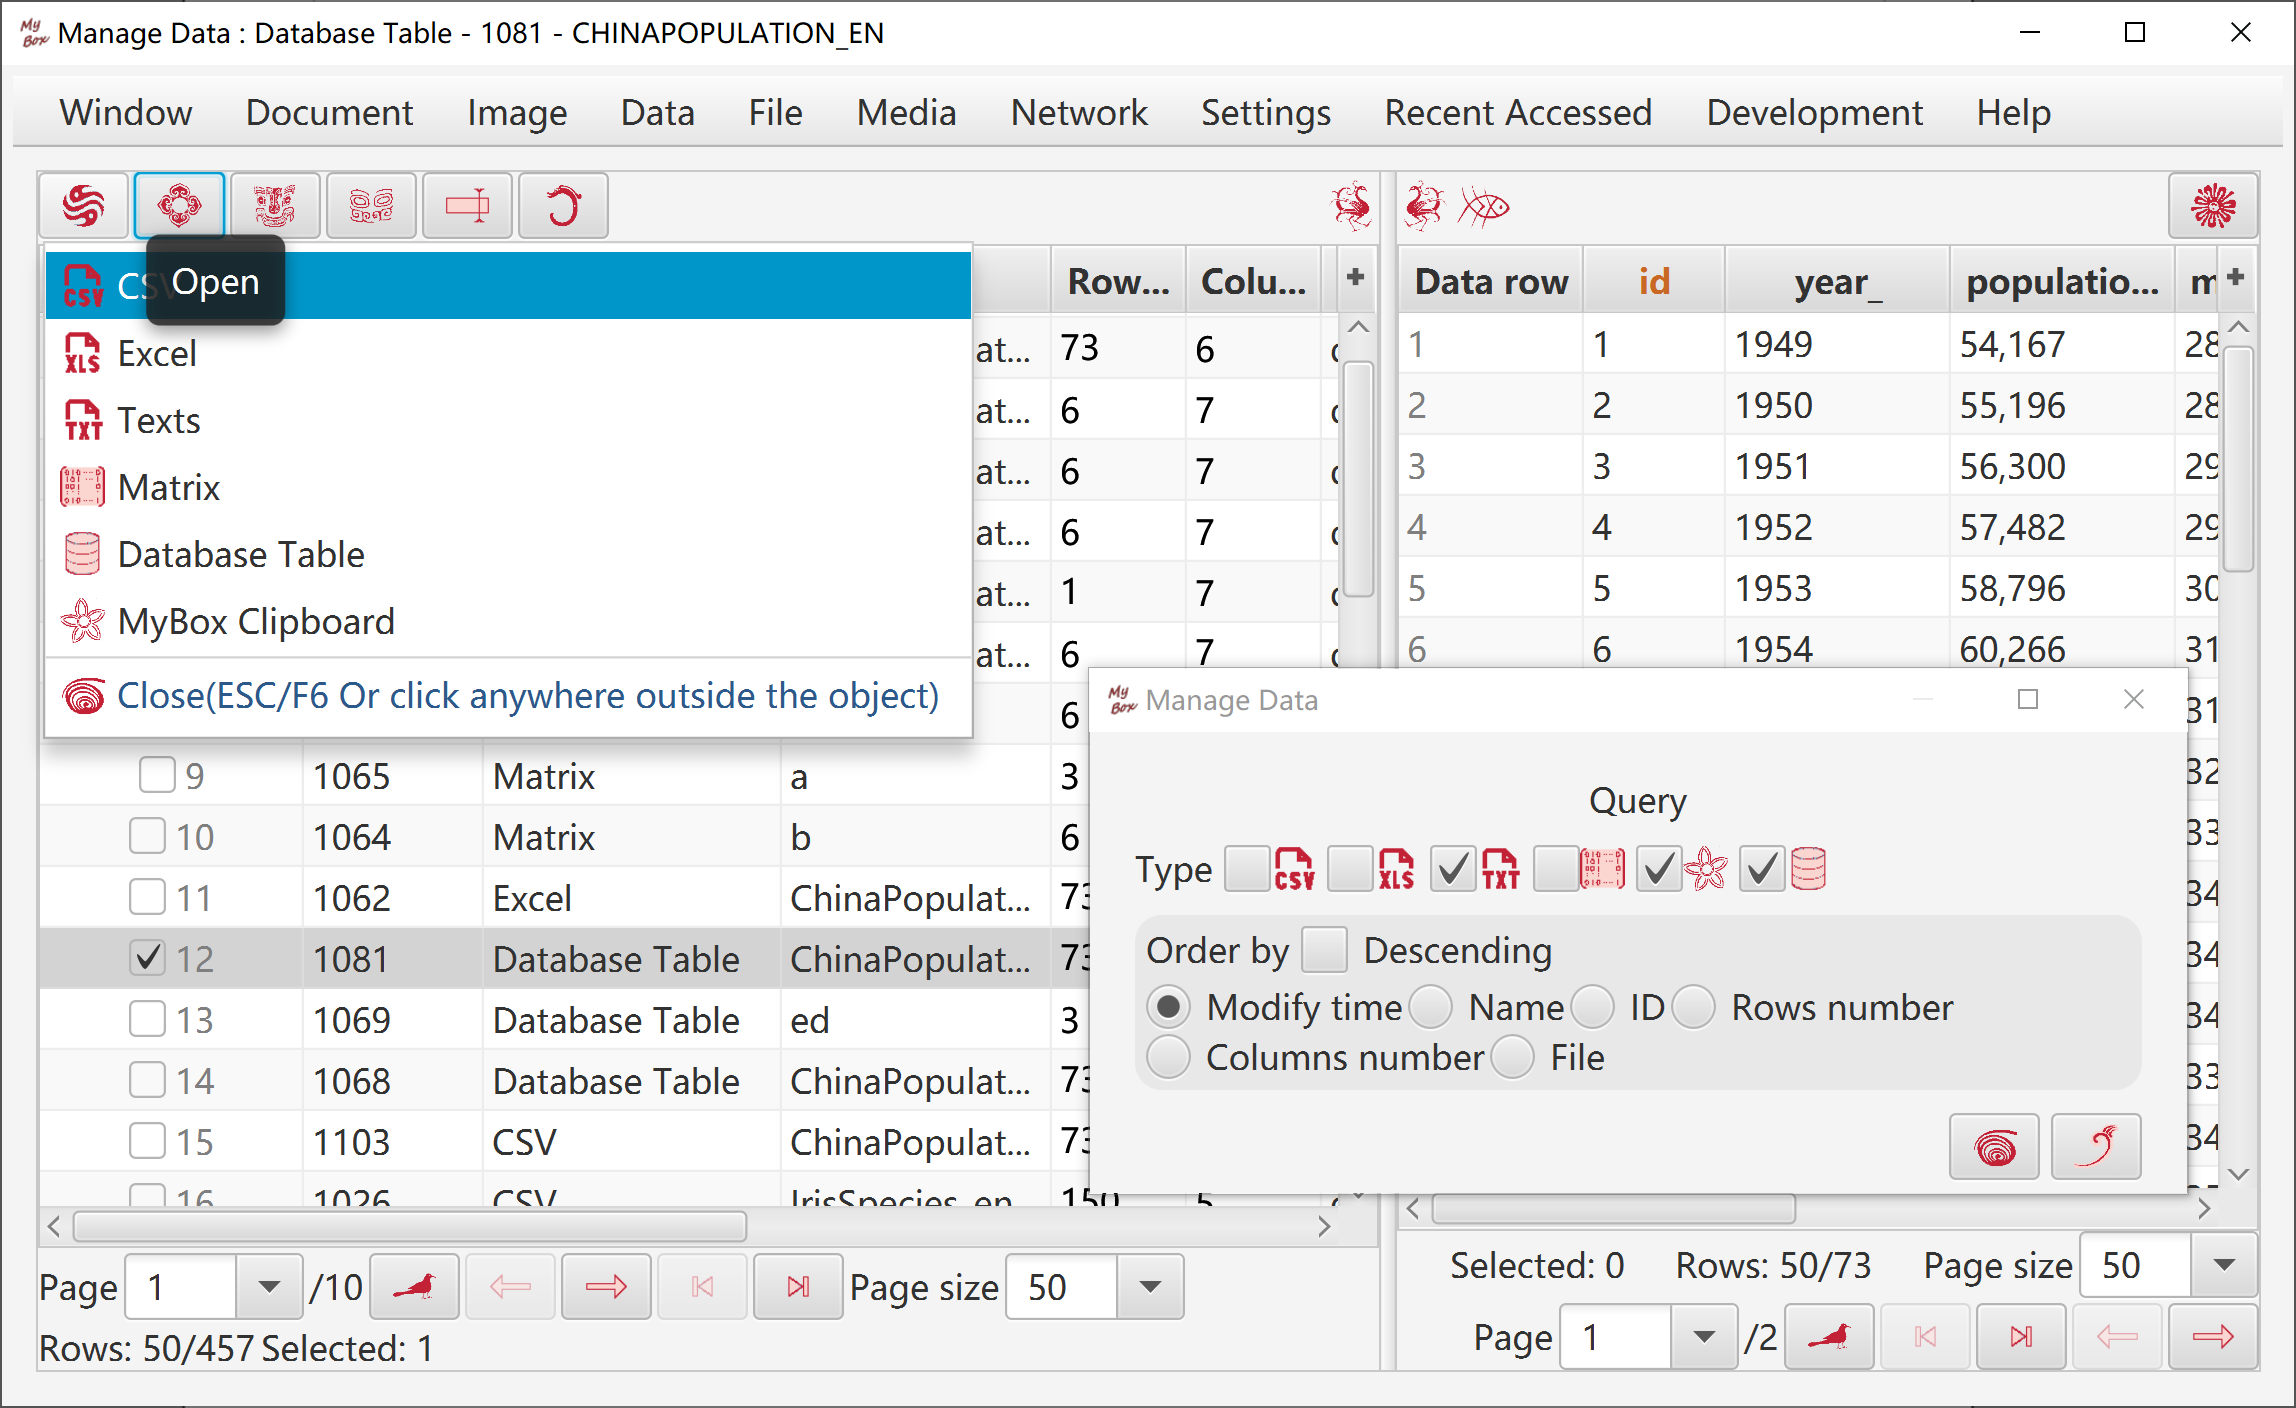
Add/Delete/Edit/Copy/Clear/Refresh data.
Query data:
Define and manage query conditions.
Current query conditions is displayed on tab "information".
Data satisfying current query condition are displayed in tab "Data" in pages.
Data rows can be displayed in different colors as values of some column.
Import data in csv format:
File encoding is UTF-8 or ASCII.
The first line defines data headers which are delimited by English commas.
Followed each line defines one data row. Data fields are delimited by English commas.
The order of fields is not cared.
Necessary fields must occupy their locations, but need not have valid values(related to data).
Select whether replace existed data. Predefined data or example data always replace existed values.
Export data:
Define and manage export conditions.
Export data fields can be selected.
Export file format can be selected: csv, xml, json, xlsx, html, pdf.
Select maximum lines to split files.
Can export current data page.
Delete/Clear data:
Define and manage delete conditions.
Predefined data can not be deleted.
Referred data(like foreign keys) can not be deleted.
Define, manage, and use "Conditions":
"Conditions" are used to execute querying, deleting, or exporting.
Set conditions in panes:
Data conditions are organized as trees. Multiple nodes can be selected.
Multiple data fields can be selected as sorting conditions, and their orders can be changed.
Edit condition: Title, where, order by, fetch. They will be merged as final conditon.
Manage conditons: Add/delete/edit/copy.
Conditions ever executed are saved automatically.
Recently visited conditions are listed in pop window of the buttons.
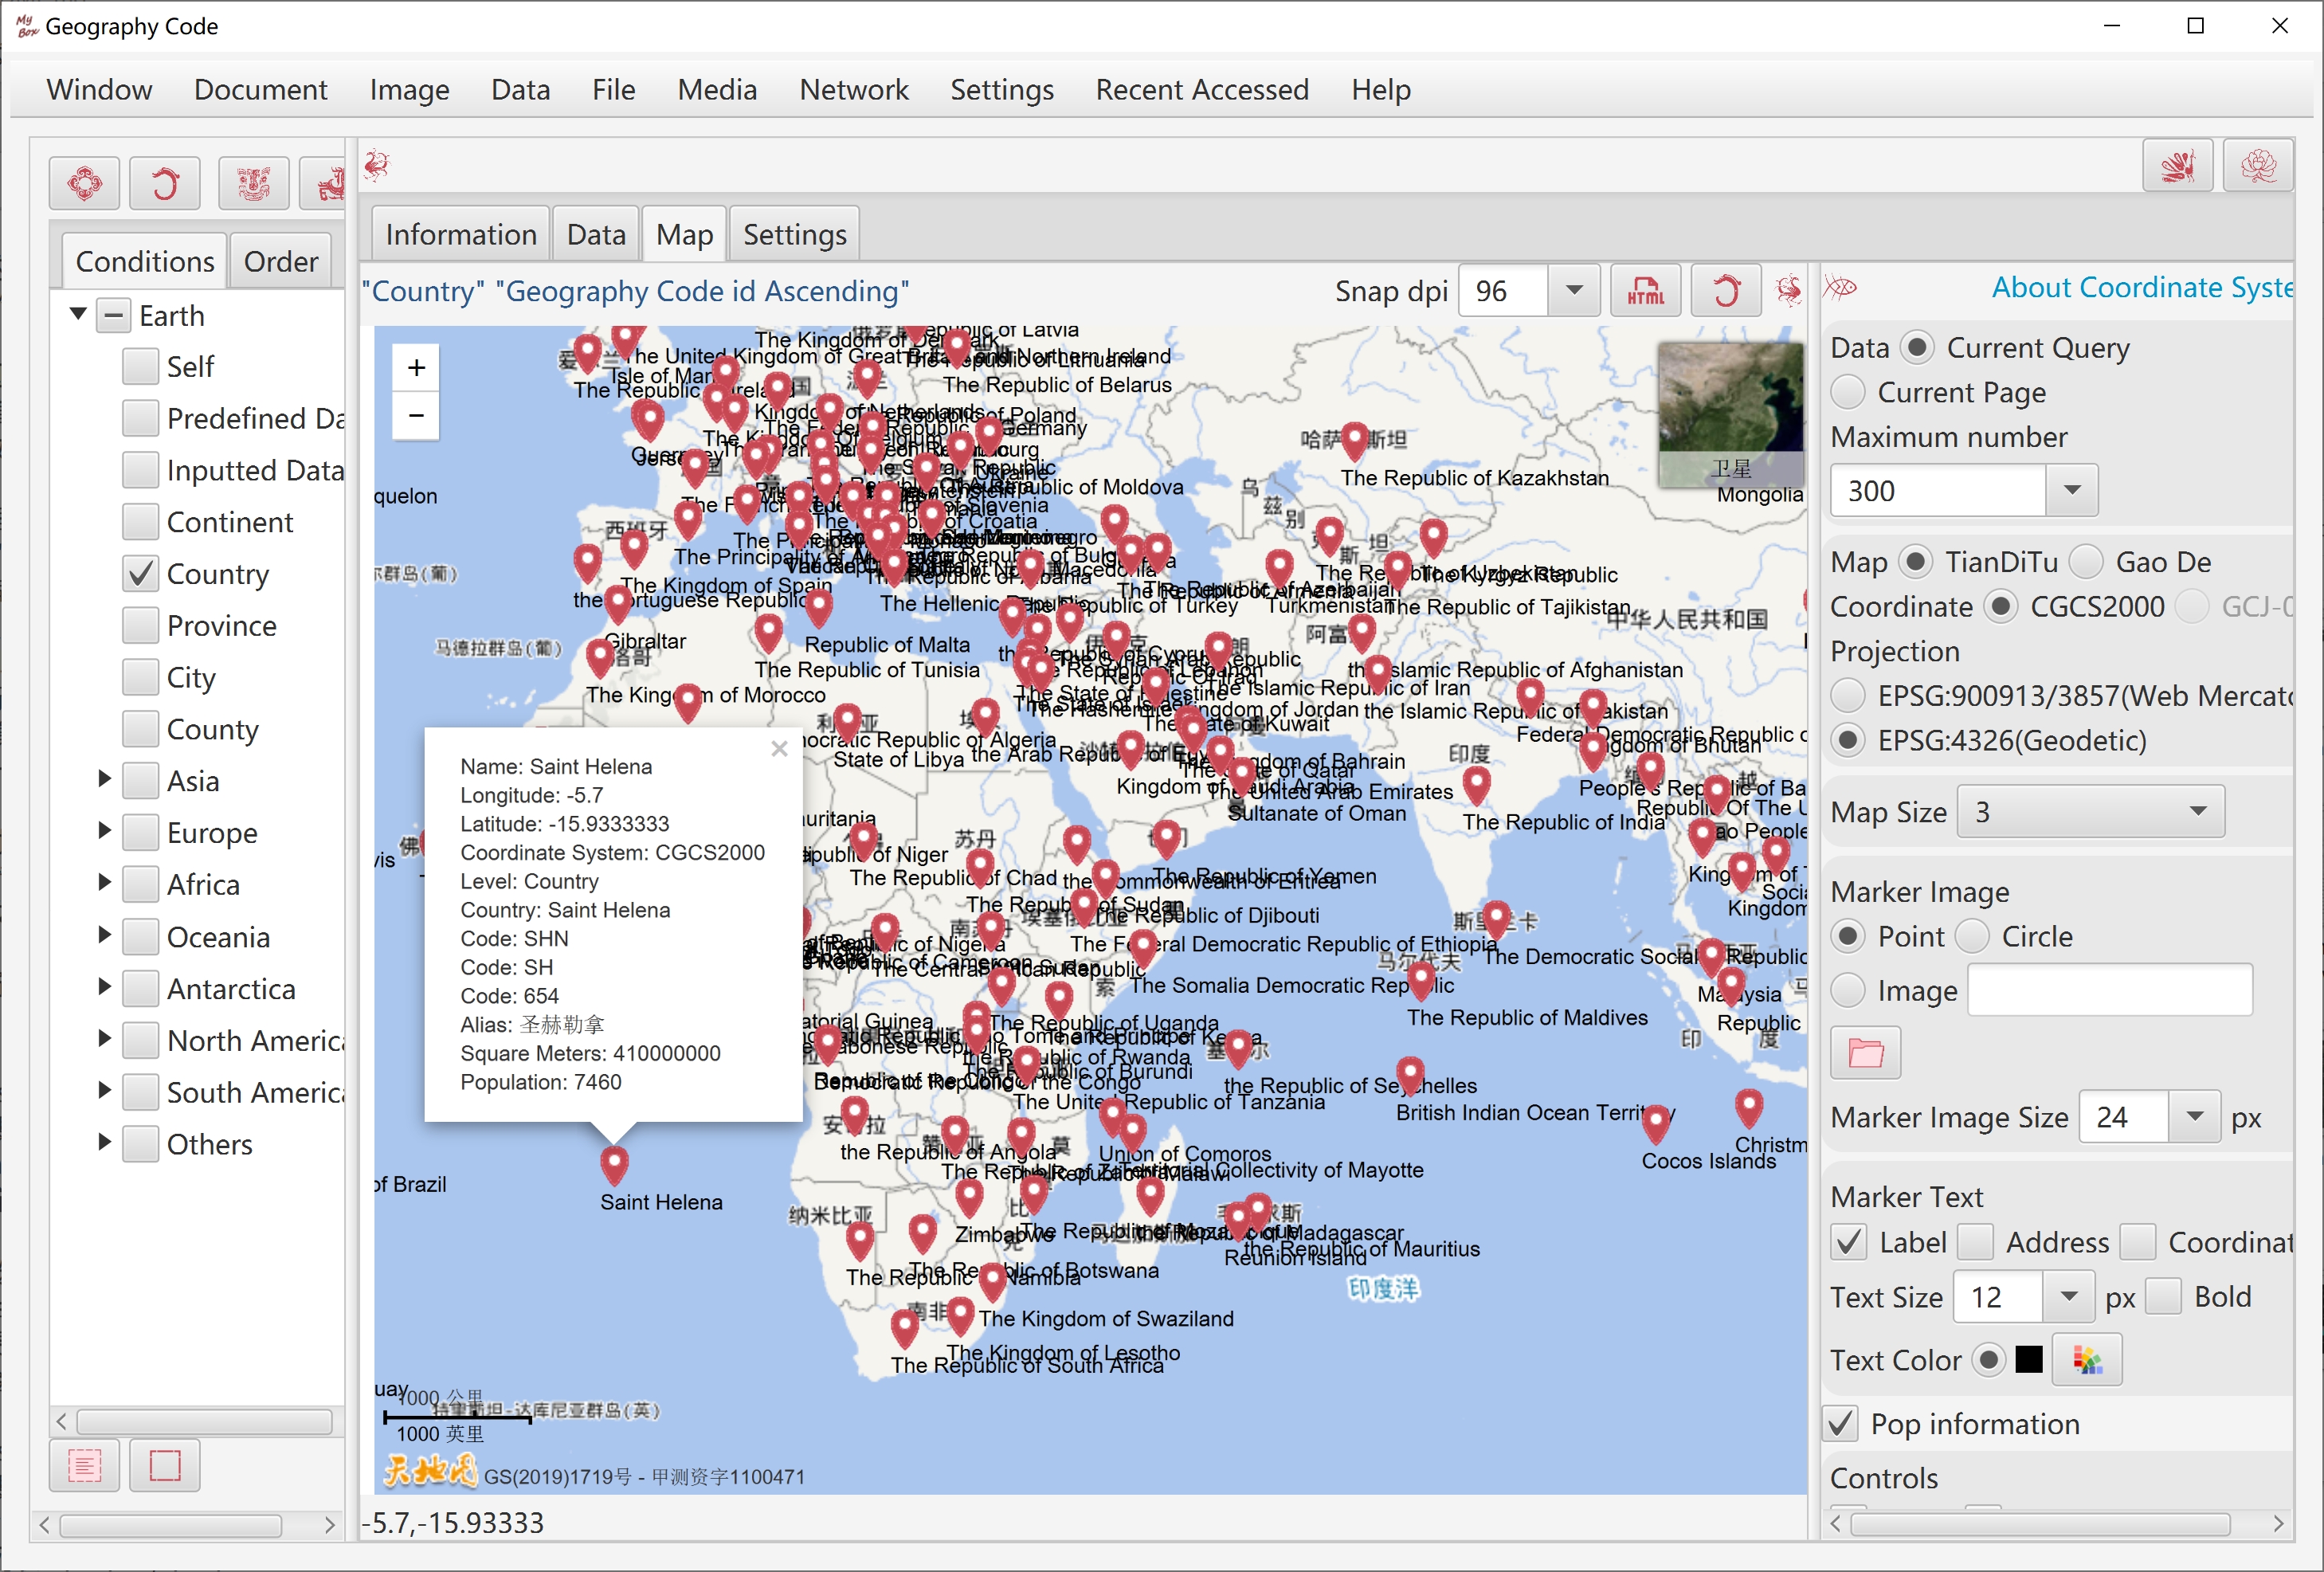
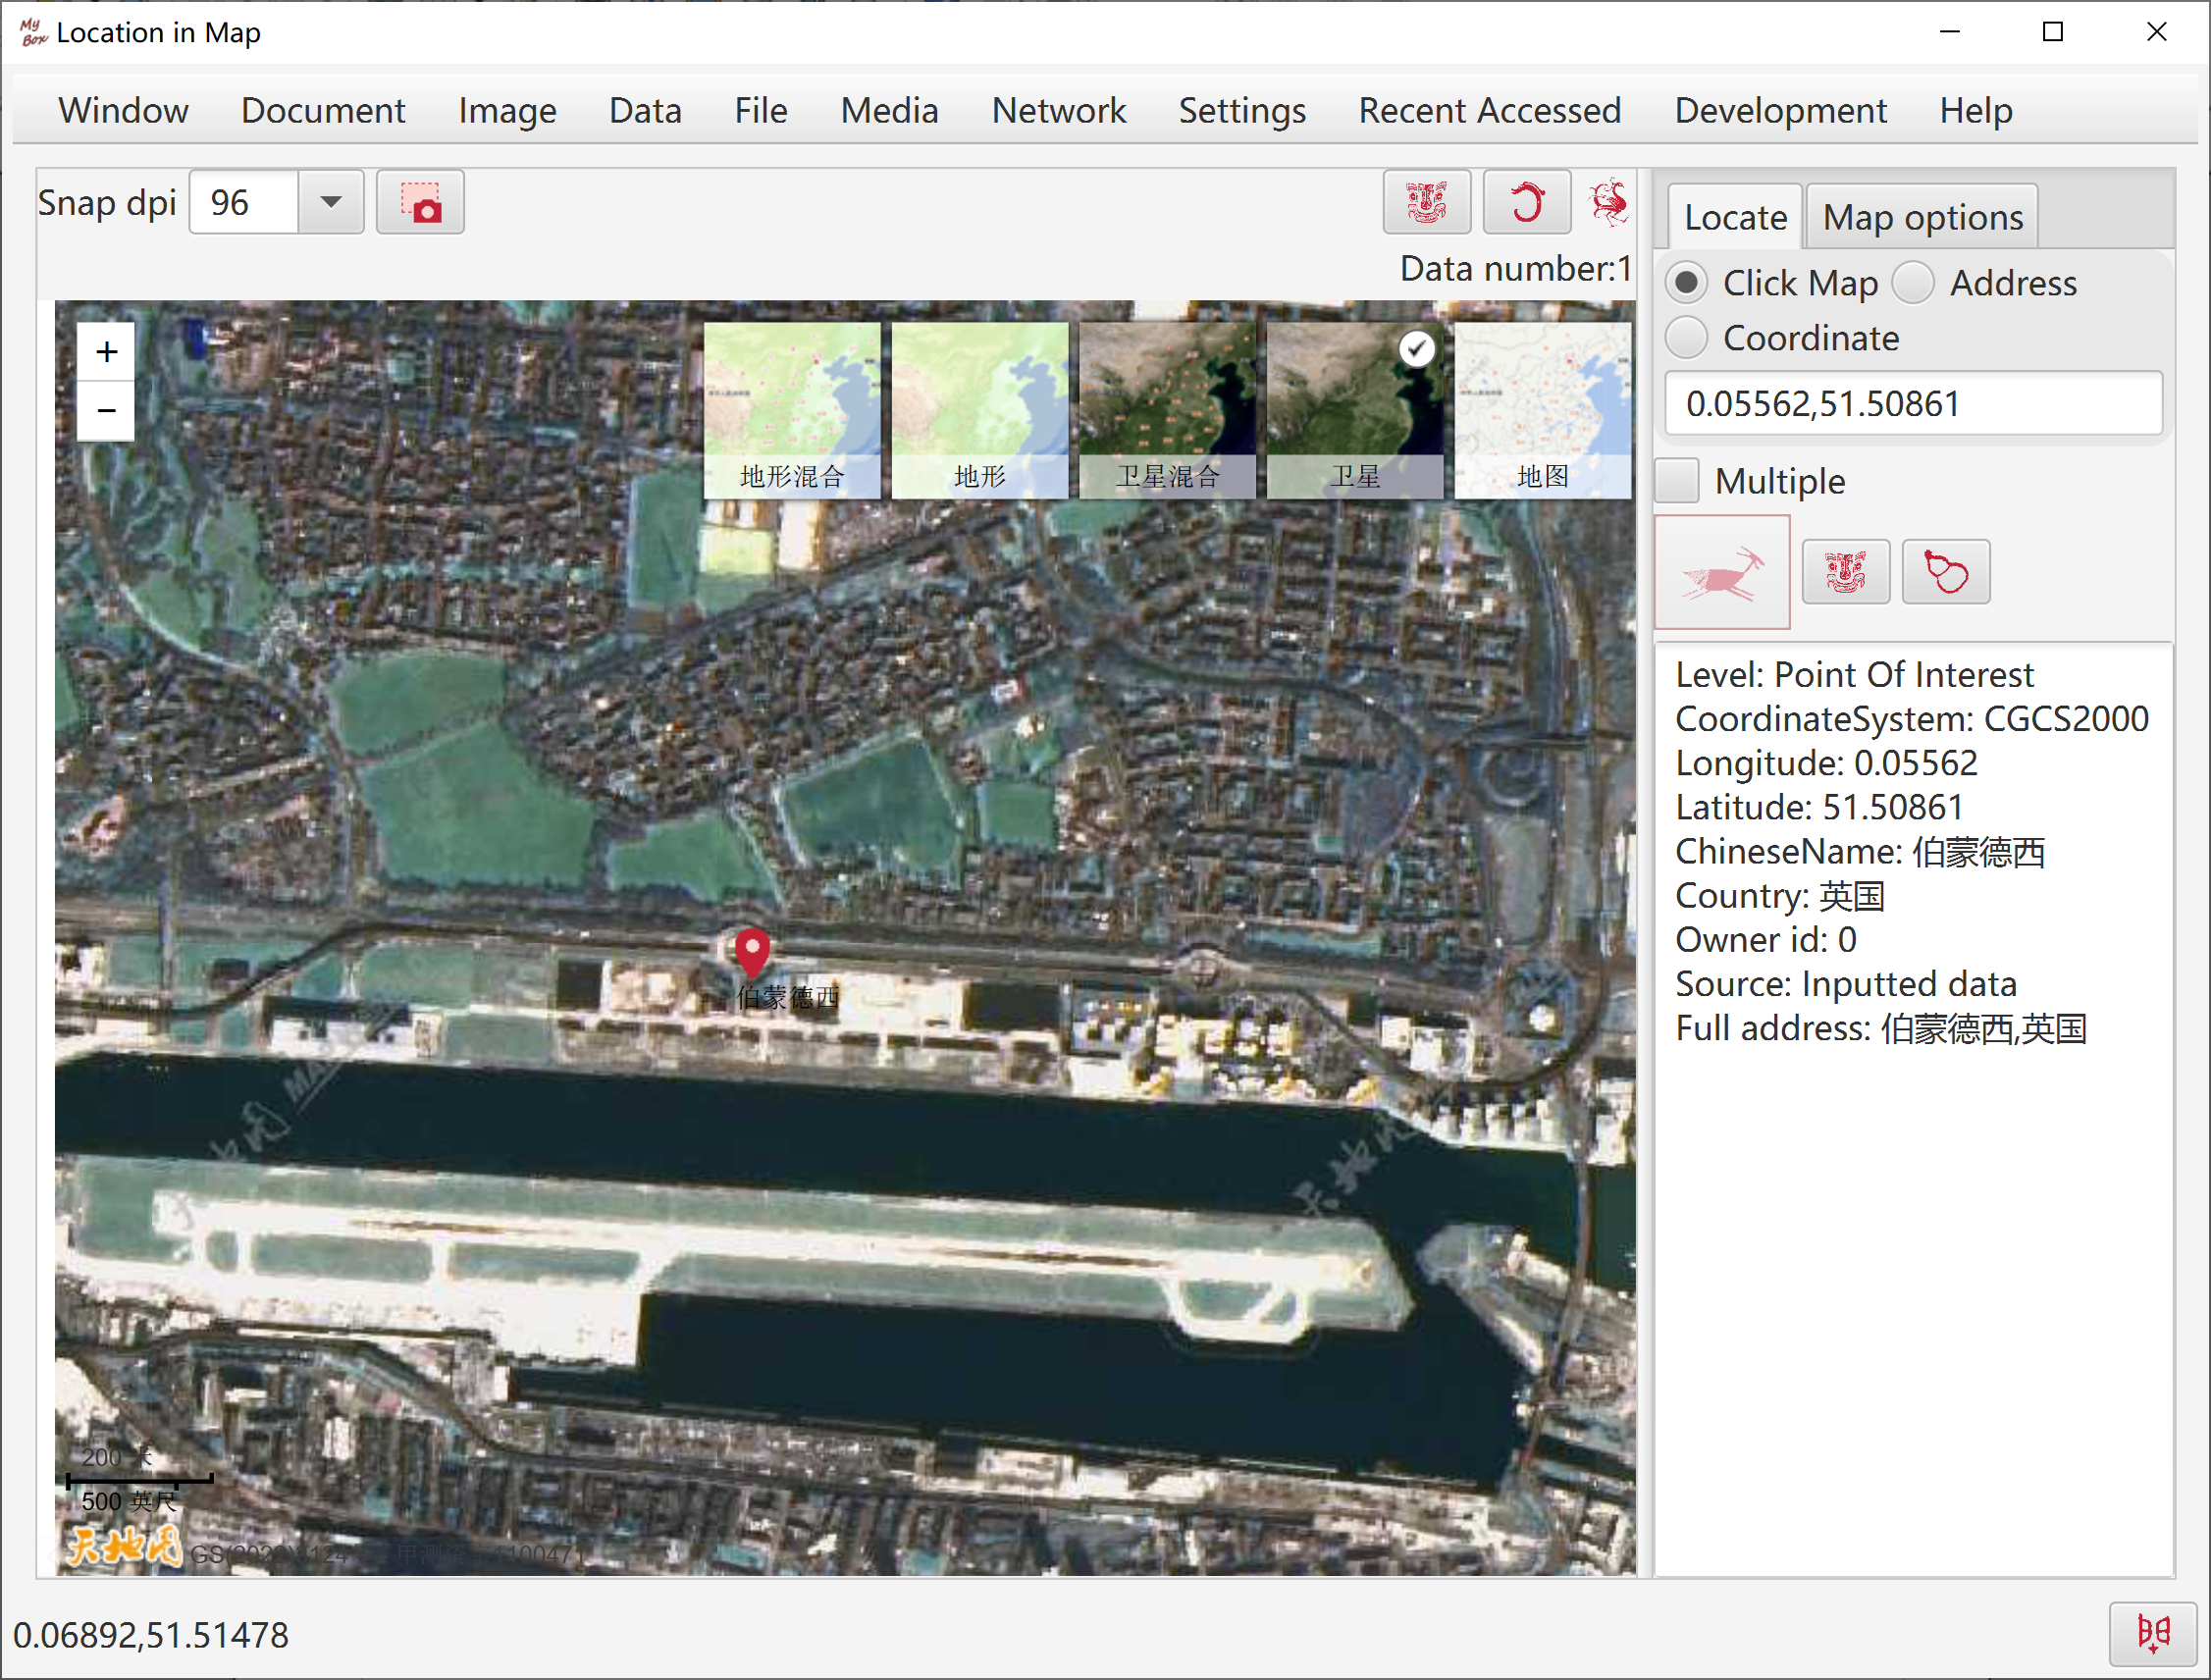
Kinds of data can be presented in map, including Geography Codes, Location Data, and Coordinate Querying.
Data in map can be:
All data which satisfy current query condition. "Maximum number of data" can be set to avoid performance issues.
Data in current page.
TianDiTu:
Accepts coordinates of CGCS2000 and display them at correct locations without offsets.
When display other coordinates, MyBox converts them to CGCS2000 to show correct locations.
Projection can be selected: EPSG:900913/3857(Web Mercator) or EPSG:4326(Geodetic).
Controls can selected: Zoom, Scale, Map Type, Symbols.
Map Types: Standard, Satellite, Mixed Satellite, Terrain, Mixed Terrain.
Languages in different regions.
Range of map levels is 1-18.
GaoDe Map:
Accepts coordinates of GCJ-02 and display them at correct locations without offsets.
When display other coordinates, MyBox converts them to GCJ-02 to show correct locations.
Projection is EPSG:900913/3857(Web Mercator).
Map layers:
Can select multiples: standard, satellite, roadnet, traffic.
Roadnet layer and traffic layer are only supported for China.
Satellite layer is supported for part of foreign addresses.
Opacity can be set for each map layer.
Map language: Chinese, English, Chinese and English.
Range of map levels is 3-18
Can selected "Fit View" to adjust map level and center as best automatically while display all data.
Adjust map level by:
Scroll mouse wheel.
Click map controls.
Select "Map Size"
Marker image:
Selections: point(bubble), circle, or any image.
For Location Data, more selections: Data Set Image, Data Image. Point will be used if no valid value.
Size can be set(Same size for width and height)
Marker text:
Selections: Label, Coordinate, Address.
For Location Data, more selections: Start Time, End Time, Data Value, etc.
Multiples selections can be picked. Each selection will be showns in a line.
Size can be set.
Can select whether text is bold.
Color can be set. For Location Data, "Data Color" can be chosen.
Pop information:
Detailed information can be popped when mouse is upon marker.
Can select whether pop information.
Snapshot:
DPI can be set.
Current map and data in map can be saved and displayed in html.
Keys of map can be changed in "Settings". The default keys are free and shared by all MyBox users.
Basical attributes: id, level, longitude, latitude, chinese_name, english_name, 5 codes, 5 aliases,
Subordinate: owner, continent, country, province, city, county, town, village, building. ("Ancestors")
Auxiliary attributes: altitute, precision, coordinate system, area(square meters), population, comments, isPredefined.
Not null values: id, level, chinese_name or english_name.
Values of "level": global(only "Earth"), continent, country, province(state), city, county(district), town, village(neighborhood), building, point of interest.
Data is unnecessary to be subordinated level by level. Cross-over can happen. Example, a village is subordinated to Antarctica, and a city belongs to a country without province level.
Match data:
One of following can determine an address:
Match “id"(assigned by MyBox automatically). This is accurate matching.
Match "level" + ancestors + "chinese_name"/"english_name"/any one "alias". This is accurate matching.
Match "level" + "chinese_name"/"english_name"/any one "alias". This is fuzzy matching. Duplicated names in same level can cause false matching.
Matching of name or alias is case-insensitive.
Sometimes 5 "code" are useful to match data.
"subordinate" of data is set by selecting node in locations tree.
"level" of data should be lower than its ancestors.
Data must have either chinese_name or english_name.
Select or display coordinate in map.
Set as "Predefined data" or "Inputted data" against selected rows.
All geograhy codes in MyBox are organized as a Locations Tree by their subordination relationship. Multiple nodes can be selected.
Include continents, countries, Chinese provinces /cities /counties.
Countries have values of "area" and "population".
Download address:
https://github.com/Mararsh/MyBox_data/tree/master/md/GeographyCode/en
Necessary fields:
Level,Longitude,Latitude
And "Chinese Name" or "English Name"
Optional fields:
Altitude,Precision,Coordinate System,Square Kilometers,Population,
Code 1,Code 2,Code 3,Code 4,Code 5,Alias 1,Alias 2,Alias 3,Alias 4,Alias 5,
Continent,Country,Province,City,County,Town,Village,Building,Comments
Download address:
http://download.geonames.org/export/zip/
Tab-delimited text in UTF8 encoding.
Data fields:
countryCode postalCode placeName
adminName1 adminCode1 adminName2 adminCode2 adminName3 adminCode3
latitude longitude accuracy
Coordinate system is WGS_84.
Same address is written only once even when it has multiple "postal code" or coordinates.
Customize colors of data rows.
Provide "Default" and "Random" buttons.
Query geography code by:
Click map.
Input address.
TianDiTu supports chinese and foreign addresses in Chinese(like "伦敦") or in English(like "Paris")
GaoDe map only supports addresses in China.
Input longitude and latitude.
Query result can be saved in Geography Code table.
Convert coordinate value between decimal and DMS. Valid examples of DMS:
48°51'12.28"
-77° 3' 43.9308"
48°51'12.28"N
2°20'55.68"E
S 34° 36' 13.4028"
W 58° 22' 53.7348"
118度48分54.152秒
-32度04分10.461秒
东经118度48分54.152秒
北纬32度04分10.461秒
西经118度48分54.152秒
南纬32度04分10.461秒
Convert coordinate values as other coordinate systems.
Supported 1-d barcodes:
Types: Code39, Code128, Codabar, Interleaved2Of5, ITF_14, POSTNET, EAN13, EAN8, EAN_128, UPCA, UPCE, Royal_Mail_Customer_Barcode, USPS_Intelligent_Mail
Options about 1-d barcodes: Orientation, width/height, dpi, text location, font size, quiet-zone width, etc.
Supported 2-d barcodes:
Types: QR_Code, PDF_417, DataMatrix
Options about 2-d barcodes: Width/height, margin, error correction level, compact mode, etc.
A picture can be shown in center of QR_Code. Its size can be adjusted automatically according to error correction level.
Examples of parameters and suggested values.
Validate generated barcode at once.
Supported 1-d barcodes: Code39, Code128, Interleaved2Of5, ITF_14, EAN13, EAN8, EAN_128, UPCA, UPCE
Supported 2-d barcodes: QR_Code, PDF_417, DataMatrix
Display contents of barcodes and its meta data including barcode type and error correction level if any.
Create digest for files or inputted texts.
Support MD2, MD5, SHA-1, SHA-224, SHA-256, SHA-384, SHA-512/224, SHA-512/256, SHA3-224, SHA3-256, SHA3-384, SHA3-512.
Ouput: Base64, Hexadecimal, Formatted hexadecimal.
Encode file or texts as Base64.
Decode Base64 file or Base64 texts.
Set charset for texts.
Output as file or texts.
<End of Document>
Page